
2 Variances Test Tutorial
When to use this tool
Use the 2 Variances test to compare the variances of two independent populations. As an example, an automobile manufacturer may compare the variances of two methods of paint application, to select the one with a more consistent finish (this example is worked out in the summary data section below).
The test makes the following assumptions:
- The data are continuous numeric.
- The units are randomly sampled.
- The two groups are independent.
- The two groups are normally distributed.
Note: The 2 Variances test is sensitive to violations of the normal distribution assumption.
Using EngineRoom
The test can be used on raw data (the actual sample measurements) or sample summary data in the form of the sample sizes and variances.
Select the 2 Variances test from the Parametric menu OR follow the steps in the Hypothesis Testing Wizard for two continuous data variables.
Example:
Notes:
- The chart demonstrations below have the Guided Mode disabled, so it combines some steps in one dialog box. You can enable or disable Guided Mode from the User menu on the top right of the EngineRoom workspace.
- In this example we will use the standalone test from the Parametric menu. You can also use the Hypothesis Testing Wizard to run the test.
- The tutorial video demonstrates the summary sample data procedure, shown below the raw data example.
Raw data
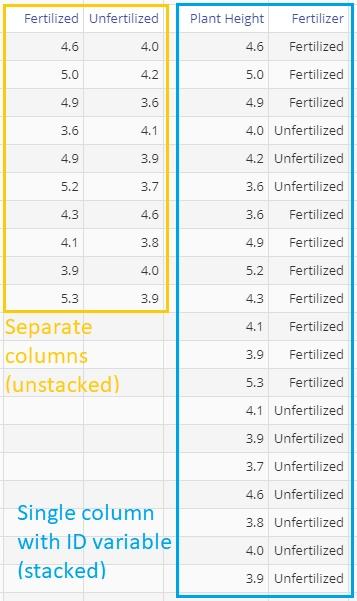
The variances of two groups of 10 plants each are to be compared - one group is fertilized while the other is not. Test whether the heights of the fertilized plants vary more than those of the unfertilized plants.
When using raw data, your data variables may be in two separate columns, or in a single column with a second column containing the group IDs (this variable should be dragged on to the Group Variable drop zone on the study):
Using the stacked data with group ID variable and the Guided mode disabled, the steps are:
Steps:
- Select the Analyze menu > Parametric > Click on the 2 Variances Test
- Drag the Plant Height variable onto the Data Variables drop zone on the study:
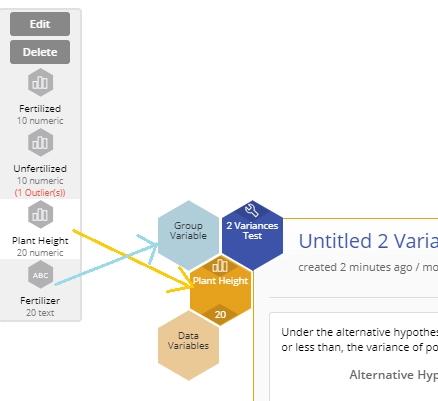
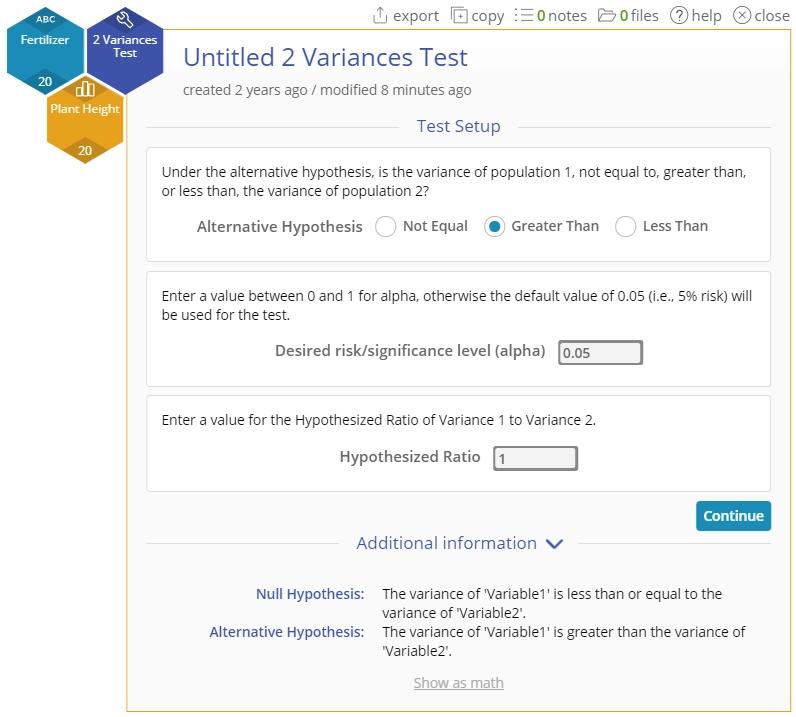
- Drag the Fertilizer ID variable onto the Group variable drop zone, set up the test as shown, and click Continue:
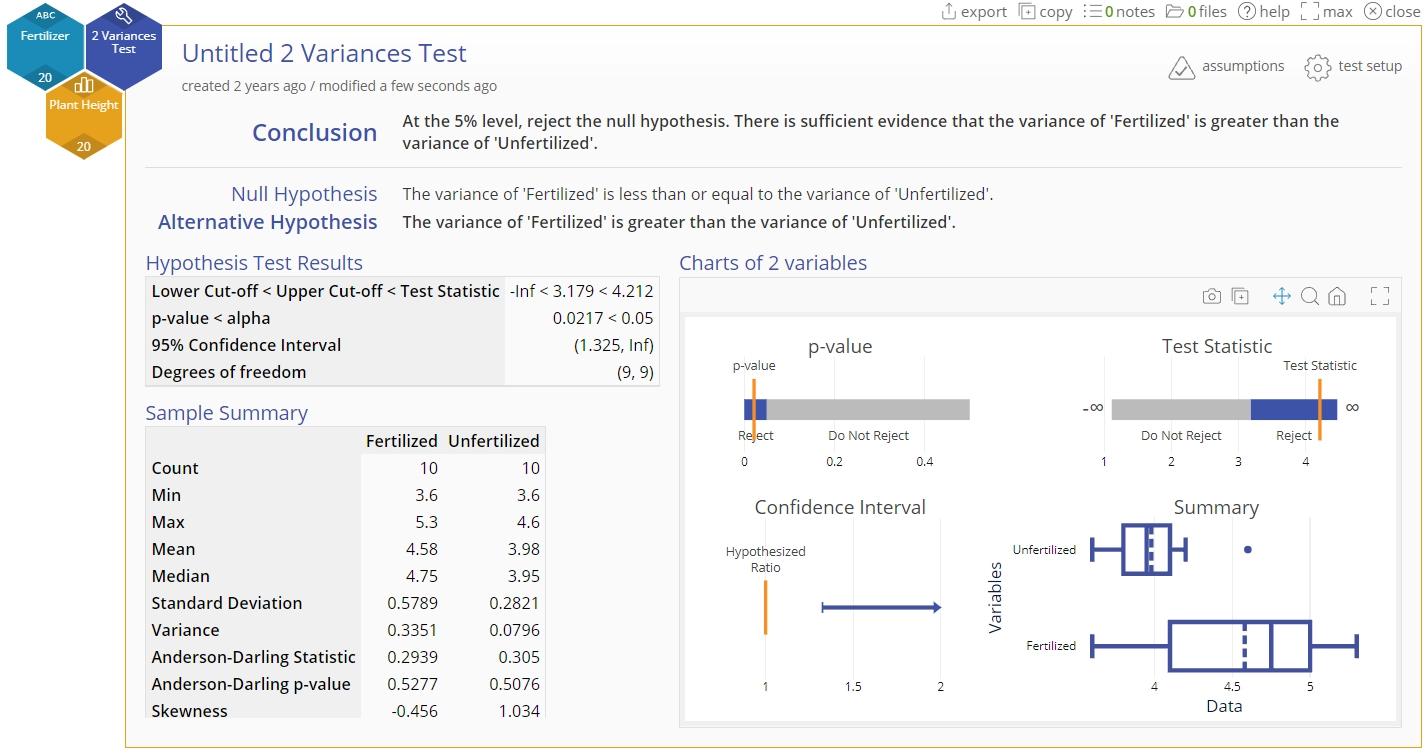
- The 2 Variances Test output using raw data is shown:
Notes:
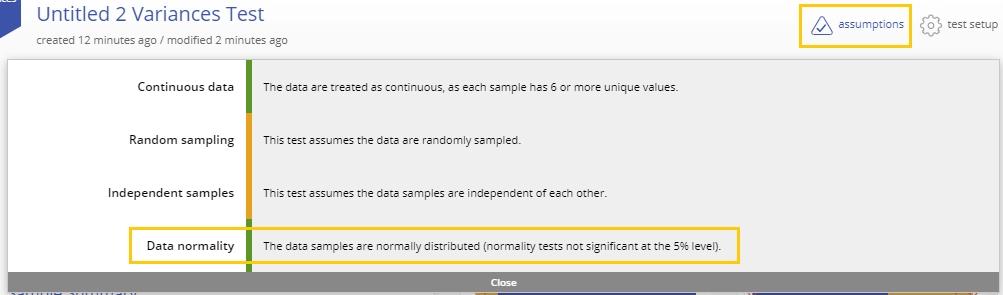
- Click on the assumptions button at the top right of the study to see the assumptions checks:
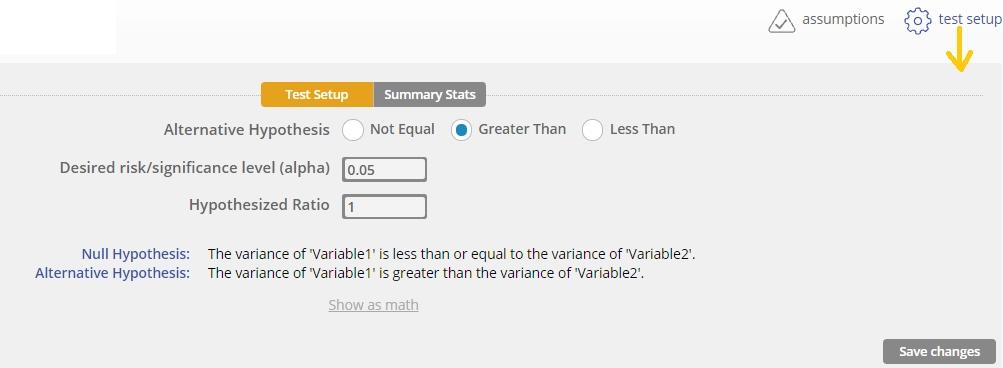
- You can change the test settings by clicking on the test setup button, next to the assumptions button:
Sample summary statistics
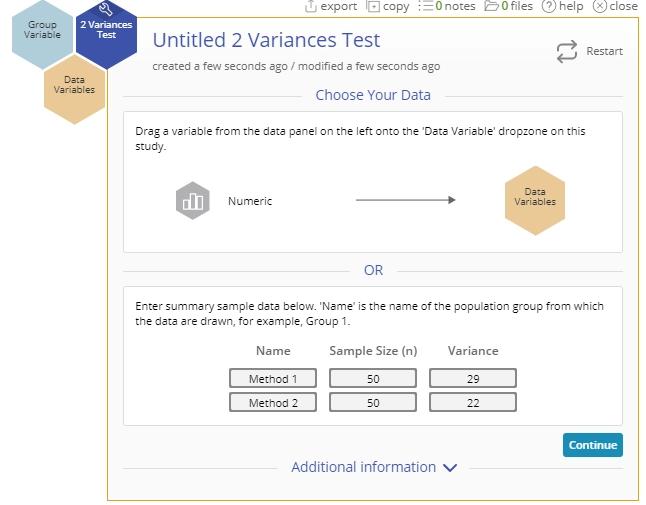
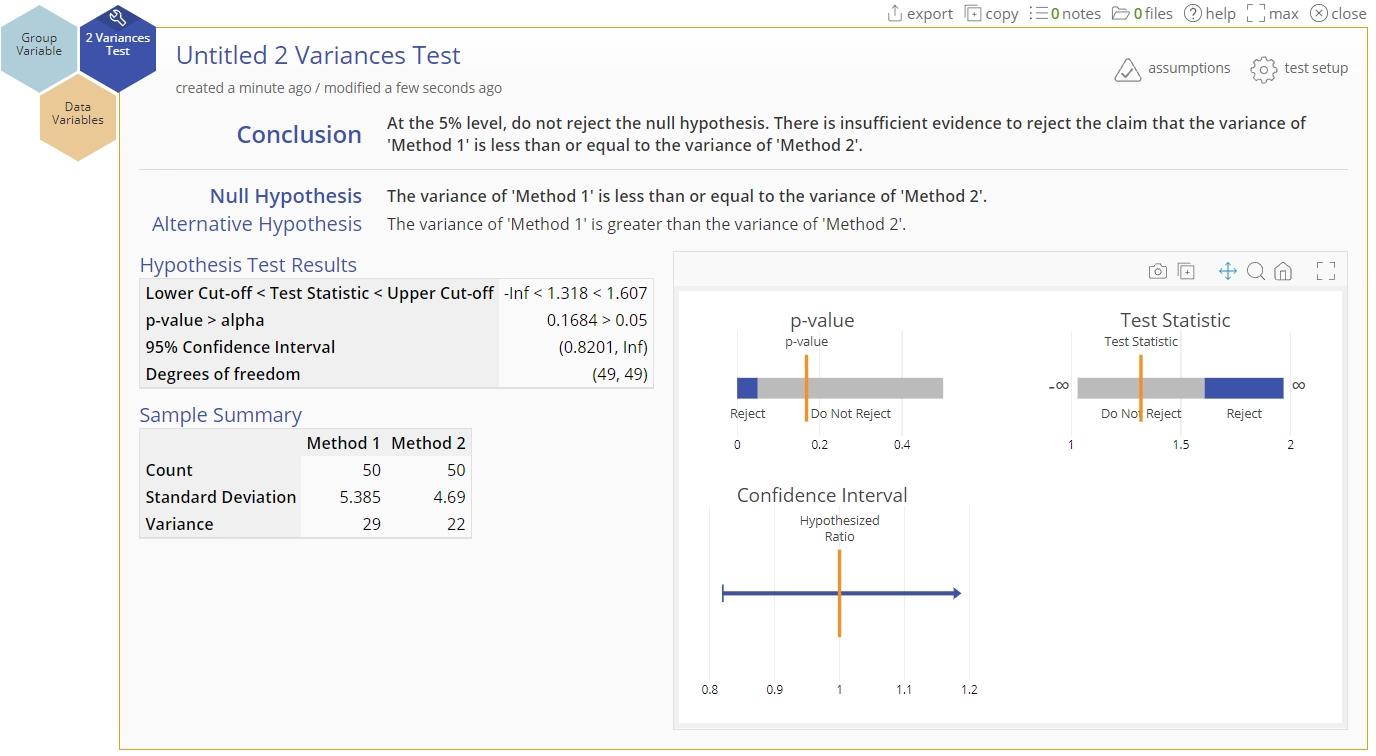
Recall the paint application example at the beginning of this article. Two methods of application are compared at the 1% level, to see which one is more consistent (has the smaller variance). The data are taken from 50 cars and the variances calculated, so we have:
Sample sizes: n1 = n2 = 50 Variances: var1 = 29, var2 = 22
Steps:
- Select the Analyze menu > Parametric > Click on the 2 Variances Test
- Enter the summary statistics for the paint methods data as shown and click Continue:
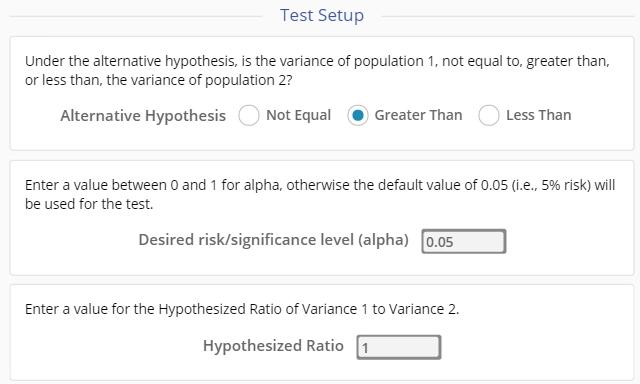
- Fill out the Test Setup screen as shown and Click Continue:
The 2 Variances Test output is slightly different from the output for raw data - because the actual values are not available, the Sample Summary table only includes the values entered into the dialog, and there is no graph of boxplots:
2 Variances Test Video Tutorial
Was this helpful?