
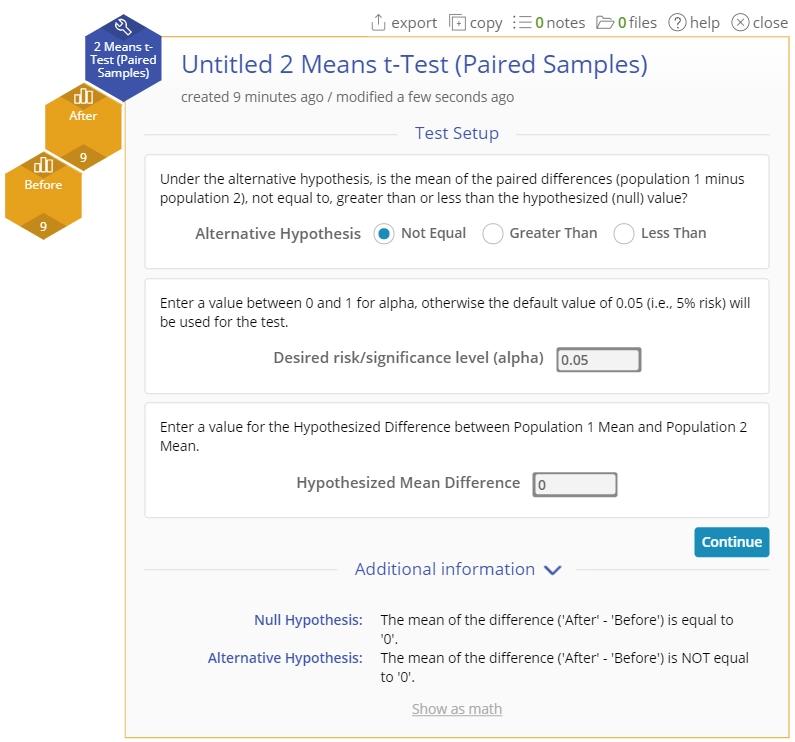
2 Means t-Test (Paired Samples) Tutorial
When to use this tool
Use this test to compare the means of two dependent (paired) populations, such as 'Before' and 'After' measurements of test scores for the same group of subjects. As an example, a researcher might use this test to compare the mean response time to a stimulus before and after a treatment regimen is administered to a group of subjects.
The test statistic is based on the differences of the paired observations across the two samples. The test itself is very similar to the one sample t-test.
The test makes the following conditions/assumptions:
- The paired differences are continuous numeric.
- The units are randomly sampled.
- The paired differences are normally distributed.
Using EngineRoom
The test can be used on raw data (the sample measurements) or sample summary data in the form of the mean and standard deviation of the differences.
Select the 2 Means t-Test (Paired Samples) from the Analyze menu > Parametric OR follow the steps in the Hypothesis Testing Wizard.
Example:
In this example we will use the standalone test from the Parametric menu.
Raw data
If using raw data, your data variables may be in two separate columns (unstacked) or in a single column (stacked) with a second column containing the group IDs. The group ID variable should be dragged on to the 'Grouping Variable' drop zone on the study.
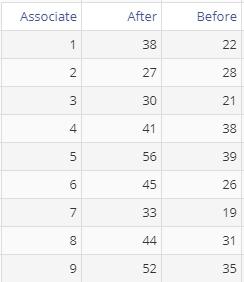
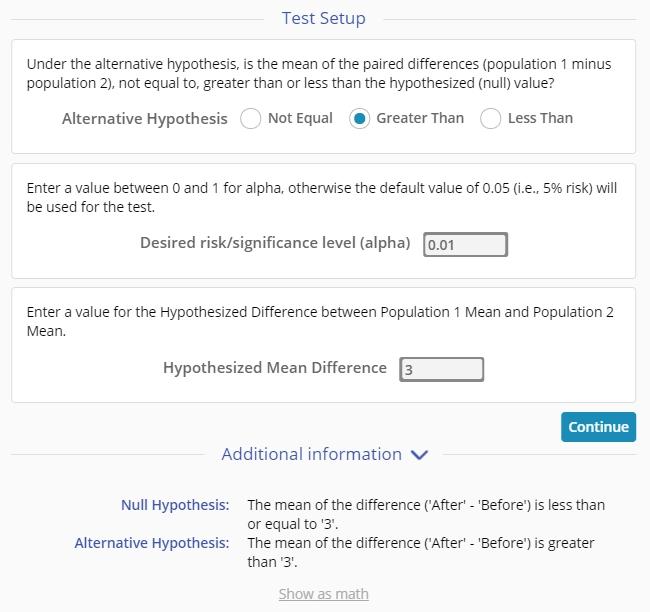
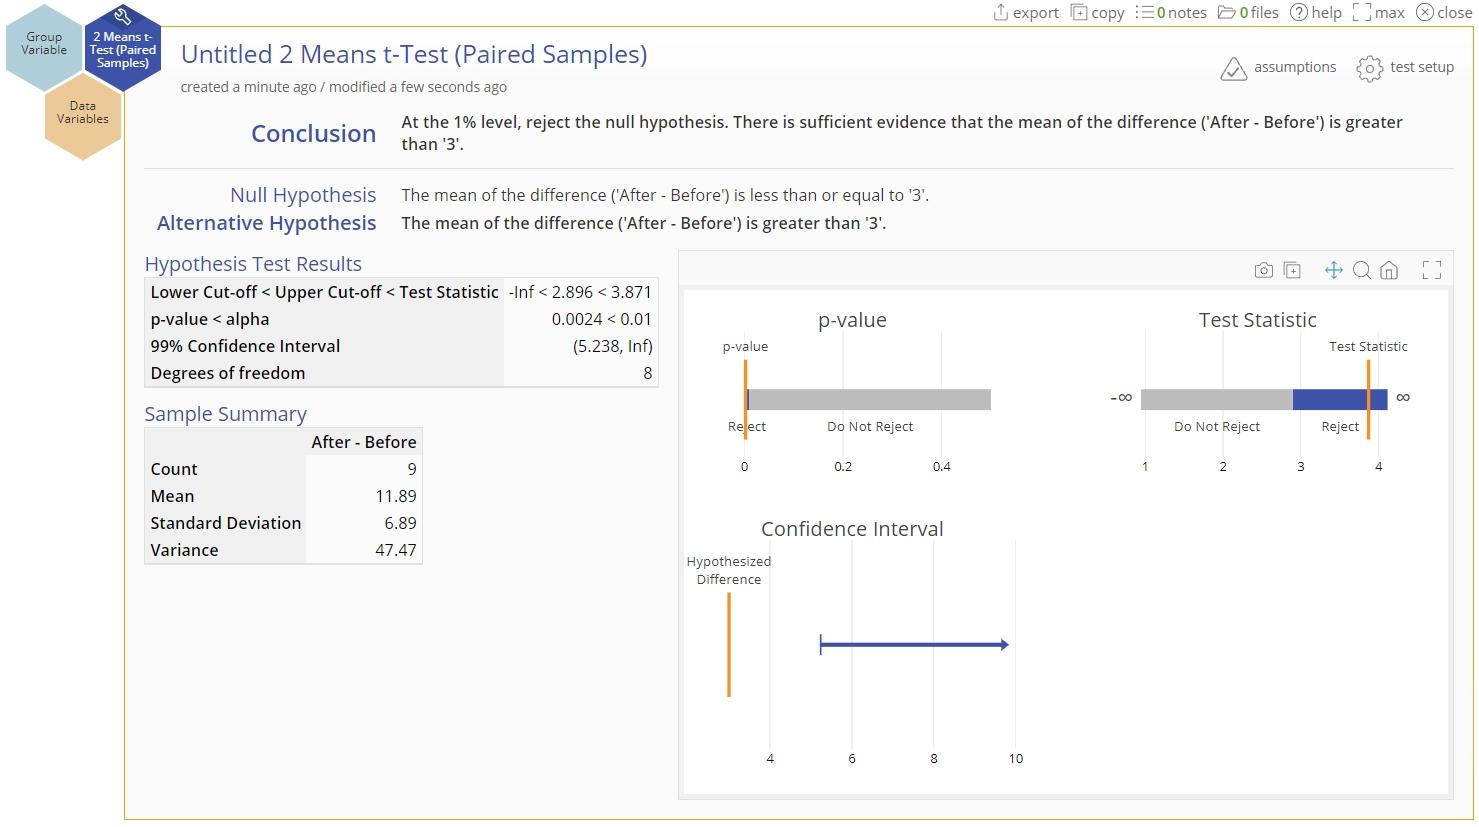
For this example, we have unstacked data on the sales (in thousands) made by 9 associates Before and After a training program. We want to test whether training increased the sales by more than $3K.
Note: For the Paired samples test, the number of observations in the two groups must be equal.
Steps:
- Open the 2 Means t-Test (Paired Samples) tool from the Parametric menu
- Drag the After variable onto the Data variable drop zone, then drag the Before variable onto the second Data variable drop zone on the study:
- Set up the test as shown (note the hypothesized value under the null hypothesis = 3), and click Continue:
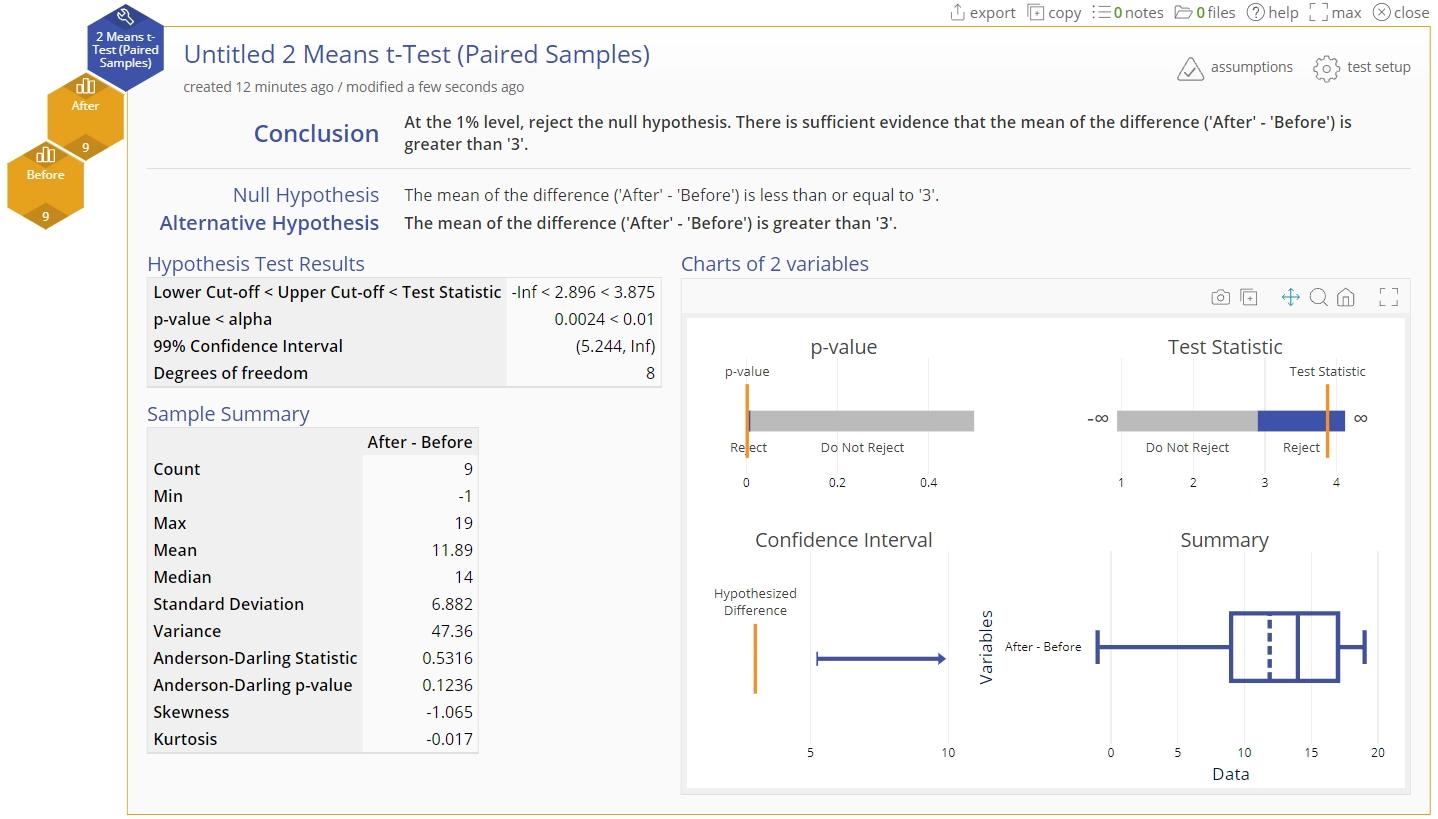
- The 2 Means t-Test (Paired Samples) output using raw data is shown:
If you have sample summary statistics
If you have the sample summary data for the differences of the paired observations, enter them into the test dialog and follow the remaining steps as above:
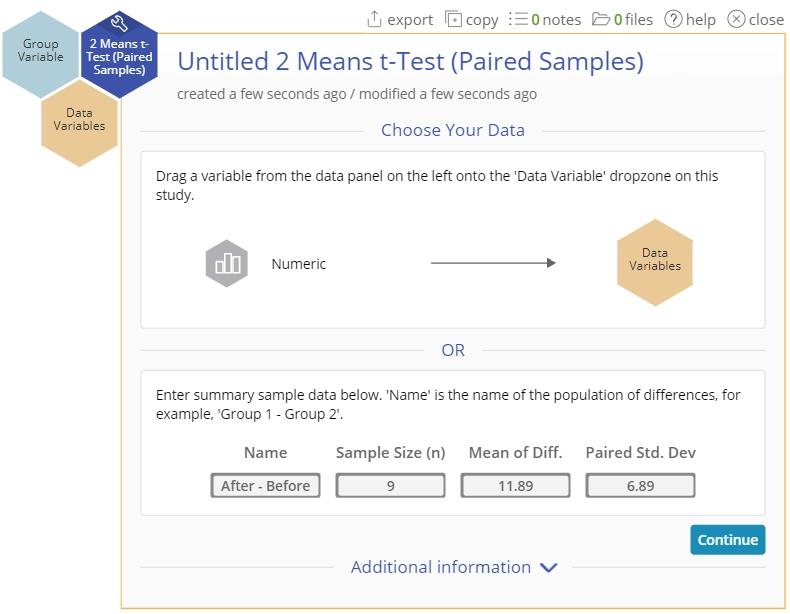
The 2 Means t-Test (Paired Samples) output using summary data is shown:
2 Means t-Test (Paired Samples) Video Tutorial
Instructor Resources
Was this helpful?