
Attribute Agreement Analysis
When to use this tool
Measurement systems analysis (MSA) helps you assess whether the measurement system being used in a given application meets your criteria for accuracy and reliability. Attribute Agreement Analysis (or Attribute MSA) is one of the tools within MSA, used to evaluate your measurement system when attribute (qualitative) measurements are involved. With this tool you can check that measurement error is at an acceptable level before conducting data analysis.
Attribute Agreement Analysis quantifies three types of variation: (1) variation within an individual appraiser's repeated measurements, (2) variation between different appraiser's measurements, and (3) variation between the appraiser's measurements and a reference or standard.
You can use this tool to evaluate measurements based on binary (2 categories), nominal (more than 2 unordered categories) and ordinal (two or more ordered categories) categories.
Using EngineRoom
Note: the demonstration below has the Guided Mode disabled, so it combines some steps in one dialog box. You can enable or disable Guided Mode from the User menu on the top right of the EngineRoom workspace.
To use the tool, select the Measure menu > Measurement System Analysis (MSA)... > Attribute Agreement Analysis. The study opens on the workspace:
There are four hexagons or 'drop zones' attached to the study - you can hover over them to see the requirements of each:
- Measurement Variable (required): used for the variable containing the measurement data from the study. Can be numeric or text.
- Appraiser Name Variable (required): used for the variable identifying the appraiser names. Can be numeric or text.
- Part Number Variable (required): used for the variable identifying the part numbers. Can be numeric or text.
- Reference Variable (optional): This is the only optional drop zone, used for the variable containing the reference or standard 'true' measurements corresponding to the set of parts used in the study.
Binary Data Example:
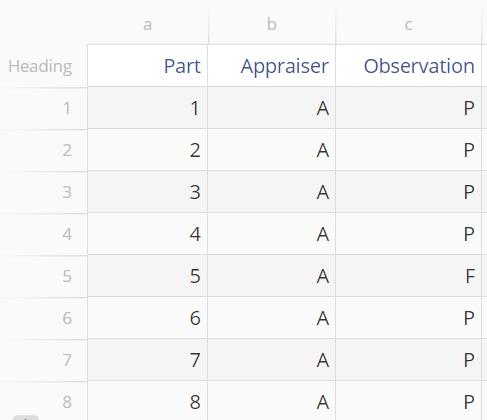
Upload the MSA_Binary_Before data to EngineRoom. The data set contains three columns of data:
- Part: These are the part numbers of the 20 parts used in the study
- Appraiser: Contains the identifiers for the 2 appraisers, identified as A and B
- Observation: The binary evaluations designating each guest-staff interaction as either P=Pass or F=Fail
The hotel's criteria for an acceptable evaluation system is 95% or higher agreement in any single appraiser's assessments, and 95% or higher agreement between appraisers. We will analyze the data and compare the calculated percent agreements with these criteria.
Steps:
- Go to Measure > Measurement System Analysis (MSA) in the DMAIC menu (or Quality Tools in the Standard menu) and open the Attribute Agreement Analysis tool onto the workspace.
- Navigate to the data source and drag Observation onto the Measurement Variable hexagon.
- Drag Appraiser onto the Appraiser Name Variable hexagon.
- Click on the data source and drag Part onto the Part Number Variable hexagon.
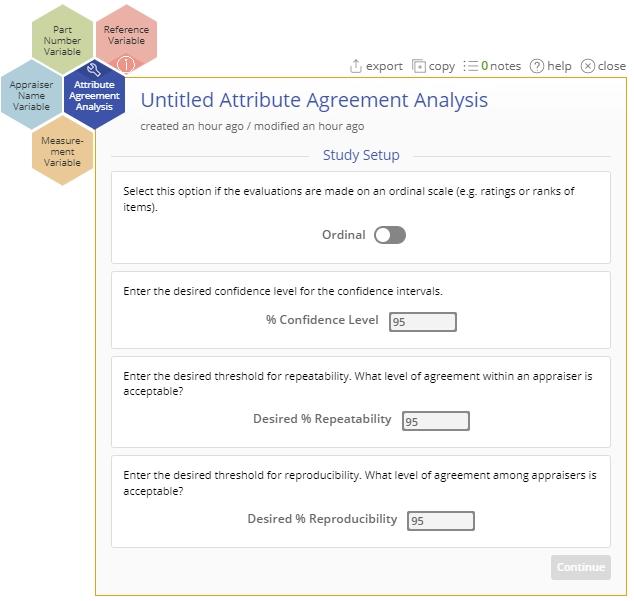
- Customize the study options to your requirements:
- Click the Ordinal radio button if your observations have a rank order to them
- Enter a value between 0 and 100 for the percent confidence level for the confidence intervals - the default is 95%
- Enter a value between 0 and 100 for the desired percent agreement within a single appraiser’s assessments (called Repeatability), with the default being 95%
- Enter a value between 0 and 100 for the desired percent agreement between different appraisers’ assessments (called Reproducibility), with the default being 95%
For this example use the defaults and click Continue.
Results: The Attribute Agreement Analysis output includes graphical and numeric output:
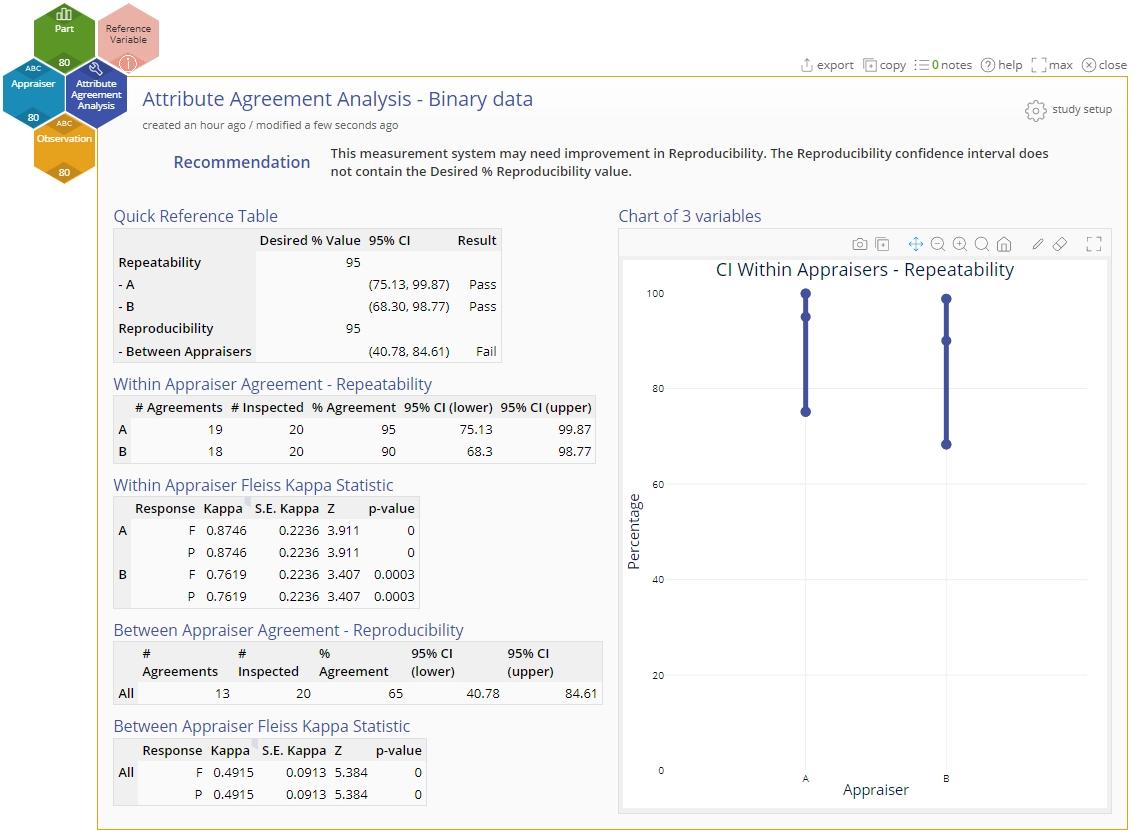
1. The recommendation at the top summarizes the key findings of the analysis which are displayed in the Quick Reference Table.
2. The rest of the tables are as follows:
- Within Appraiser Agreement - Repeatability: shows the Percent Agreement of each appraiser's assessments across multiple trials and the corresponding confidence intervals.
- Within Appraiser Fleiss Kappa Statistic table: An agreement/reliability statistic which takes values in the range -1 to +1. Values close to +1 indicate strong agreement within the assessments made by the same appraiser. Kappa values near 0 indicate results due to guesswork or random chance and values near -1 indicate the agreement is reversed, i.e., a systematic disagreement among the appraiser's assessments. A test of significance and its p-value are displayed to assess the significance of each result.
- Between Appraiser Agreement - Reproducibility: shows the Percent Agreement among multiple appraisers and the corresponding confidence intervals.
- Between Appraiser Fleiss Kappa Statistic table: An agreement/reliability statistic similar to that used for within-appraiser agreement, except these statistics evaluate the agreement between two or more appraisers.
3. The graph on the right shows the Confidence intervals for the Within Appraiser agreement corresponsing to appraisers A and B.
Note: If a Reference/Standard column is dragged on to the optional hexagon (drop zone) on the study, the output displays an additional graph for the Confidence intervals comparing each Appraiser against the Standard.
Ordinal Data Example:
Upload the Ordinal data set called MSA_Ordinal. The data consist of four columns: Part, Appraiser, Observation and this time, an additional Reference column is included:
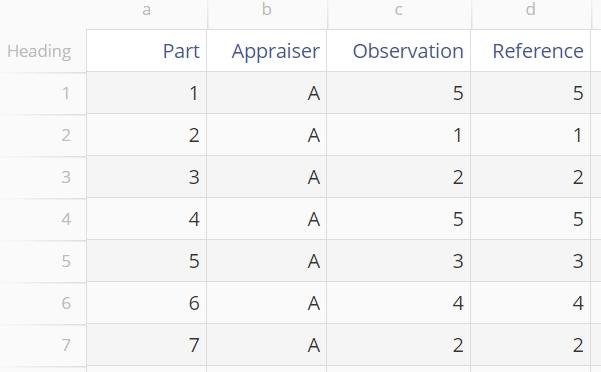
Now run the analysis on the data: drag on the variables to the corresponding hexagons. This time, switch the Ordinal radio button option on and leaving all other options at their defaults:

Click Continue to see the output:
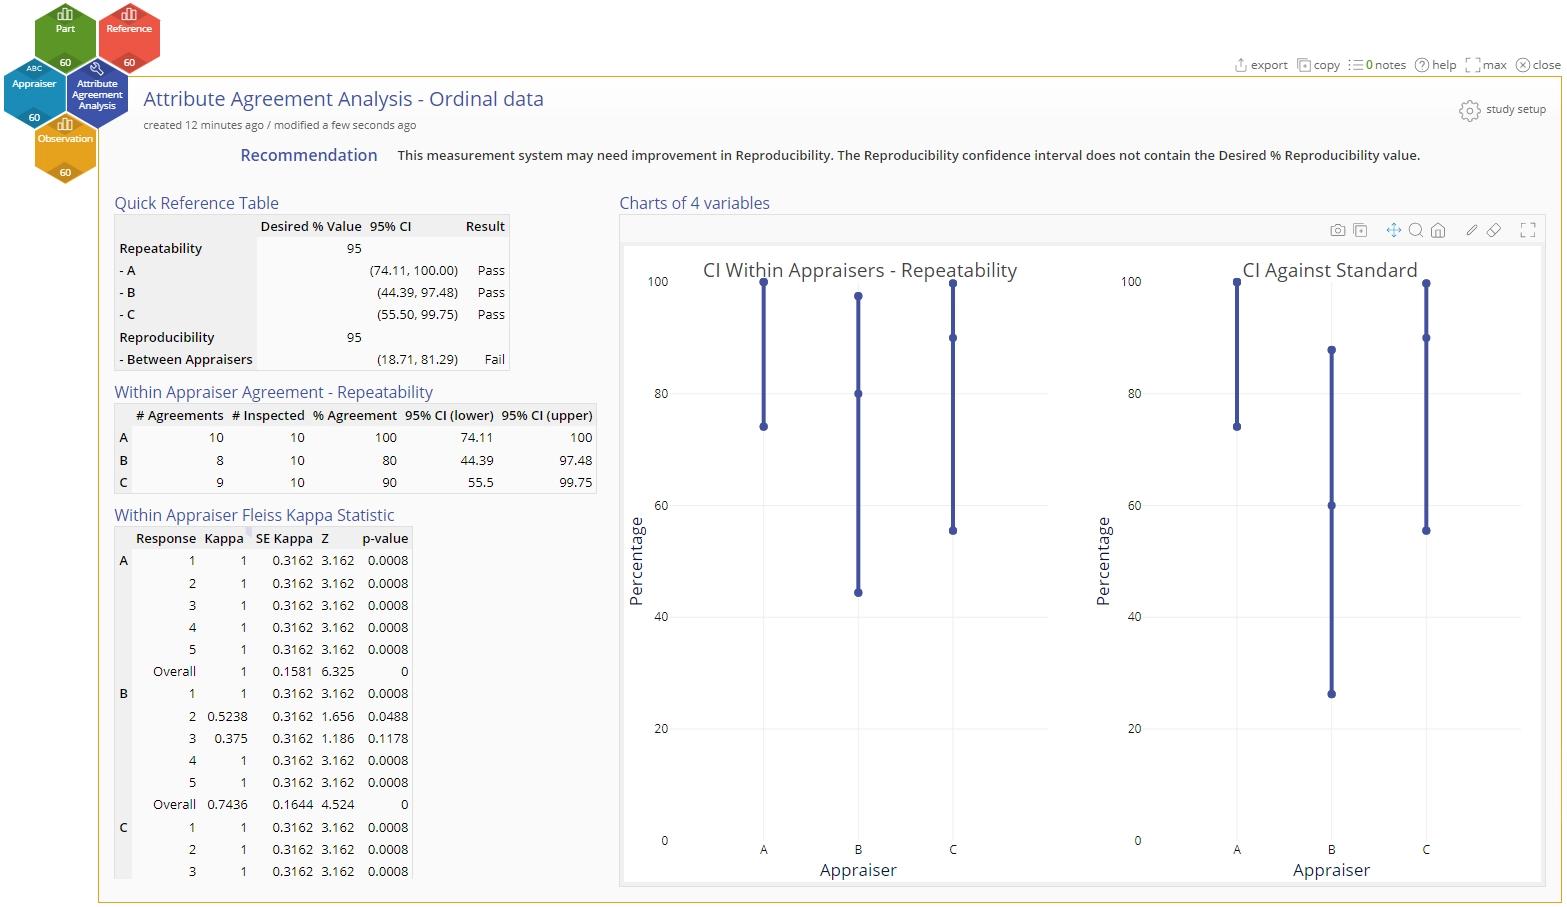
1. The recommendation at the top summarizes the key results which are displayed in the Quick Reference Table.
2. The graphical output shows the Confidence interval plots for:
- Within Appraiser Agreement
- Each Appraiser Against Standard
3. The numeric output includes tables on:
- Within Appraiser Agreement
- Within Appraiser Fleiss Kappa Statistic
- Within Kendall Coefficient of Concordance
- Each Appraiser Vs Standard
- Each Appraiser Vs Standard Fleiss Kappa Statistic
- Between Appraiser Agreement
- Between Appraiser Fleiss Kappa Statistic
- All Appraisers Vs Standard
- All Appraisers Vs Standard Fleiss Kappa Statistic
Video Tutorial
Instructor Resources
Was this helpful?