
Failure Modes and Effects Analysis (FMEA)
Tutorial
When to use this tool
Use the Failure Modes and Effects Analysis (FMEA) tool to prioritize potential defects based on their severity, expected frequency, and likelihood of detection. The FMEA matrix establishes priorities based on the risk of failure. Scores are assigned on a scale of 1 to 10 to each potential defect mode:
- Severity - seriousness of the failure mode (1 = Least severe, 10 = Most severe)
- Occurrence - likelihood of occurrence of the failure mode (1 = Least likely to occur, 10 = Most likely to occur)
- Detection - The likelihood of detection of the failure mode prior to release to market (1 = Highest probability of detection, 10 = Lowest probability of detection)
The three scores are multiplied together into a Risk Priority Number (RPN), which is used to evaluate the overall risk of a customer problem. The failure mode with the highest RPN is the highest priority for improvement.
The FMEA includes review of the following:
- Steps in the process
- Failure modes (What could go wrong?)
- Failure causes (Why would the failure happen?)
- Failure effects (What would be the consequences of each failure?)
Improvement teams can use FMEA to evaluate designs and processes for possible failures and to prevent them by correcting the processes proactively rather than reacting to adverse events after failures have occurred. This emphasis on prevention may reduce risk of failure and of potential hazards. FMEA is useful for evaluating a new process prior to implementation as well as in assessing the impact of a proposed change to an existing process.
How to use this tool in EngineRoom
1. Find and click the FMEA template from Improve in the DMAIC menu, or from Quality Tools in the Standard Menu
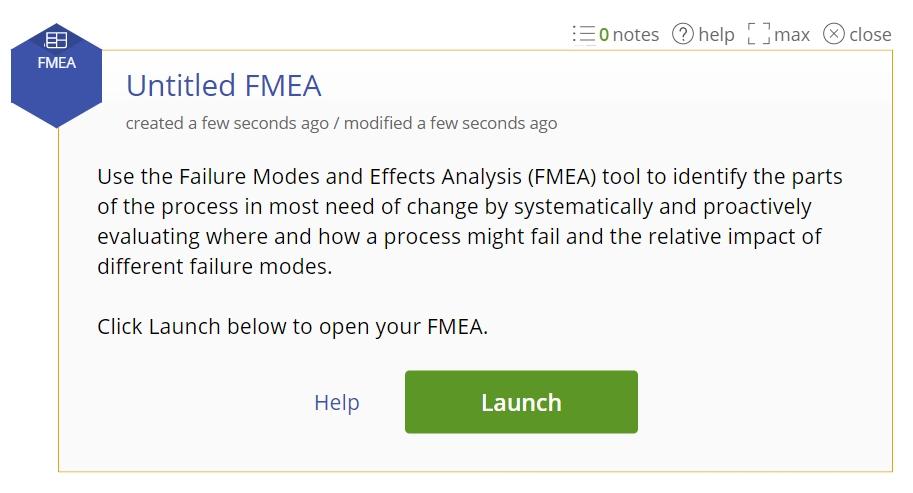
2. Click the Launch button on the study window to access the template.
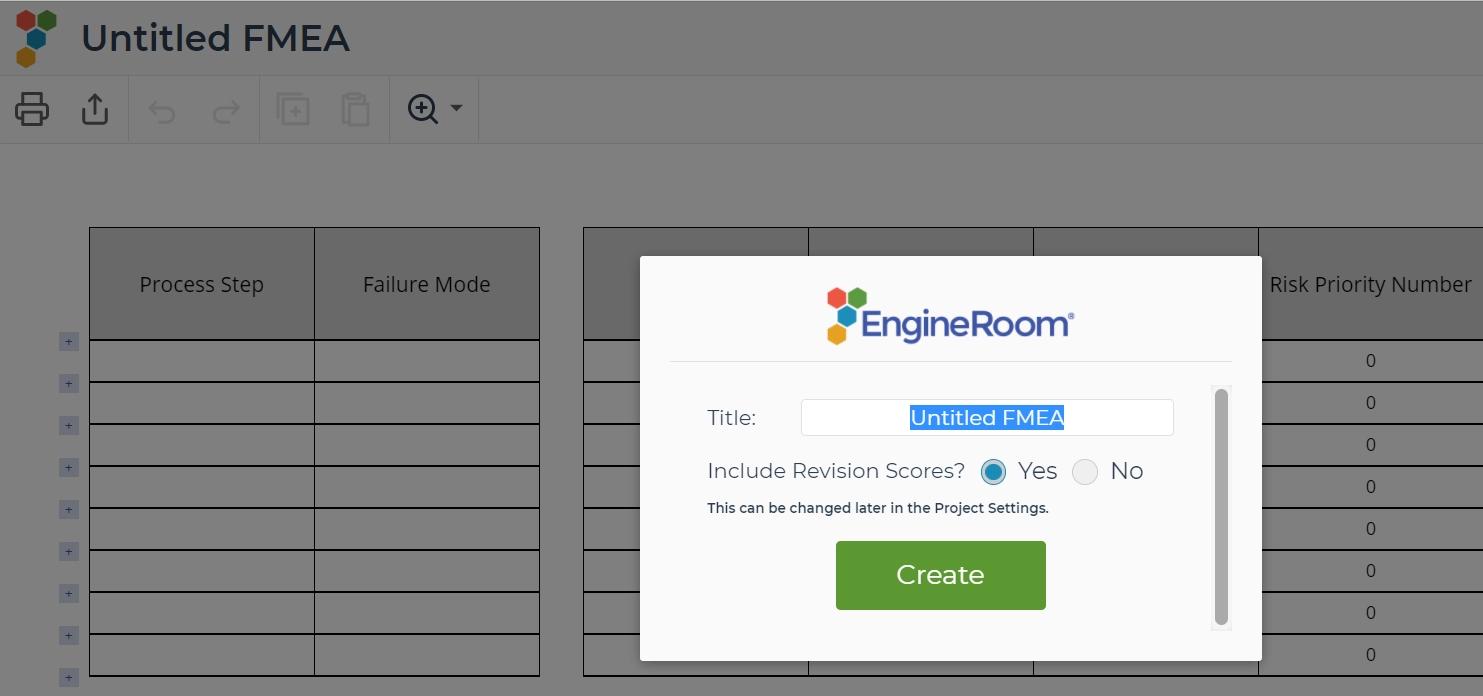
3. Rename your study and select whether or not to include a column for scores after revisions are made in the template, then click the Create button. This can always be adjusted from the settings menu later.
4. Enter the process steps and failure modes in the left two columns.
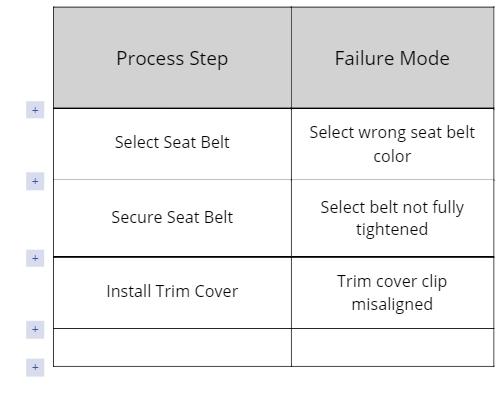
- Click and drag on an edge of the row or column to resize it.
5. Assign a value on a 1-10 scale for the Severity, Probability of Occurrence, and Probability of Detection columns, for each of the potential failure modes:
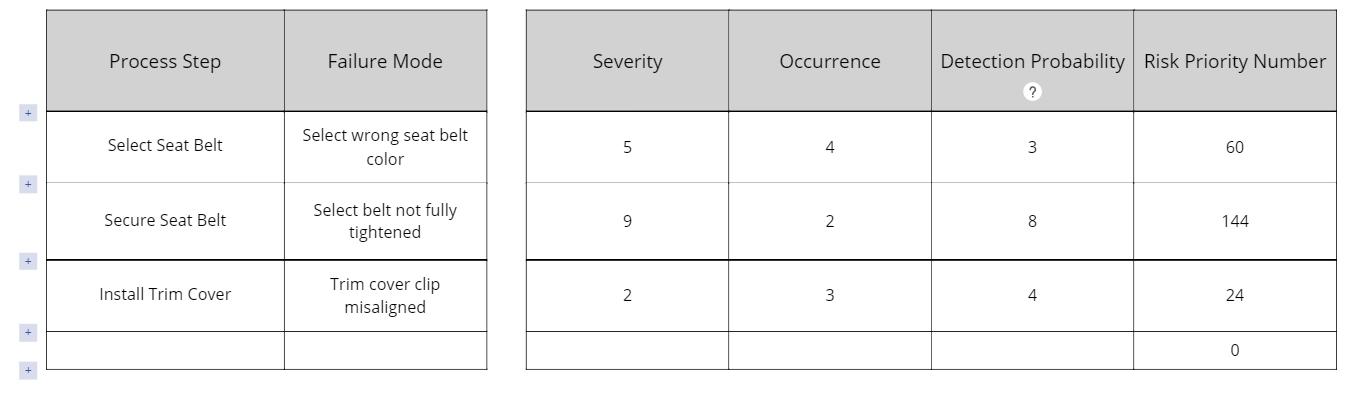
The three scores assigned to each failure mode are multiplied together to get a combined score called a Risk Priority Number. The highest RPN indicates the highest priority for improvement.
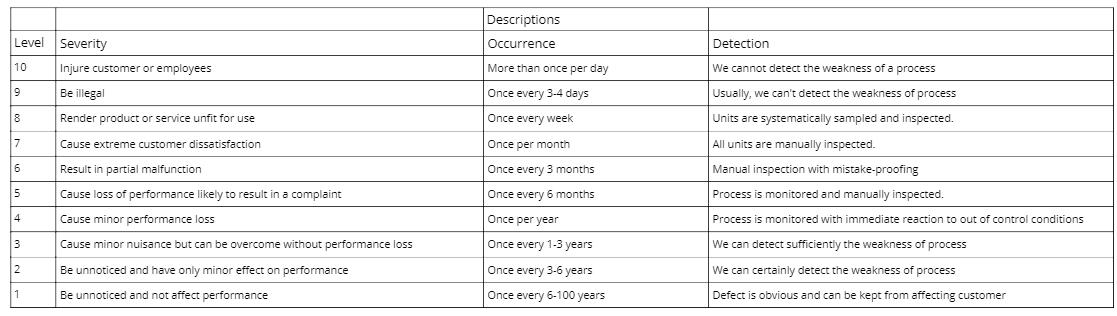
6. There is a reference table below the template listing suggested descriptions of the scores on each of the scales. You can edit these as relevant to your situation:
7. If you choose to include the revised RPN scores in the right side of the matrix, you can use these this columns to store the new RPNs achieved after implementing the actions to improve the process failure mode.
The FMEA output is shown below:

Was this helpful?