
Transformations
When to use this tool
Transformations are mathematical functions that help change the shape or scale of the data to which they're applied. Many parametric tests assume the data are taken from a normal distribution. If your data don't meet this requirement, one option is to transform the data so they more closely approximate the normal distribution. Now that they meet the test requirement, you can run it.
Note: For a given data set, some transform functions may help meet the requirements and others may not. In some instances, none will. Look at your data after each transform function to see whether the goal of the transformation - to make the data more “normal” - was achieved.
How to use this tool in EngineRoom
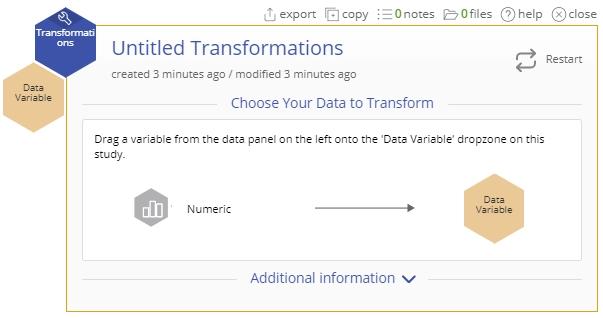
To transform your data, select the Data Mgt menu > Transformations. The study opens on the workspace (Guided Mode enabled):
Example:
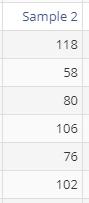
The data set provided in the Anderson Darling Normality Test article contained one non-normal variable (Sample 2). We will apply a transform to that sample so it approximates a normal distribution.
Steps:
- Open the Transformations tool onto the workspace.
- Click on the data file in the data sources panel and drag Sample 2 onto the Data Variable drop zone.
- You now have several options for the choice of transform function:
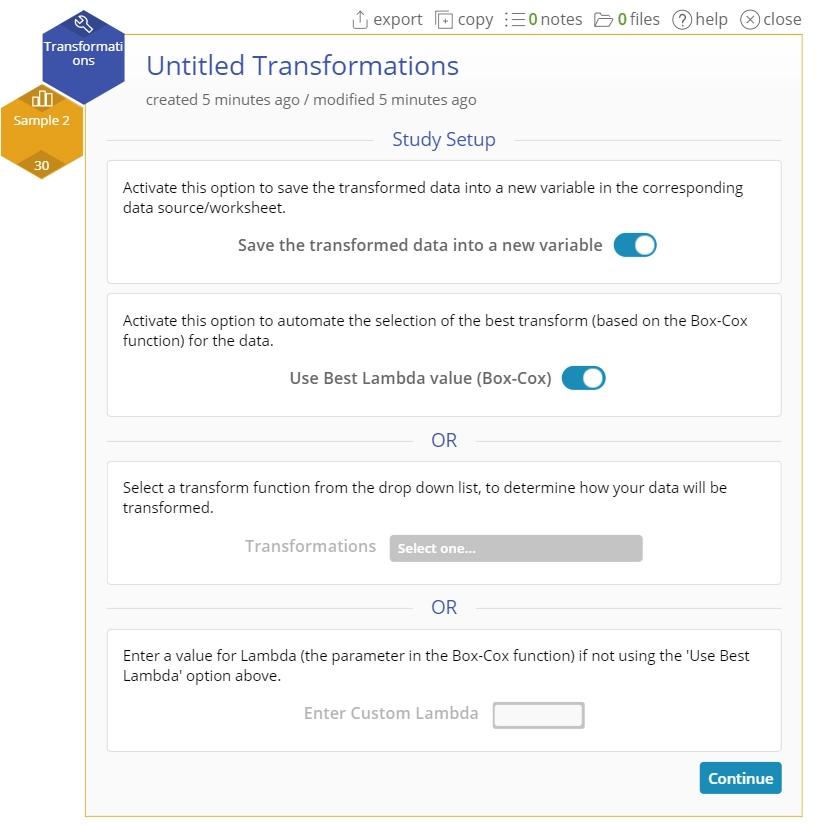
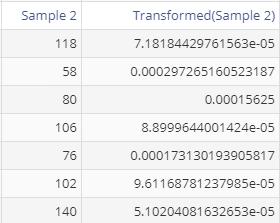
a. The option to Save the transformed data in a new variable in the data source is ON by default. This will create a new data variable column in your data source with the transformed values once the transformation is applied to the original data, allowing you to see the transformed data.
b. Next, you will want to select the function used to transform the data. You have three options here:
- You can use the Box-Cox method to find the best transform function. The Use Best Lambda value (Box-Cox) option is ON by default; this method finds the optimal lambda (power transformation parameter) value that, when applied to your data, will best approximate the normal distribution.
- Alternatively, you can select a desired transform function from the dropdown list provided. To do this, turn OFF the Box-Cox option and instead select the desired function from the drop-down menu provided:
- Arcsine
- Arcsine Square-Root
- Inverse
- Inverse Square-Root
- Logarithm
- Natural Logarithm
- Square
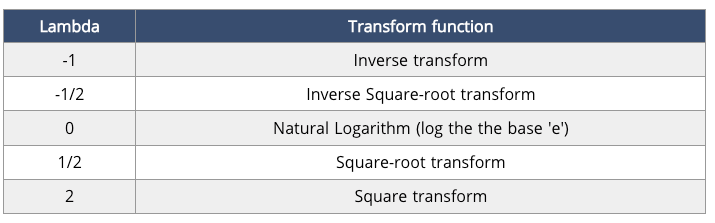
- Square-Root Note: The functions listed in the dropdown menu are specific instances of a Box-Cox transformation, achieved by assigning a lambda value for each function:
- Or, you also can enter a specific Lambda value to create your own transformed data. EngineRoom will transform the original variable (Y) using the transform function (Y^Lambda).
For this example, we will use the Box-Cox default selection on to get the optimal transformation for the data. Click “Continue.”
The study output includes, for both the original and transformed variable: (1) a histogram with a normal distribution overlaid on the data, (2) a normal probability (QQ) plot, and (3) a table of descriptive statistics along with the AD test statistic and p-value. It also displays the estimated lambda value and a more easily interpreted rounded value that is used to transform the data.
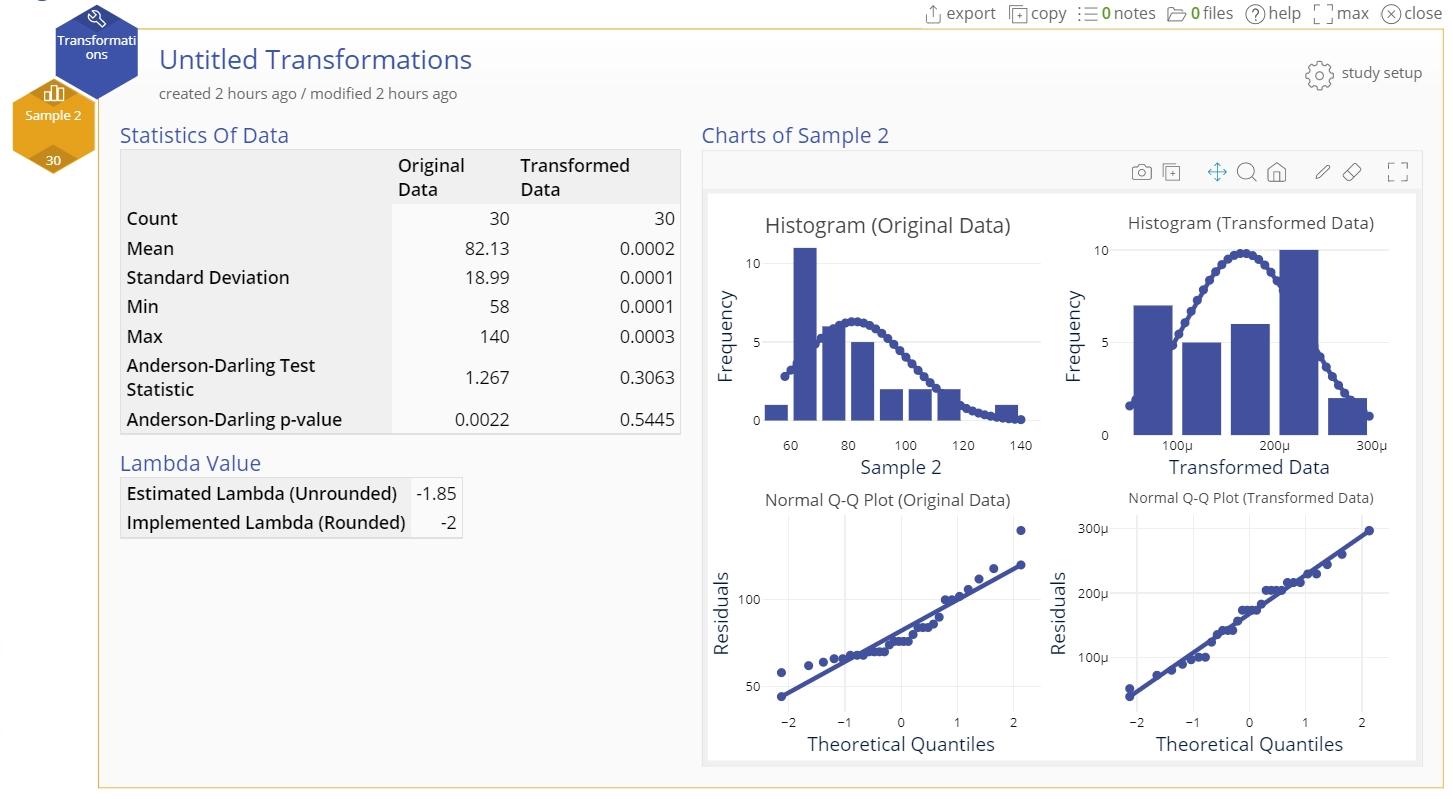
In this example, the inverse square of the data was found to be the best transform. The transformed variable is stored in the original data source file so you can use it in further analysis:
Transformations Video Tutorial
Instructor Resources
Was this helpful?