
Cause and Effect Matrix Tutorial
Video Tutorial
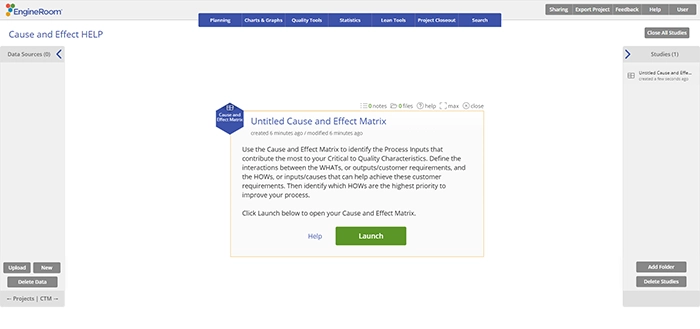
When to use this tool
Use the Cause & Effect Matrix to define the interactions between the WHATs, or outputs/customer requirements, identified from the CTQC Tree diagram, and the HOWs or inputs/causes that can help achieve the WHATs.
How to use this tool in EngineRoom
1. Find and click the Cause and Effect Matrix from Measure or Analyze in the DMAIC menu, or under Quality Tools in the Standard Menu.
2. Click "Launch" on the study window to access the Template.
3. Rename your study.
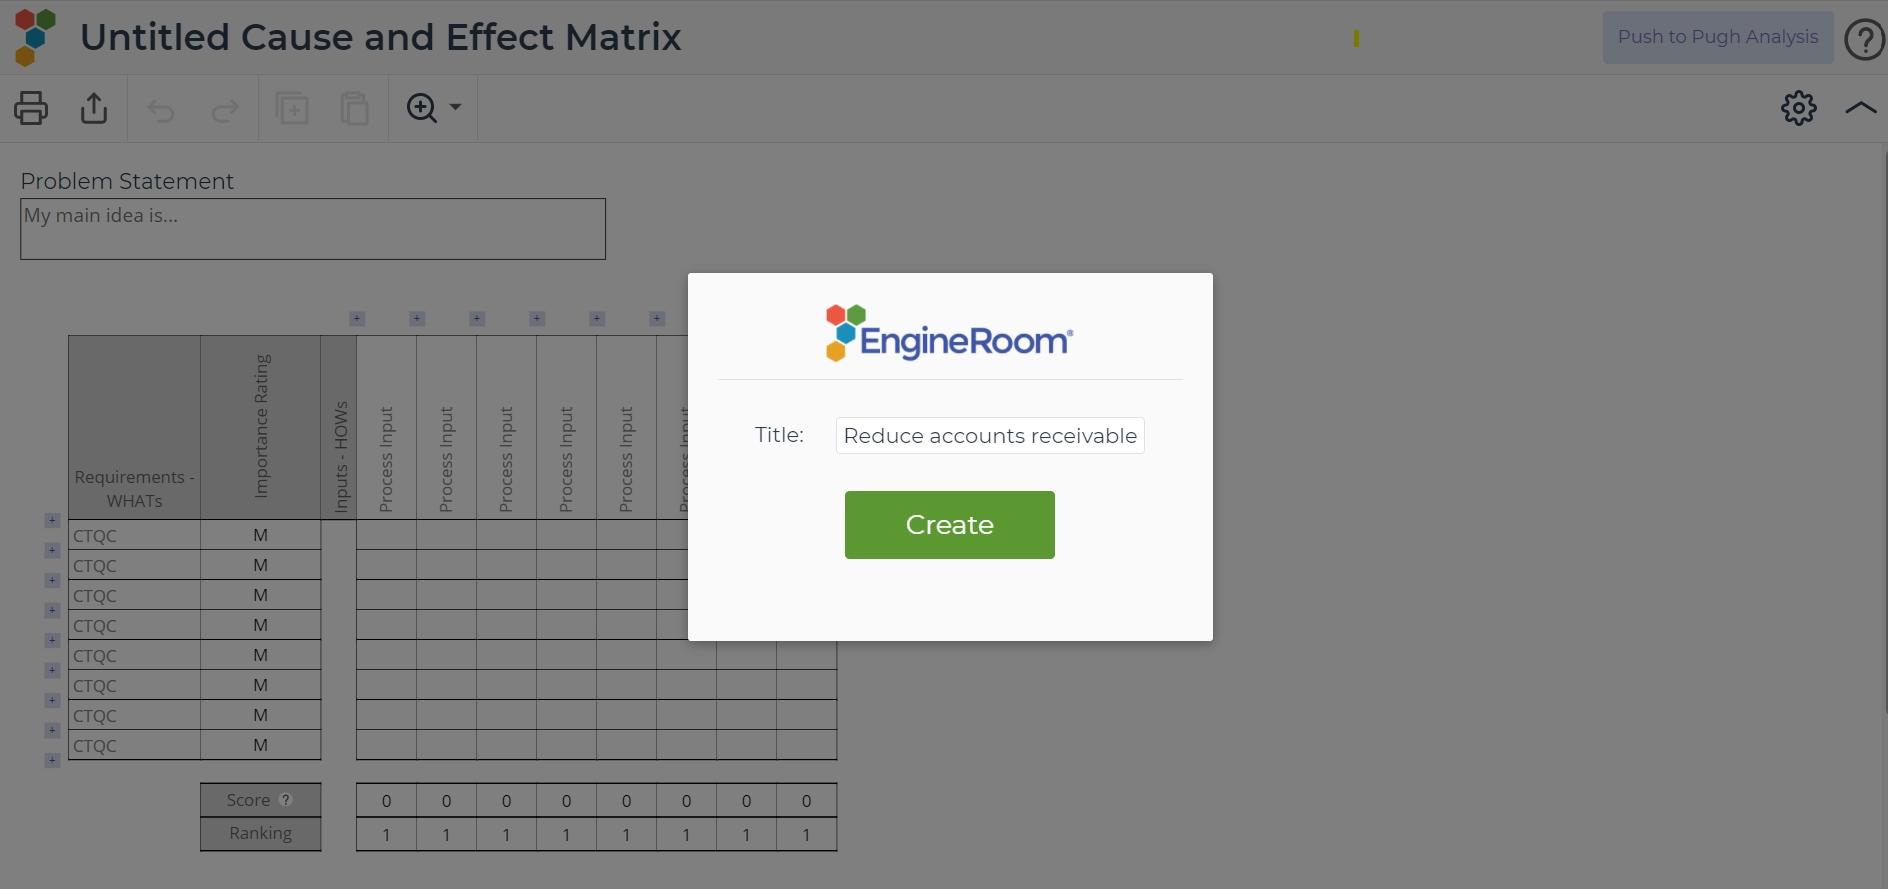
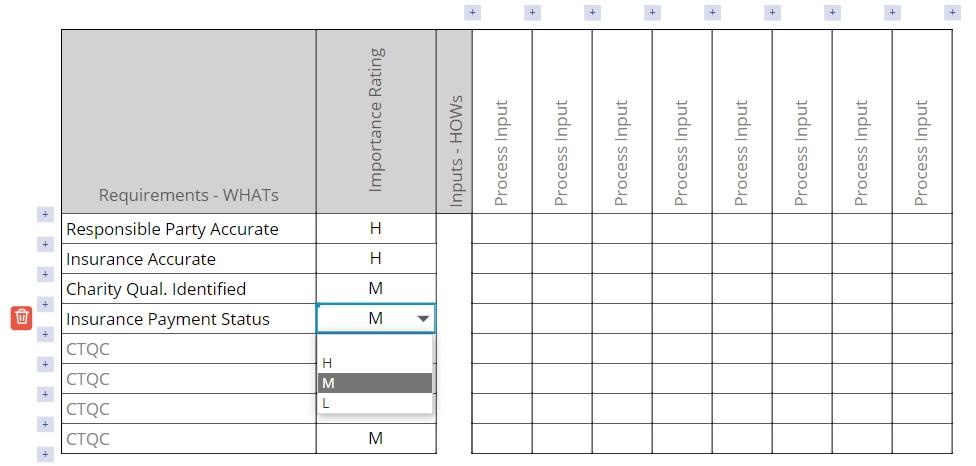
4. Modify or add CTQCs (the Whats) in the left column.
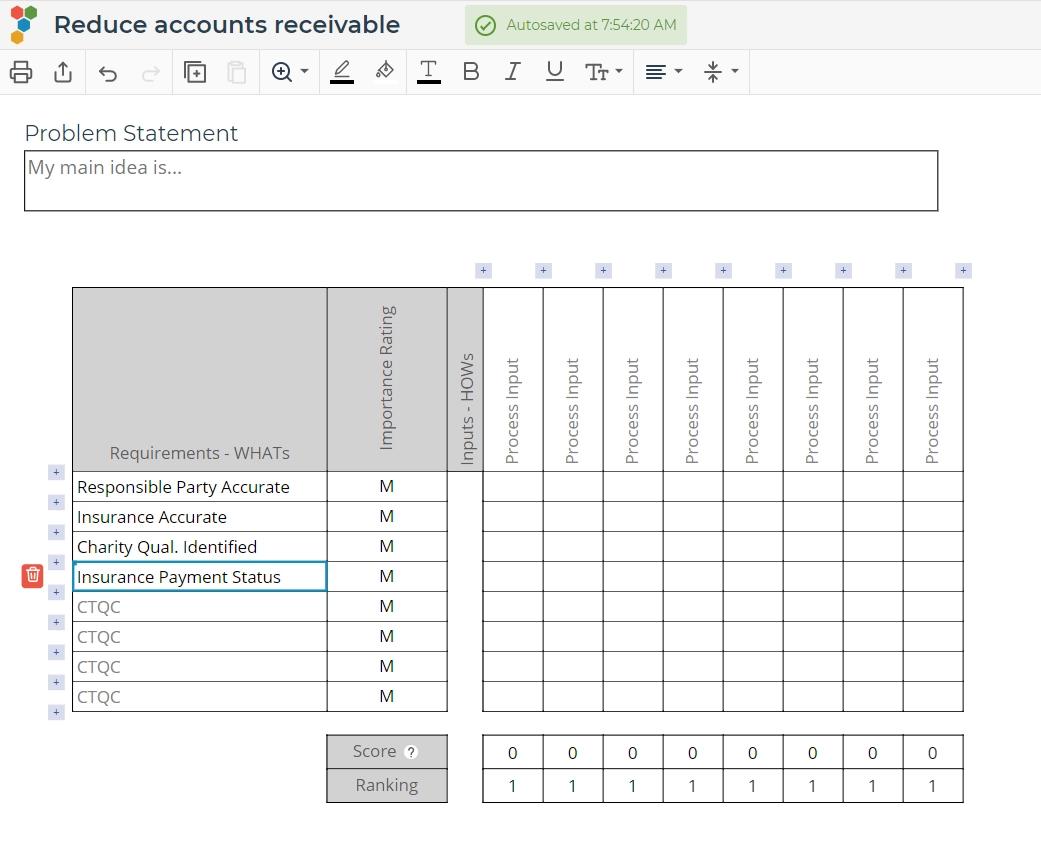
- Click on an edge to resize a column or a row.
- Double click on an edge to automatically resize the row above it.
- Delete a row by clicking on the cell and then pressing the delete button on the left side.
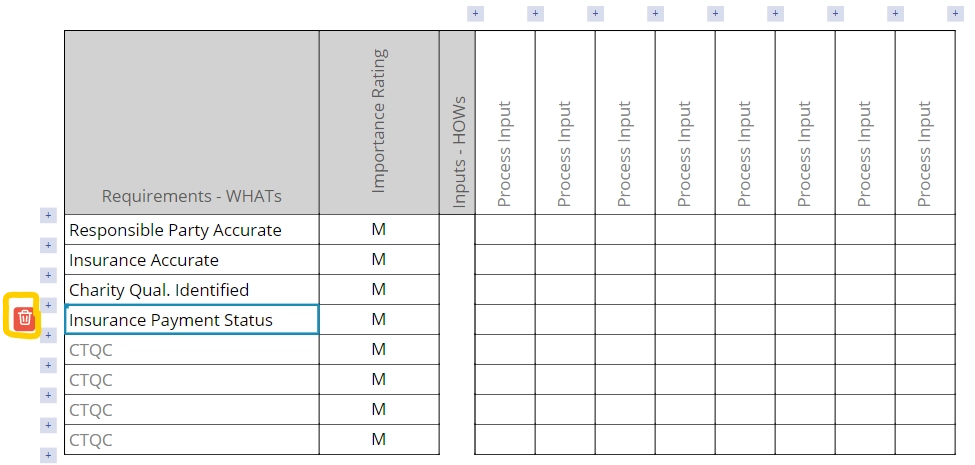
5. Assign a Customer Importance Rating (H,M,L,none) to each row.
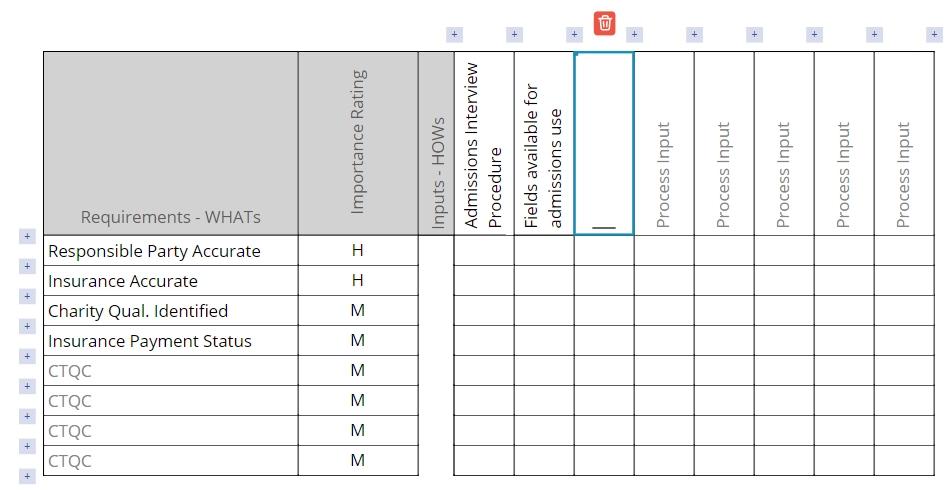
6. Identify key Process Inputs (the Hows) in the top row.
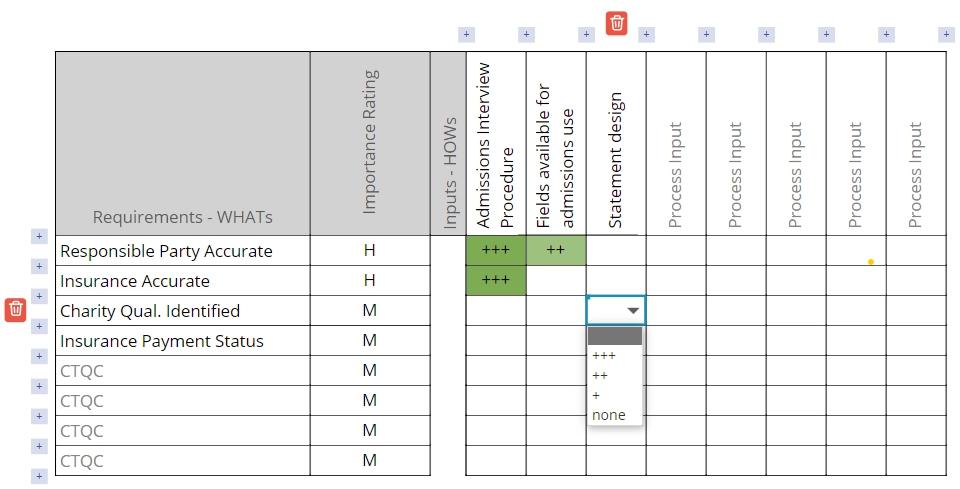
7. Assign correlation factors in the matrix between the CTQCs and the Process Inputs
- +++ = high correlation
- ++ = medium correlation
- + = low correlation
- none = no correlation
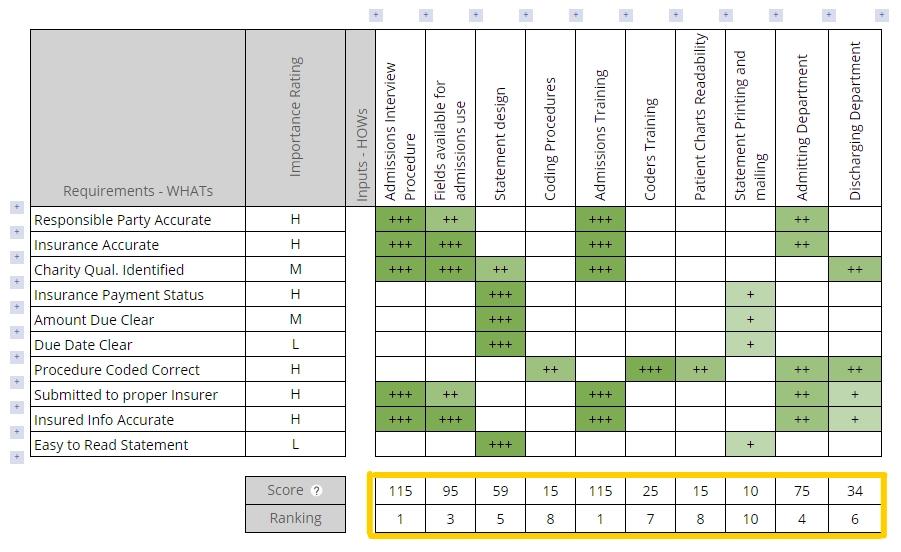
The importance scores and rankings will be displayed at the bottom of the grid to rank the most important process inputs for your project.
Calculation
The Customer Importance Ratings are valued as follows:
- H = 5
- M = 3
- L = 1
- none = 0
The Correlation Factors are ranked as follows:
- +++ = 5
- ++ = 3
- + = 1
The Process Input receives an Imporance Score which equals the sum down the column of (Customer Importance Rating x Correlation Factor). The Ranking indicates the order of the Importance Scores for easy reference.
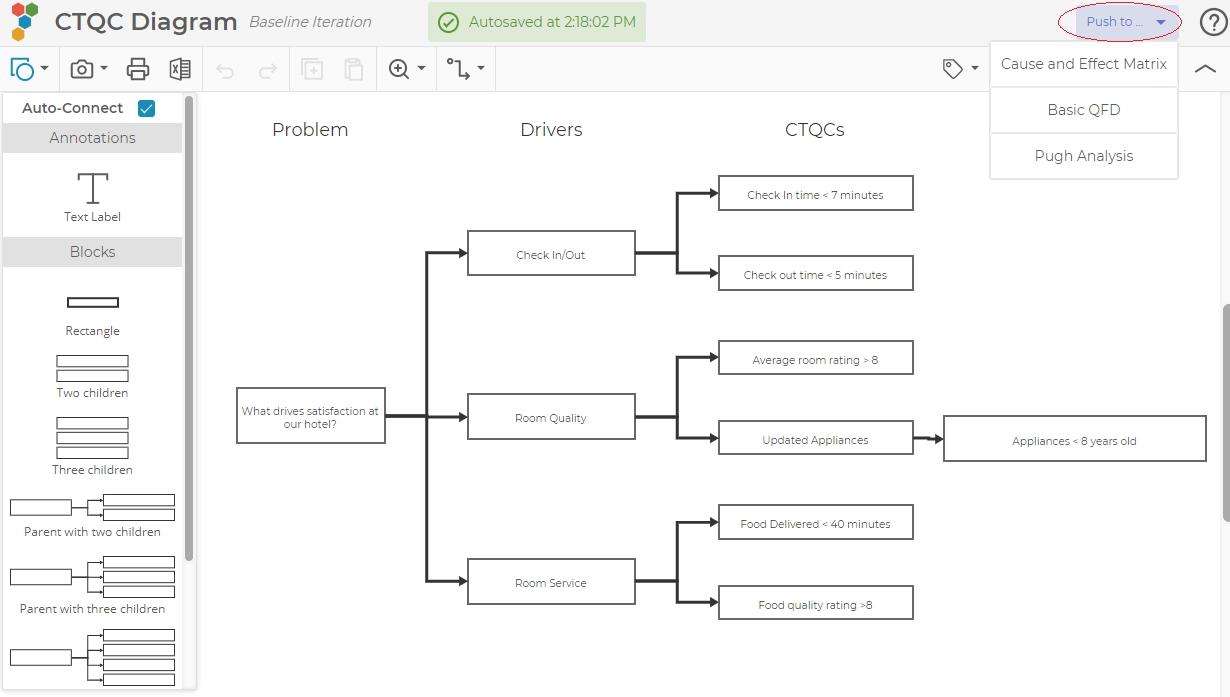
Preceding Tool: CTQC Diagram
You can also develop a Cause & Effect Matrix based on the CTQCs from a CTQC Tree diagram.
After building a CTQC Tree, "leaves" at the third level and farther to the right will all be included in the CTQCs of the Cause and Effect Matrix.
Was this helpful?