
Gauge R&R Tutorial
When to use this tool
Measurement systems analysis (MSA) helps you assess whether the measurement system being used in a given application meets your criteria for accuracy and reliability. Gauge R&R (also called Gage R&R) is one of the tools within MSA, used to evaluate your measurement system when you have continuous or variable data.
Use the Gauge R&R tool to quantify measurement error and ensure that it is at an acceptable level before conducting analysis on data and making business decisions based on it. Gauge R&R differentiates the measurement variation due to different sources: the parts or process units, the appraisers/operators doing the measuring, and the variation in repeated measurements taken using the same gauge.
EngineRoom recommends the Components of Variation approach to gauge R&R analysis using the ANOVA technique.
Using EngineRoom
Note: the chart demonstration below has the Guided Mode disabled, so it combines some steps in one dialog box. You can enable or disable Guided Mode from the User menu on the top right of the EngineRoom workspace.
To use the tool, in the DMAIC menu select Measure > Measurement System Analysis (MSA)... > Gauge R&R (In the Standard menu, select the tool under Quality Tools). The study opens on the workspace:
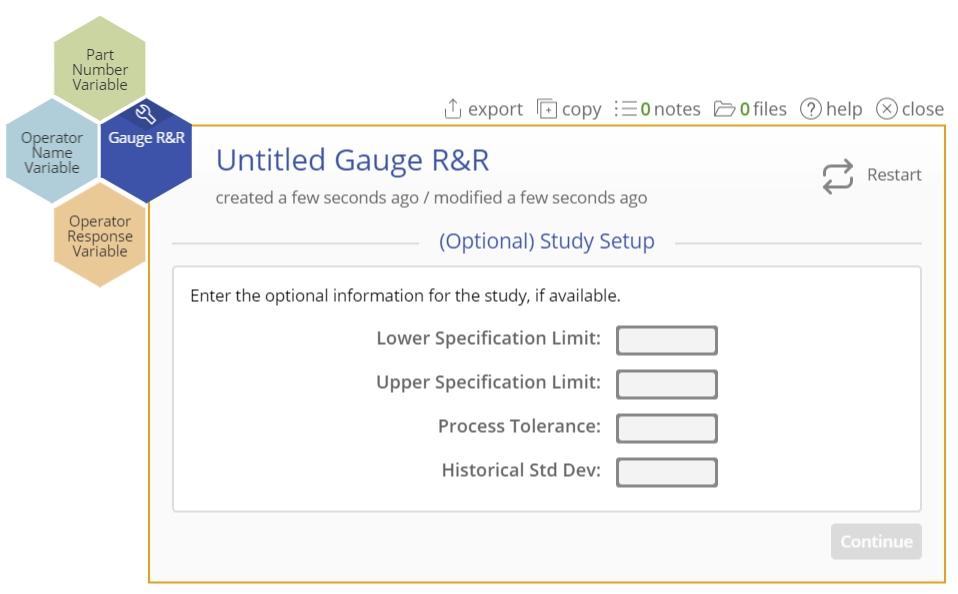
There are three hexagons or 'drop zones' attached to the study:
- Part Number Variable (required): used for the variable containing the part numbers. Can be numeric or text.
- Appraiser Name Variable (required): used for the variable identifying the operator names. Can be numeric or text.
- Measurement Variable (required): used for the variable containing the measurement data from the study. Must be numeric.
Example:
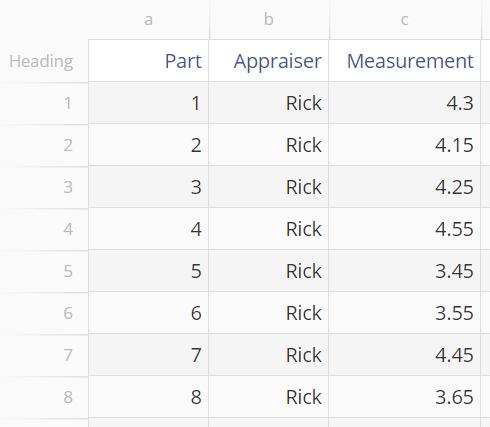
Upload the data set by clicking the Upload button and navigating to the location of the file on your machine. The data set contains measurement data of 10 samples (parts) taken by each of three appraisers over three trials. A tolerance of +/- 0.6 is associated with the samples.
Open the data source to see three column of data: Part (containing the part numbers), Appraiser (containing the names of the three appraisers) and Measurement (containing the measurement data gathered by the three appraisers). Each part number is repeated three times for each appraiser, representing the three trials.
Steps:
1. Go to Measure > Measurement System Analysis (MSA) in the DMAIC menu (or Quality Tools in the Standard menu) and open the Gauge R&R tool onto the workspace.
2. Navigate to the data source and drag Measurement onto the Measurement Variable hexagon.
3. Drag Appraiser onto the Appraiser Name Variable hexagon.
4. Click on the data source and drag Part onto the Part Number Variable hexagon.
5. Customize the study options to your requirements (all are optional):
- Enter a lower specification limit and/or
- Enter an upper specification limit
- OR instead enter the tolerance range (upper minus lower specification). For this example enter the tolerance range as 1.2 (obtained from +/-0.6)
- Enter a historical standard deviation
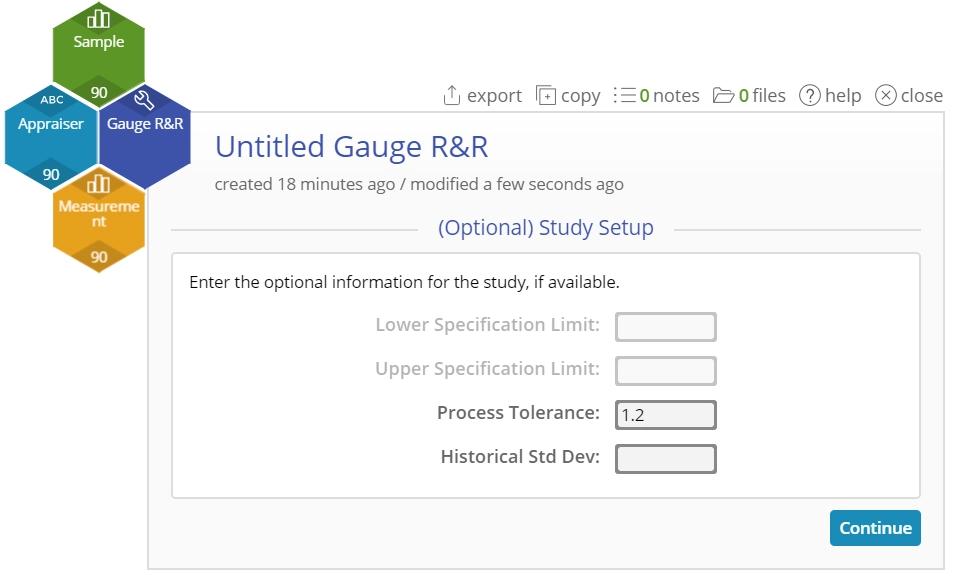
6. Click Continue.
Results:
The Gauge R&R output includes graphical and numeric output:
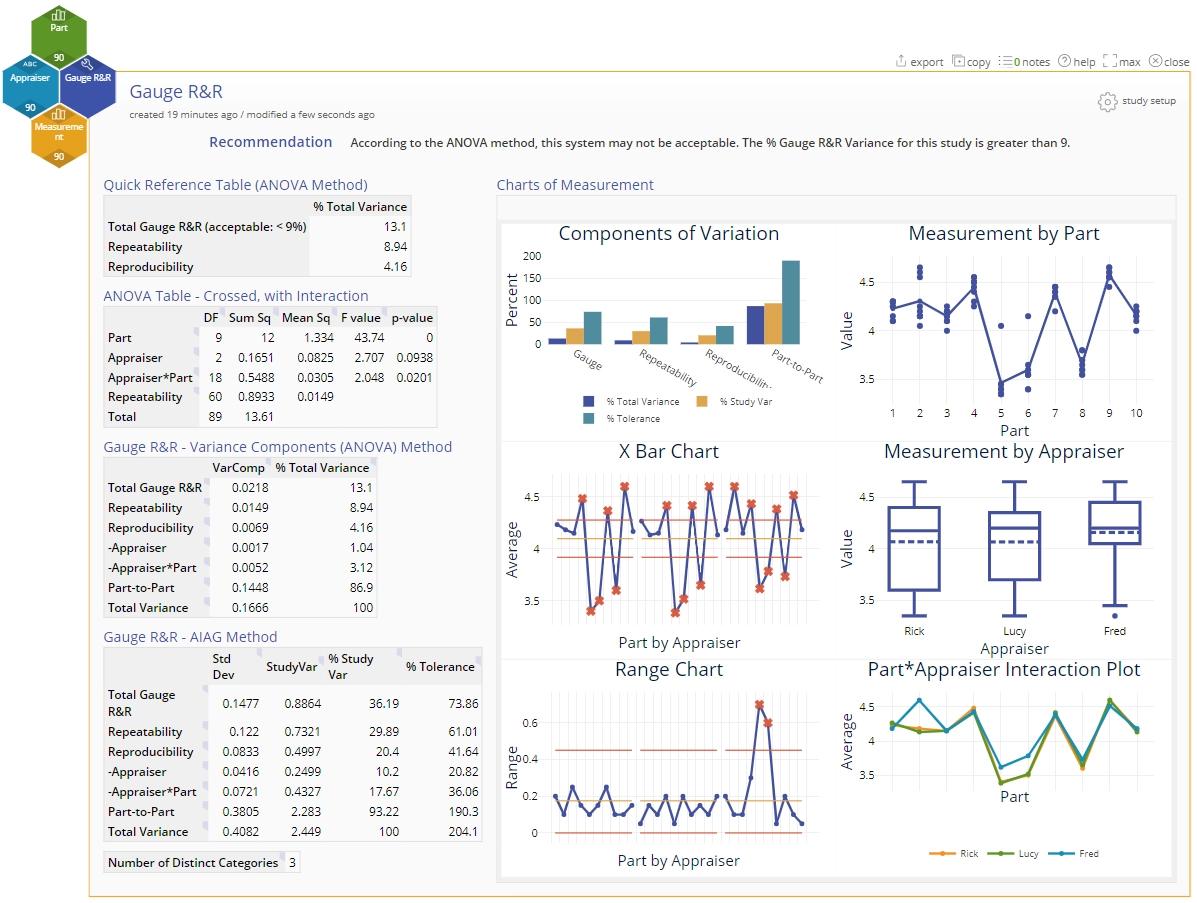
1. The recommendation at the top summarizes the key findings of the analysis which are displayed in the Quick Reference Table.
2. The graphical output contains:
- Components of Variation bar chart
- Xbar Chart (you want to see at least 50% of the points falling outside the control limits on this chart)
- Range Chart (you want to see points falling within the control limits on this chart)
- Data by Parts chart
- Data by Appraisers chart
- Parts by Appraisers Interaction Chart
3. The numeric output contains:
- The ANOVA Table - Crossed, with Interaction.Note: If the interaction is not significant, a second ANOVA table is displayed without the interaction term, in which the interaction term is merged into the repeatability or error term.
- The Gauge R&R table which contains the components of variance output, including %Total and %Study variance.
Note:
- The % Tolerance column is displayed only if you entered at least one specification limit value or a tolerance value in the stuy setup dialog.
- Entering an historical standard deviation value in the setup creates an additional column in the Gauge R&R table called % Process.
Instructor Resources
Was this helpful?