
Distribution Identification Tutorial
Tutorial
Coming Soon
When to use this tool
Use the Distribution Identification tool to identify the form of the distribution of your process data. When you run this tool, EngineRoom checks the goodness of fit of the normal and several non-normal distributions on your raw data, and selects the closest fitting distribution based on the goodness-of-fit test p-value.
Some analytical tools make the assumption that the data were sampled from a normally distributed population, which means you have to test the data for normality before you can use the tool. There are alternative methods available to analyze data from non-normal populations, so long as you know which distribution the data belong to. The Distribution Identification tool tests your data against various non-normal distributions to ascertain the most appropriate (best fitting) distribution.
The distributions used for comparison are:
- Normal
- Lognormal
- Exponential
- Weibull
- Gamma
- Logistic
How to use this tool in EngineRoom
To see how the tool works, upload the example data set provided above to EngineRoom to identify the distribution of the data. Then follow these steps:
- Go to the Measure (DMAIC) menu and click on Distribution Identification to open it onto the workspace.
- Drag the numeric variable Sample Data on to the Data Variable hexagon dropzone. The output is automatically generated.
The Output
The output includes:
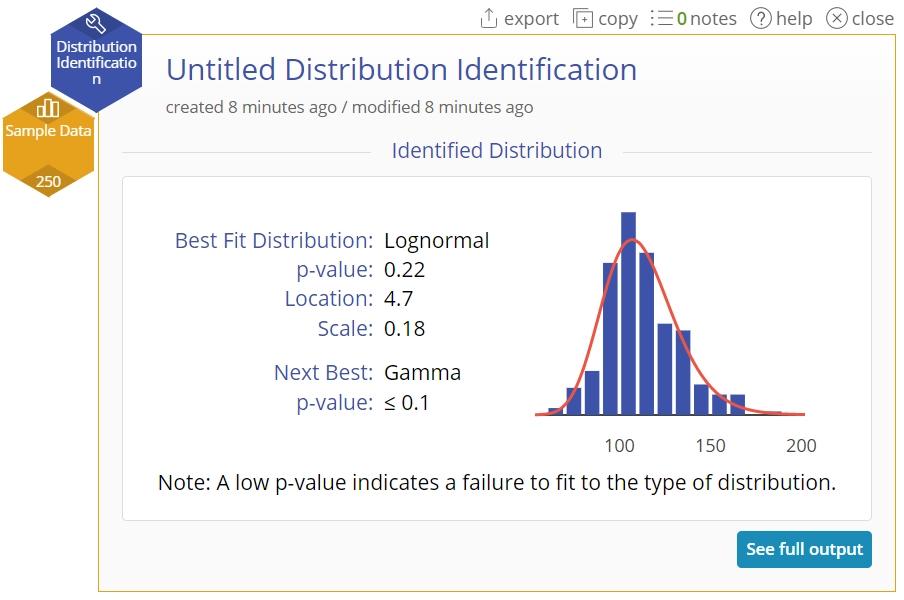
- A summary view showing the best fit distribution name, the corresponding goodness-of-fit test p-value and the estimated parameters of the best-fit distribution (using the maximum likelihood method), along with the next-best fit distribution and its p-value. A histogram alongside the numeric output shows the shape of the sample data distribution with the ‘best fit’ distribution curve overlaid on the histogram.
Clicking on the ‘See full output’ button opens the detailed output:
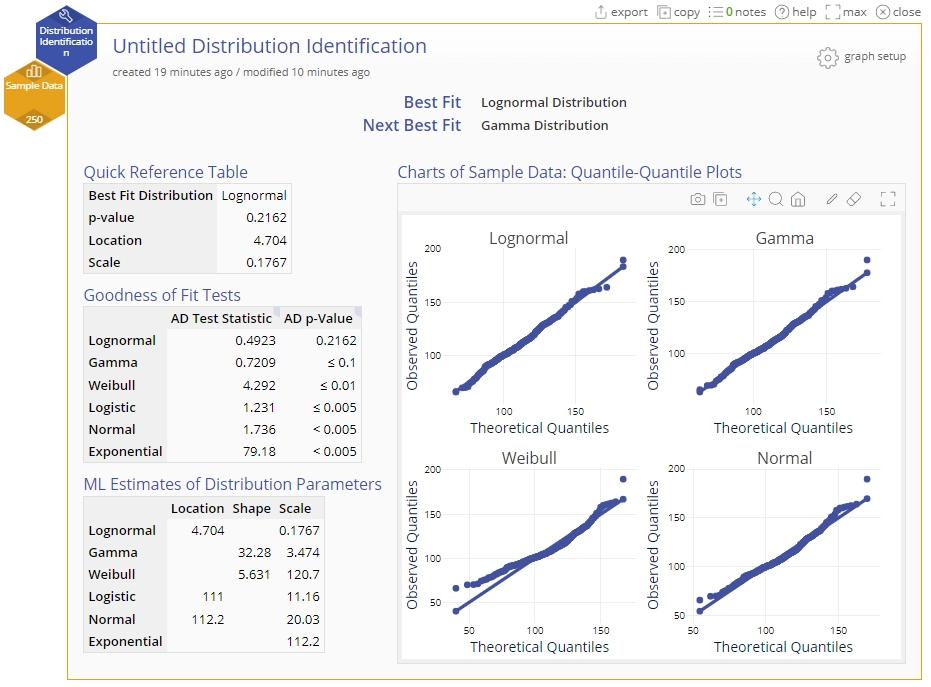
- The names of the best fit and the next-best fit distributions are shown at the top.
- On the left, the Quick Reference Table shows the Best fit distribution name along with its goodness-of-fit p-value and estimated parameters.
- The Goodness of Fit Tests table lists all the distributions tested along with their test statistics and p-values in descending order. The test used in each case is the Anderson Darling Goodness-of-fit test where the null hypothesis states that the distribution fits the data. A large p-value therefore indicates that the distribution is a good fit.
- The ML Estimates of Distribution Parameters table shows the Maximum Likelihood (a method of estimation) estimates of each distribution’s parameters.
- The charts on the right show Quantile-Quantile (Q-Q) plots of the sample data against each theoretical distribution evaluated.
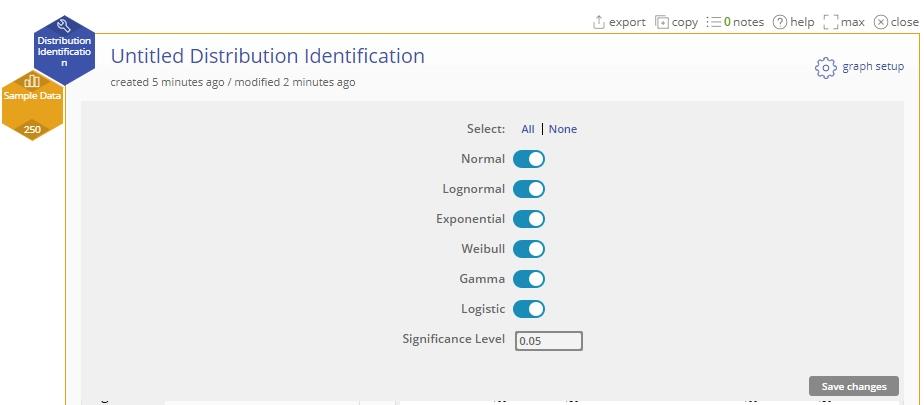
Editing The Output
To edit the output, click on the ‘graph setup’ button at the top right of the study. Here you can select or de-select distributions for testing, and enter a different significance level for the tests:
When No Distribution Fits The Data
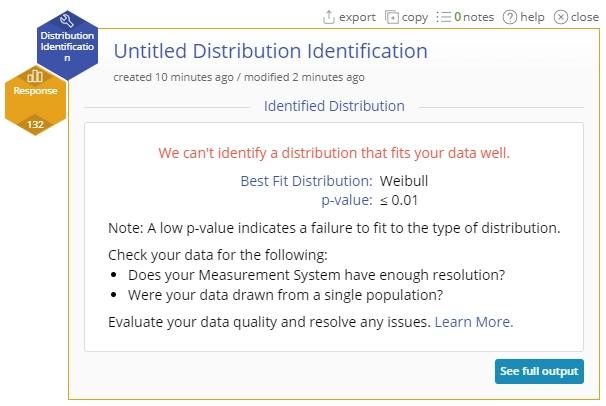
You can generate the output below by opening a new Distribution Identification study and dragging on the numeric variable Response from the data source onto the Data Variable hexagon dropzone.
If none of the distributions in the list fits the data, the summary screen will indicate this at the top of the output with the statement “We can’t identify the distribution that fits your data well.” along with some tips for next steps. The output also includes the distribution with the largest p-value smaller than the selected cut-off.
Once you have identified the best fitting distribution for your data, you can proceed to use the appropriate tool to analyze the data.
Was this helpful?