
Edit a Data Source
To view or edit the contents of your data source:
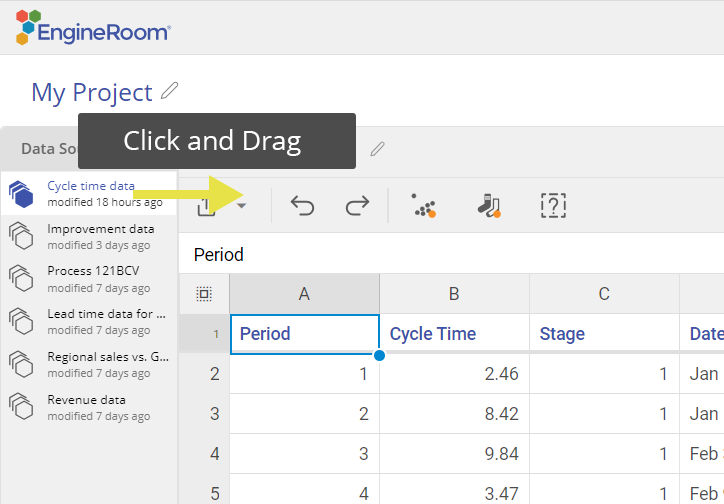
- Drag on your data source to open the Data Editor, OR
- Click on the data source, then click the Edit button.
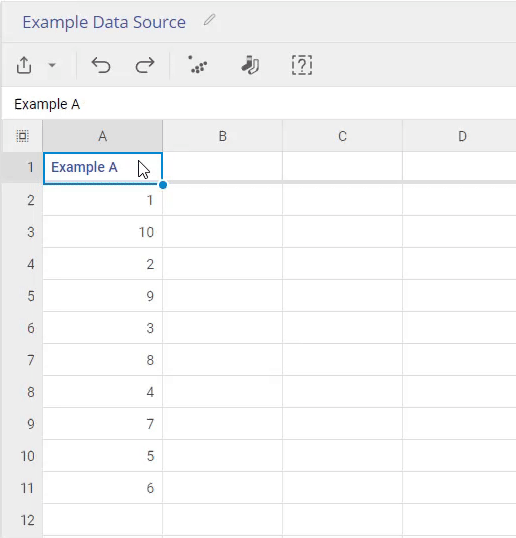
This opens the Data Editor:
To change the contents of a cell, click within a cell and type in the new value, then press the Enter key.
To change the name of a variable, change the cell in the first (header) row.
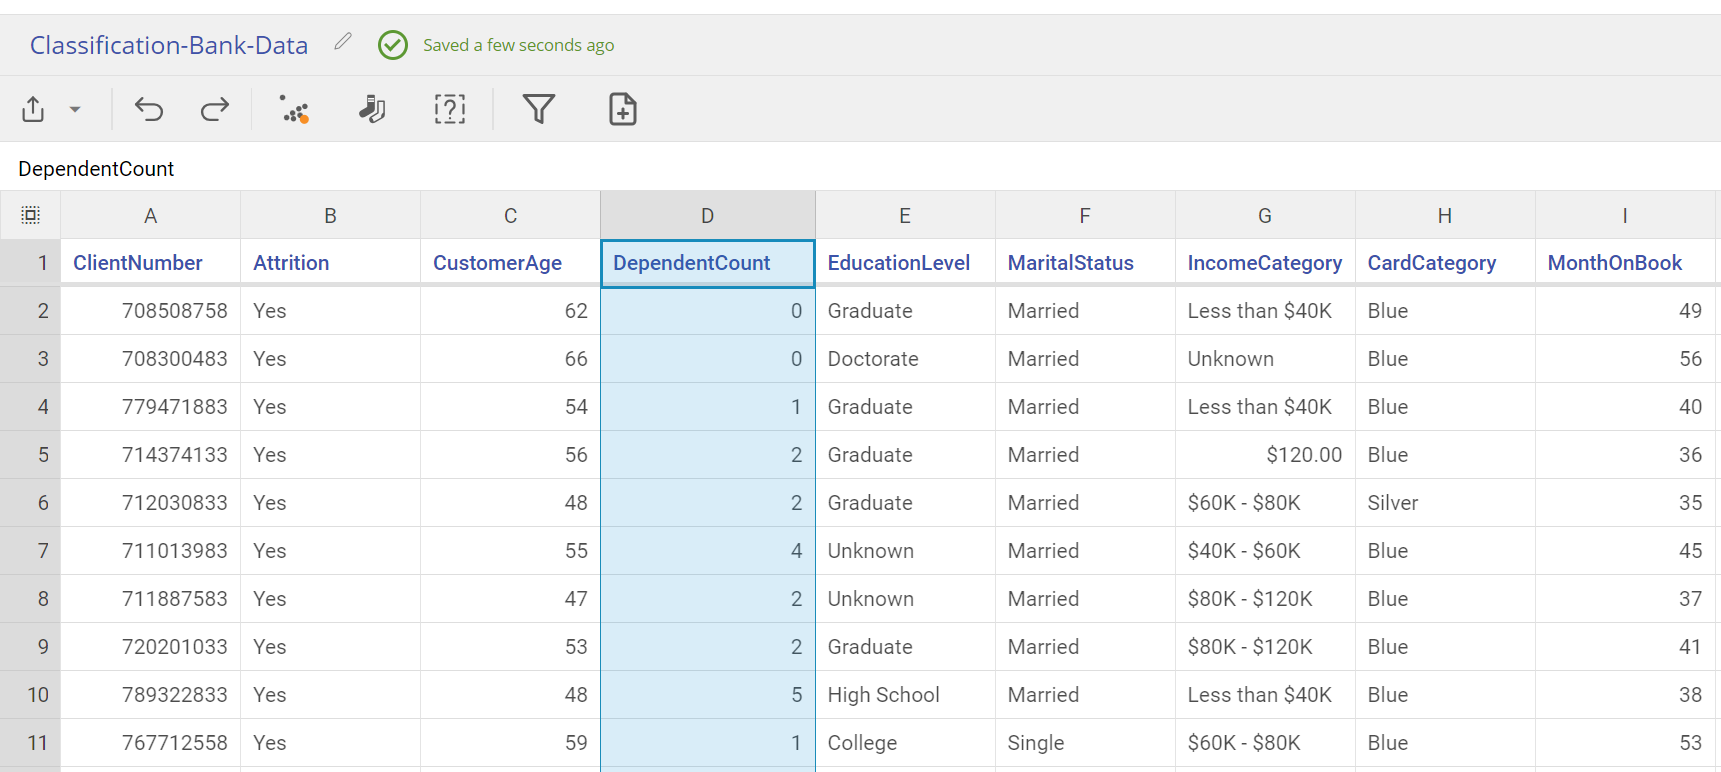
There are three main types of variables handled by EngineRoom:
- Numeric
- Text
- DateTime
There is a fourth minor type that is a DOE Design Matrix that is generated from the DOE tool.
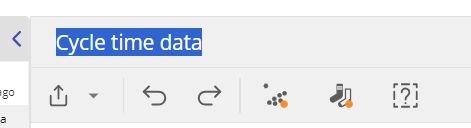
Rename your Data Source
Click on the name at the top of the data editor window and enter the desired name.
Clean Your Data
The three buttons at the top help you check for data issues. Each button will have a small orange alert dot if the data type has been detected.
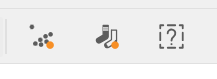
- Check for Outliers: Used on Numeric data. Outliers are calculated the same as our box plot: Anything outside the Median + or - 1.5 x IQR where IQR = 3rd quartile (75th percentile) - 1st quartile (25th percentile)
- Check for Inconsistent Data: Identifies cells of data that don't appear to match the data that is surrounding it. This could be helpful for finding text values that cause errors in numeric data.
- Check for Missing Data: Most tools cannot handle a variable with blank cells/rows. If blank cells are present within the data, this will take you to those cells to enter values.
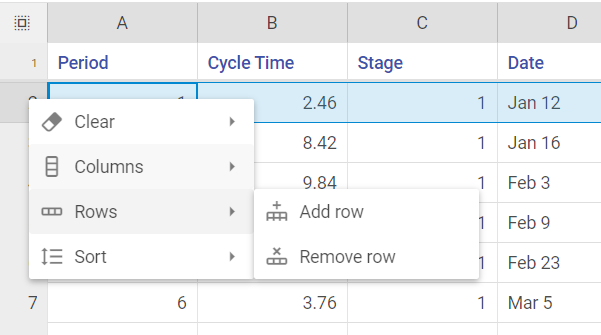
Adding and Deleting Columns
- Right-click on the column heading OR hover over the column heading and click on the 3 dots.
- Navigate to Columns to Add and Delete columns.
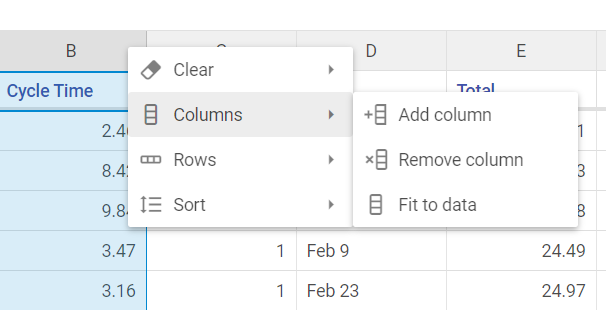
Adding and Deleting Rows
- Right-click on the row heading
- Navigate to Rows to Add and Delete rows.
Sorting
- Right-click on the column heading OR hover over the column heading and click on the 3 dots.
- Navigate to Sort, where you can choose A -> Z or Z -> A.
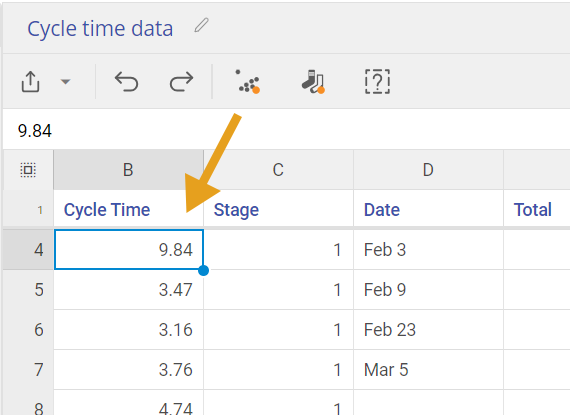
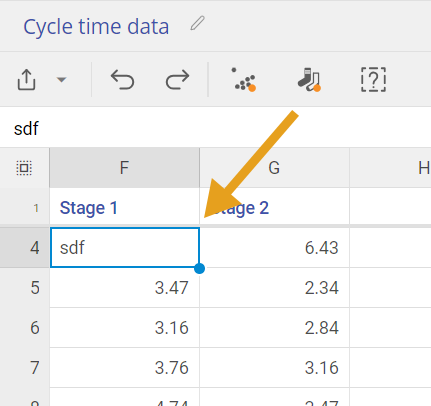
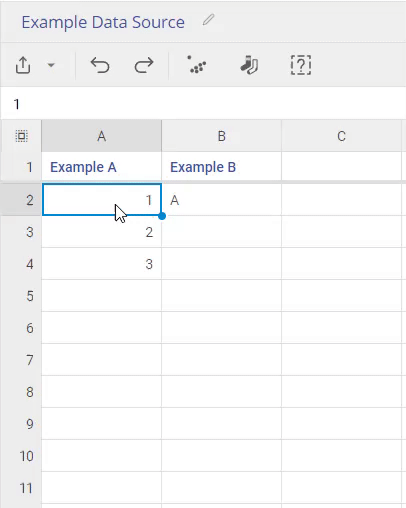
Copy Data Down a Column
- Select the cell or cells you would like to copy.
- Click and drag on the anchor in the bottom-right corner.
- The data will be copied (or shown in sequence) as far as you drag your cursor.
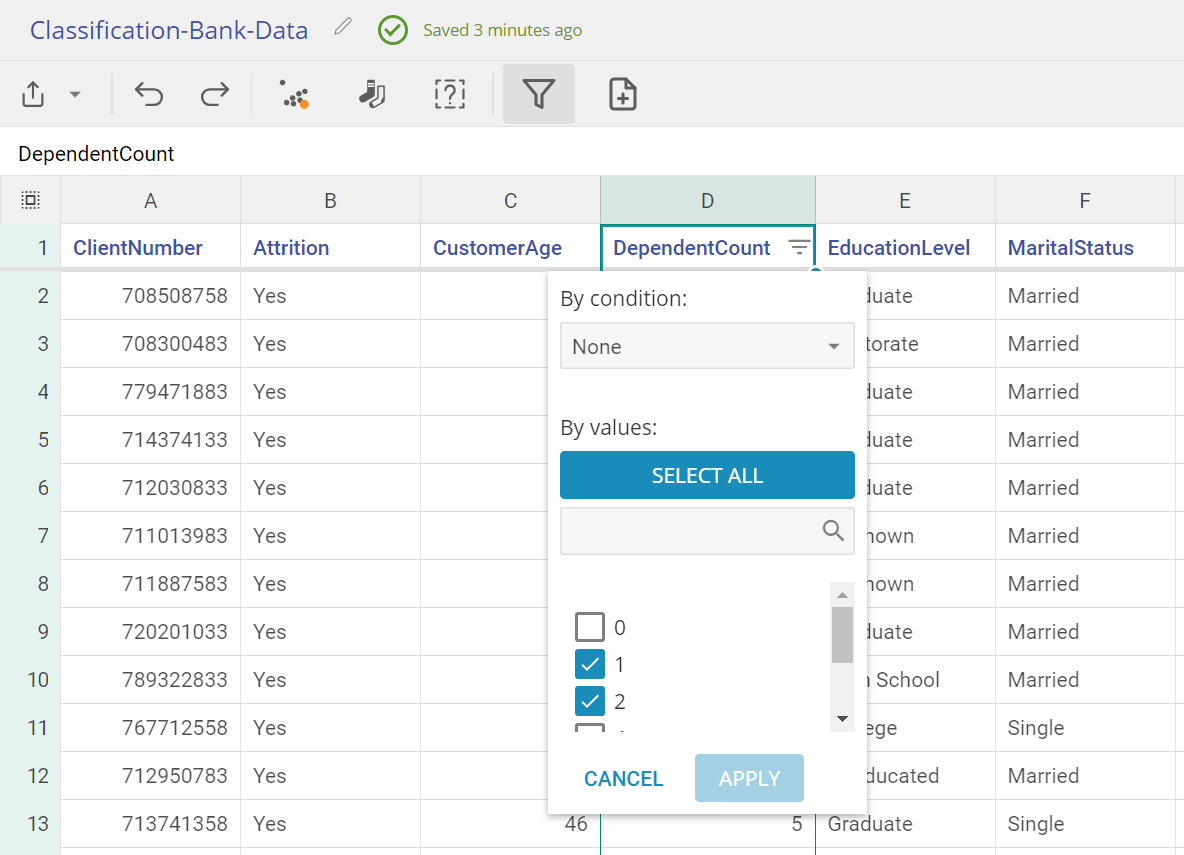
Filter and Subset
Visualize specific parts of your data by filtering and copying a portion of your data.
1. Click on the column header of the column you want to filter by.
2. Click the Filter icon in the toolbar.
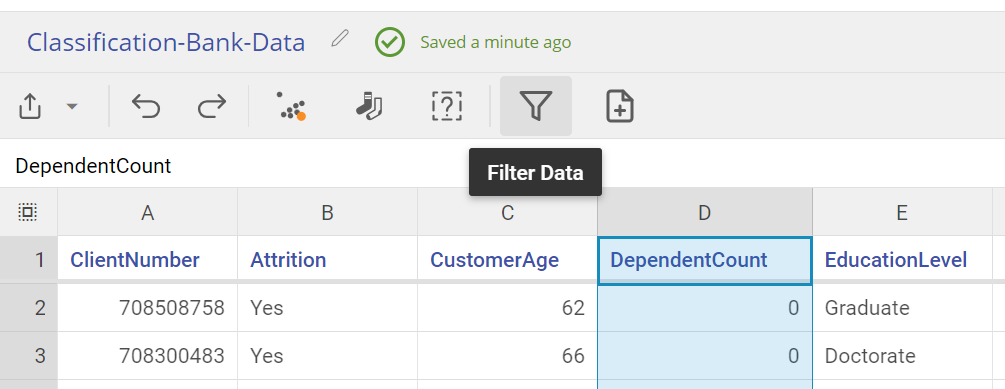
3. Click on the three-bars next on the column to show the filter options.
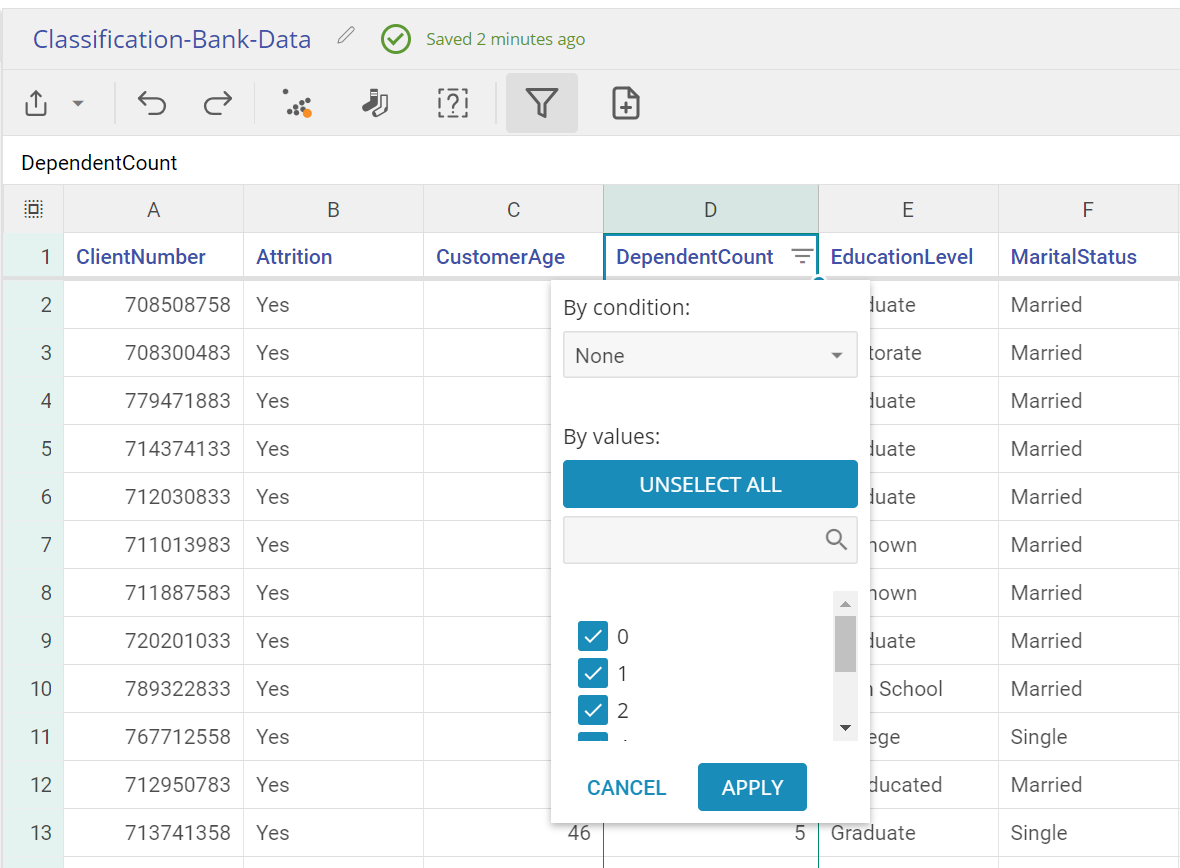
4. Select how you want to filter your data and click Apply.
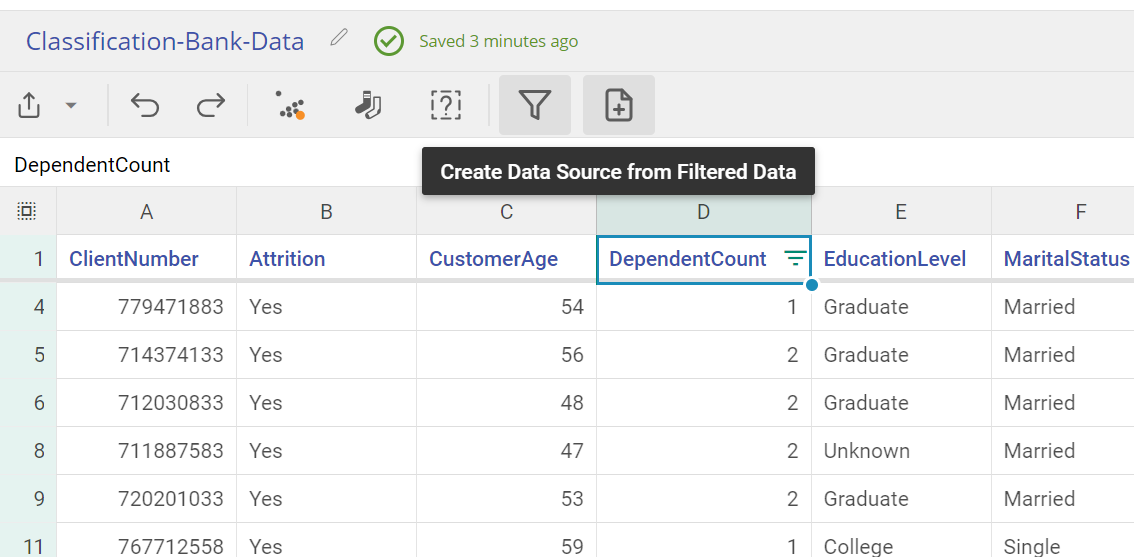
5. Once filtered, you can create a copy of this filtered data source to use in your studies.
Revert Changes
If you want to revert all of the changes you made since you've opened the Data Editor, click the Revert button in the top-right corner.
Was this helpful?