
CTQC Diagram Tutorial
Tutorial
When to use this tool
Use the Critical To Quality Characteristics (CTQC) tool to turn information on general requirements into measurable specifications. It helps translate "Voice of the Customer" (VOC) information into specific Critical to Quality Characteristics, or CTQCs. Starting with a general goal, the Tree Diagram moves from general WHATs to specific HOWs. This is one of the objectives of the Define phase of the DMAIC improvement cycle - translating "Voice of the Customer" (VOC) information that is often communicated only as general (or even vague) wants and needs into specific Critical to Quality Characteristics, or CTQCs (also called CTQs).
The CTQC Tree may build upon data that is organized by an Affinity Diagram in order to develop specific CTQCs. If the process or product is very complex, a further step may be required to develop specifications for the inputs that affect the CTQCs - Quality Function Deployment (QFD). You may use the results of your CTQC tree to initialize a QFD. The Drivers-CTQCs become the WHATs in the first house of the QFD.
How to use this tool in EngineRoom
1. Open the CTQC Tree tool from Define in the DMAIC menu or from Planning in the Standard menu and click on the Launch button (the CTQC Tree will open in a new tab)
2. Enter a title for the study and click Create. If you’re planning on printing, you can update the page size to your paper size
3. Enter the Problem statement, Need, or Main Idea of your CTQC tree on the far left box, by clicking in the box and typing.
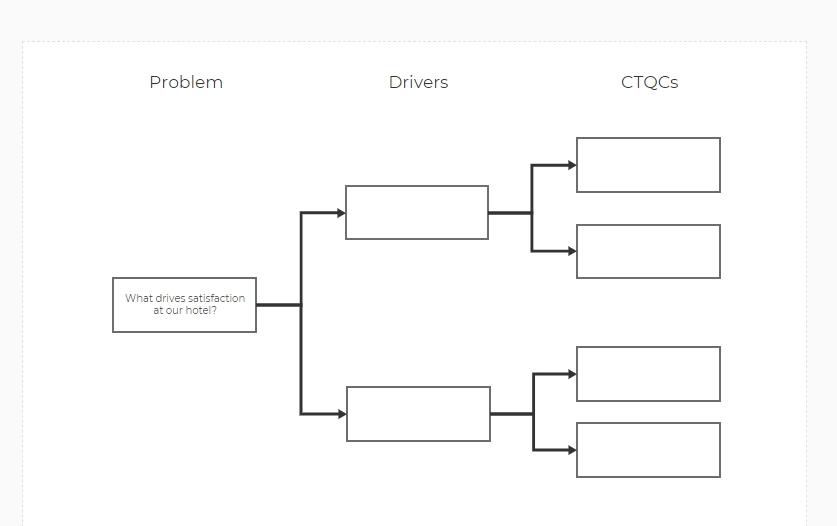
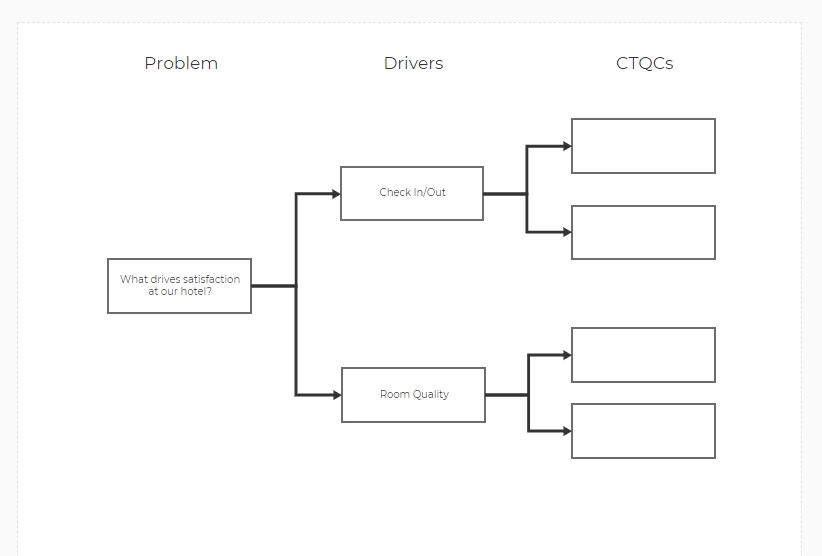
4. The next column is for the drivers. Click on a rectangle to add your driver.
- To add more than the defaults, click on the rectangle you want your new drivers to connect to. Then drag out either the Rectangle shape, or the group of rectangles in a Children shape.

- If your rectangles are not connected correctly, hover over the starting shape and find the blue target points. Click on a target point and drag to appropriate shape. Drop on a blue target point of the new shape when a blue halo appears around the target point.
5. Ask the questions "What does that mean?" of each Driver to get potential CTQCs – enter these in the CTQC boxes, creating additional CTQCs using the method mentioned above for adding more than the defaults.

Preceding Tool: Affinity Diagram
You can build a CTQC Diagram from an Affinity Diagram. After building an Affinity Diagram with categories, you can click on the CTQC spot on the roadmap to populate the drivers of the CTQC Diagram with the categories from the Affinity Diagram.

Use the zoom tool to zoom into the diagram.
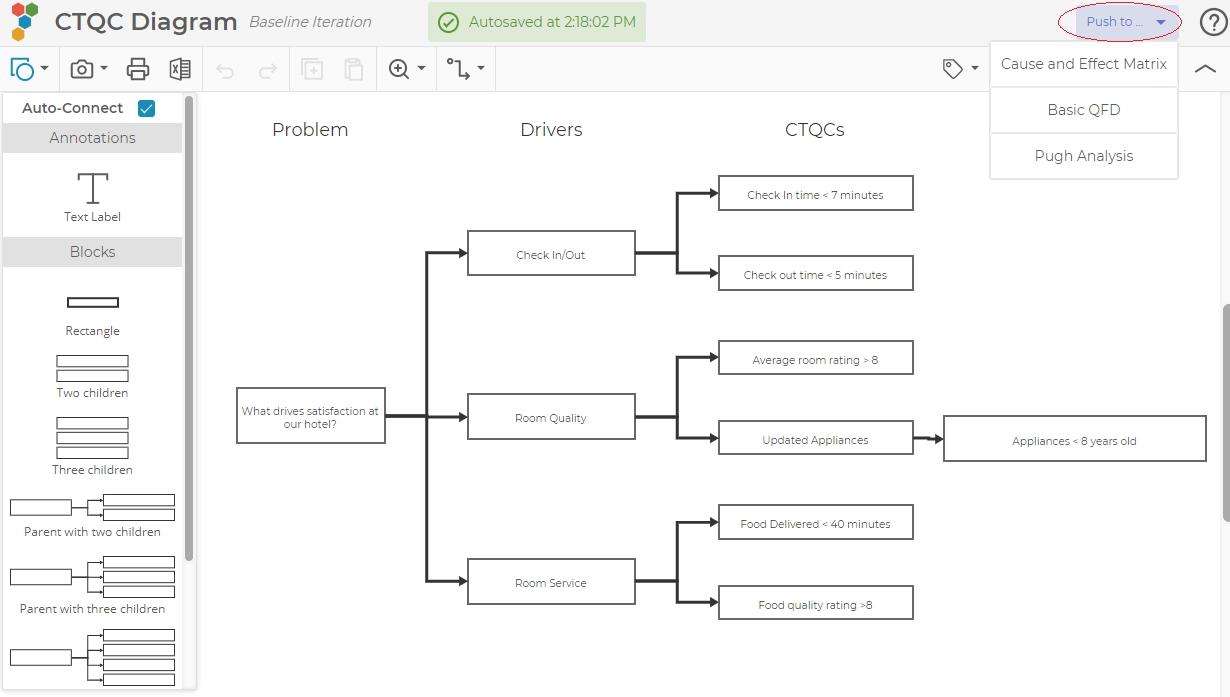
Next Step: Cause and Effect Matrix or QFD Basic
Once you have identified your CTQCs, then you are able to send them to a Cause and Effect Matrix or to a QFD (Basic). Select the next tool you want from the dropdown. Every rectangle in the third column and beyond will be added to the next tool.
Here is an example using the Cause and Effect Matrix:
Note: After you create a Cause and Effect Matrix or QFD (Basic), updates to the CTQC Diagram will NOT carry forward.
Was this helpful?