
Anderson Darling
When to use this tool
The Anderson Darling (AD) Normality Test is used to test whether a set of continuous data is likely to have come from a normal distribution.
The null and alternative hypotheses for this test are, respectively:
H0: The data follow a normal distribution H1: The data DO NOT follow a normal distribution
The test measures the differences between the standard normal distribution and the observed distribution of the sample data. Reject the null hypothesis if the p-value of the test is smaller than your specified alpha level. Rejecting the null hypothesis means the data distribution is unlikely normal.
Notes:
- Hovering over the variable in the variable panel shows a histogram of the data along with the AD test statistic and p-value.
- The AD test has low power to reject H0 when the sample is small (n < 20) and may be overly sensitive (i.e., rejects H0 too often) when the sample is large (n > 1000). Use a reasonably sized sample (n ~ 30 to 100) when running this test.
- Failing to reject the null hypothesis does not necessarily mean the data follow a normal distribution; it simply means no significant departure from normality was detected.
How to use this tool in EngineRoom
To use the AD Normality Test, collect at least 30 observations or subgroups.
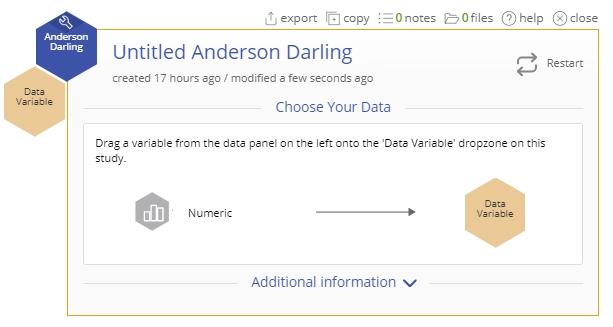
To use the test, select the Data Mgt menu > Anderson Darling. The study opens on the workspace (Guided Mode enabled):
Example:
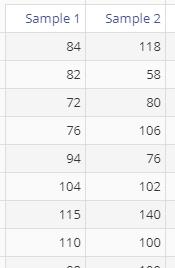
The data set provided contains two columns of data (Sample 1 and Sample 2) of size 30 each. Here, we run the test on each sample at the 5% alpha level:
Steps:
1. Open the Anderson Darling tool onto the workspace.
2. Click on the data file in the data sources panel and drag Sample 1 onto the Data Variable drop zone.
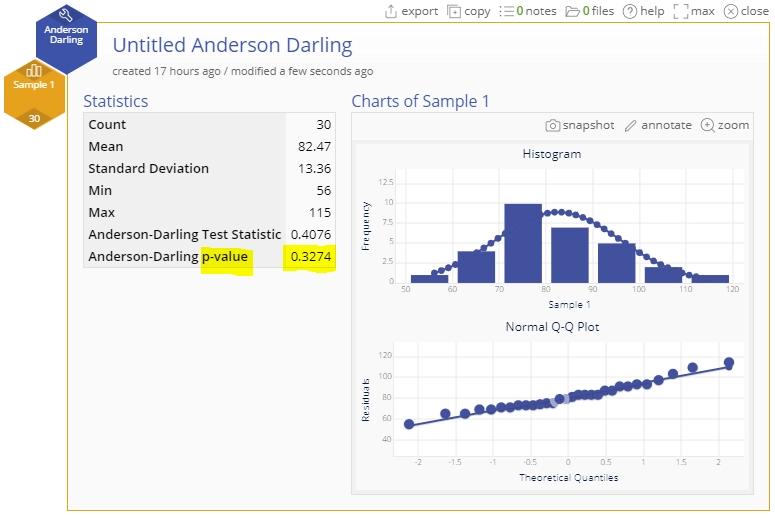
3. The AD Normality Test fails to reject the null hypothesis (p-value = 0.3274 > 0.05):
4. Drag off the Sample 1 variable (or close the study and open a new one) and drag on the Sample 2 variable. This time the test rejects H0 (p-value = 0.0022 < 0.05):
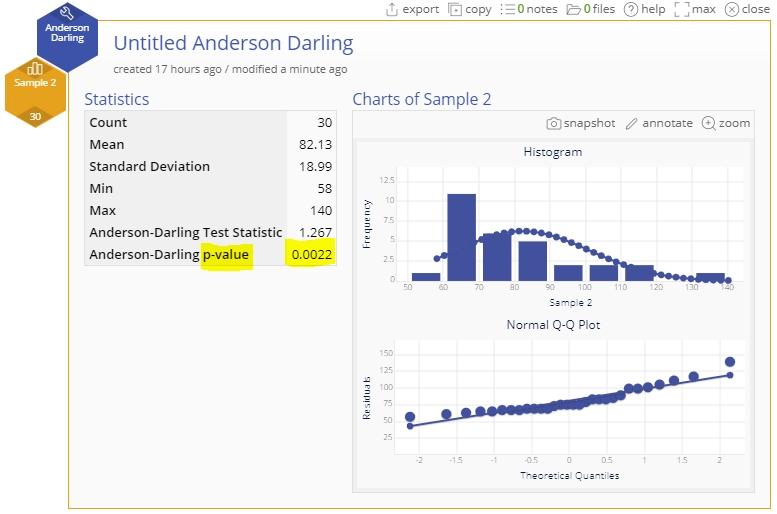
The test output includes a histogram with an overlaid normal distribution, a normal probability (QQ) plot, and a table of descriptive statistics, along with the AD test statistic and p-value. Sample 1, therefore, appears normally distributed and Sample 2 appears to be not normally distributed. Next, we can use the Transformations tool to convert the Sample 2 variable to a normal variable.
Anderson Darling Normality Test Video Tutorial
Instructor Resources
Was this helpful?