
1 Proportion Test Tutorial
When to use this tool
Use the One Proportion Test to test whether the probability of occurrence of an event is different from a standard or historical value. This test is based on the binomial distribution with parameters n (number of trials) and p (probability of the event).
The test makes the following assumptions:
- The data variable is binary (only two possible outcomes).
- The units are randomly sampled.
- The probability of the event ‘p’ is the same (constant) for all the units in the population. In other words, each unit in the population has the same probability of being a 'success'. For example: If you tossed a coin 10 times, each toss has the same probability (say 0.5) of coming up Heads.
Using EngineRoom
Click to Download Data File There are two ways to select the test:
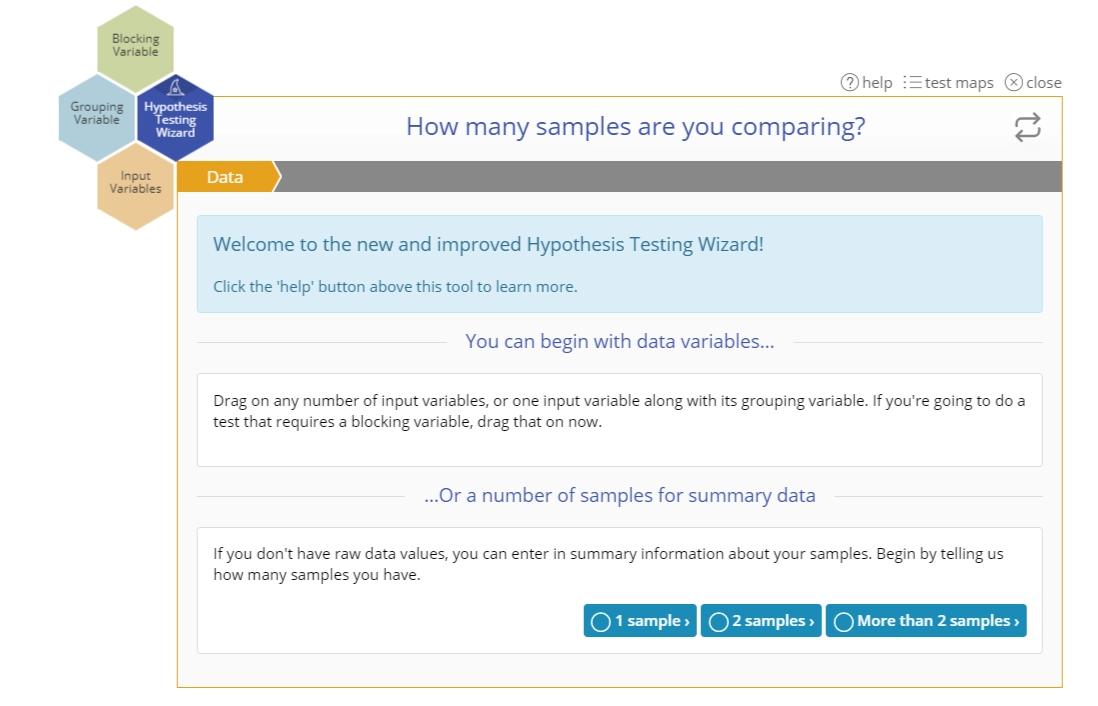
- If you are not sure which test is best suited to your data or scenario, use the Wizard, which will lead you through a series of questions and answers to the appropriate test. Select the Analyze menu > Hypothesis Testing Wizard. The wizard dialog opens on the workspace:
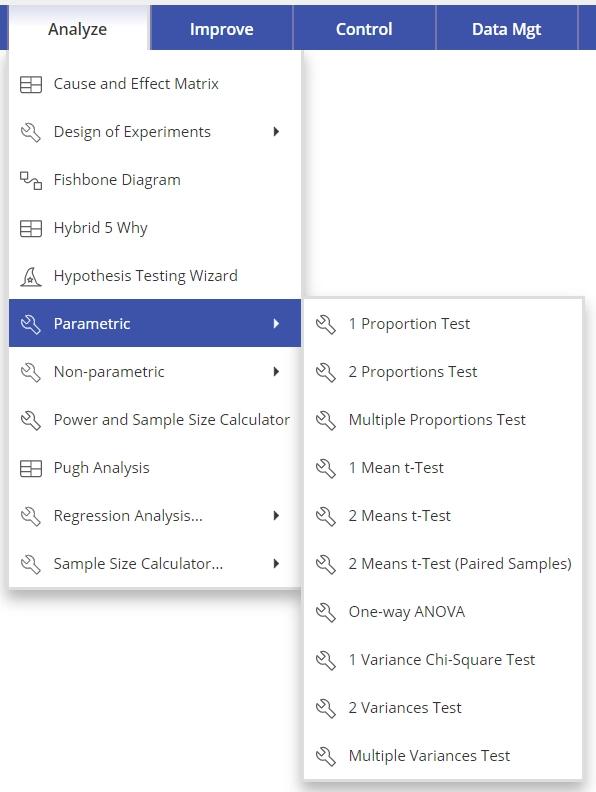
- Alternatively, if you know you want to use the 1 Proportion test, you can skip the wizard and go directly to the test study. Select the Analyze menu > Parametric > 1 Proportion Test:
Summary data example:
In this example we will use summary data on reported late deliveries. In this case we're testing whether the proportion of late deliveries at a pizza company is greater than 0.05, at the 5% significance level.
Steps:
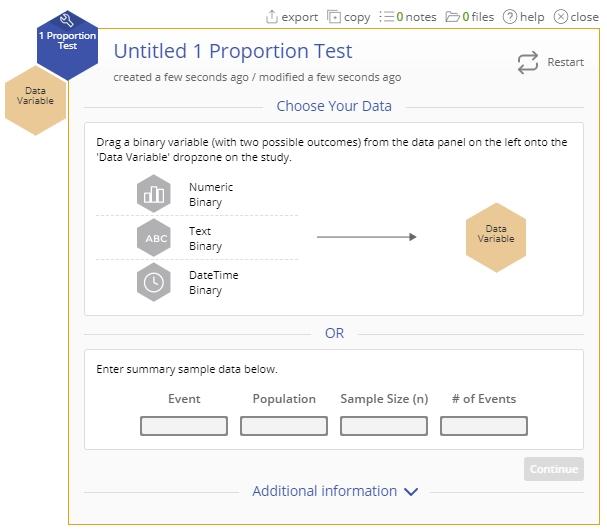
- Open the 1 Proportion Test study from the Parametric menu:
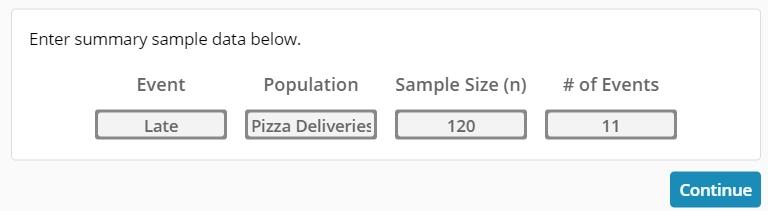
- Enter the summary data into the form provided and click Continue:
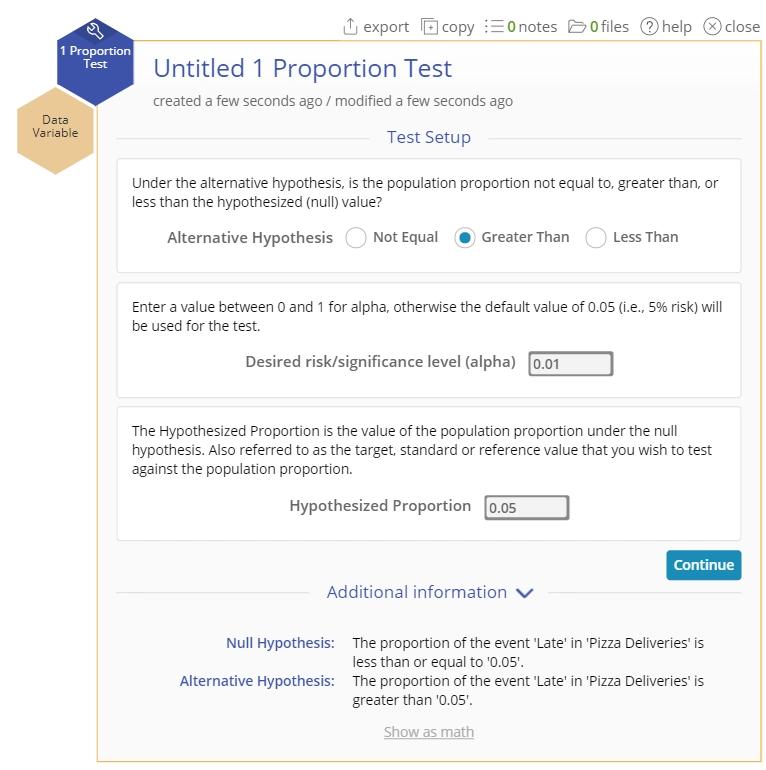
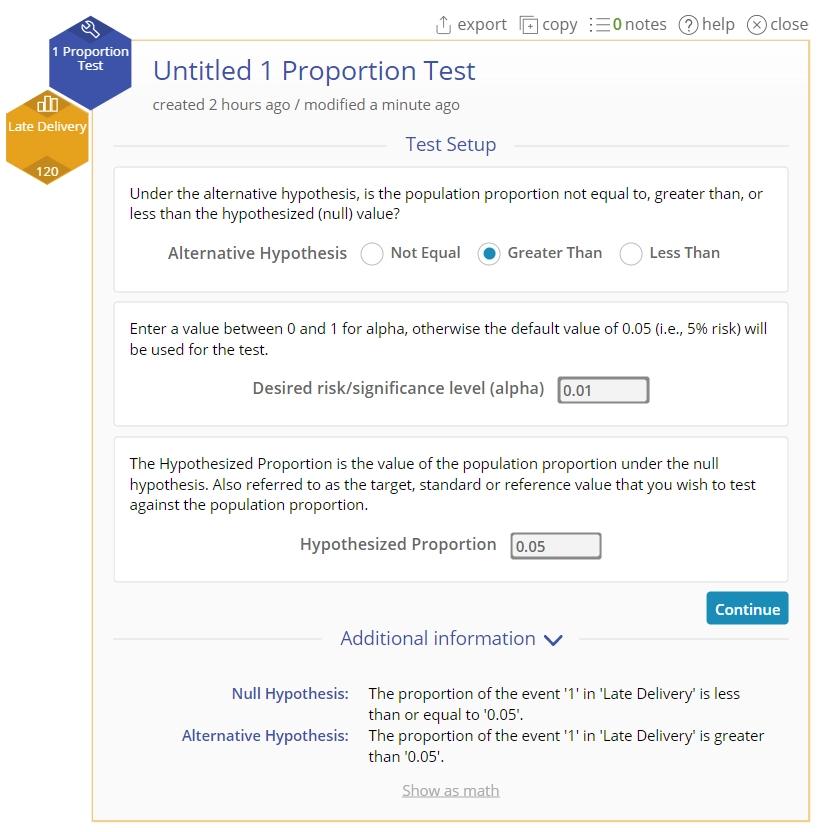
- Set up the test as shown and click Continue:
- The 1 Proportion Test output using summary data is shown:
Based on this output, we reject the null hypothesis and conclude that the proportion of late pizza deliveries is greater than 0.05, because the p-value is smaller than the specified significance level of 0.05.
Raw data example:
Most of the time, you will have summary sample data if you're dealing with proportions (e.g. 23 defectives in a batch of 100) - it is rare to have raw data in the form of 0s and 1s. However, in the event you do have raw data, the example below will demonstrate how to run the test.
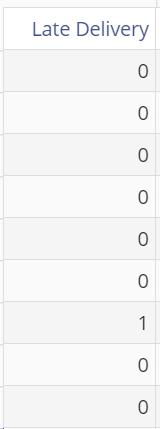
The data set provided contains a binary variable, Late Delivery, containing 120 observations coded 1 for a late delivery of pizza and 0 otherwise. Test whether the proportion (probability) of late deliveries is greater than 0.05, at the 5% level of significance.
First, your data should be formatted as a single column with binary data values, like in the example shown here:
We will analyze these data using the standalone test:
Steps:
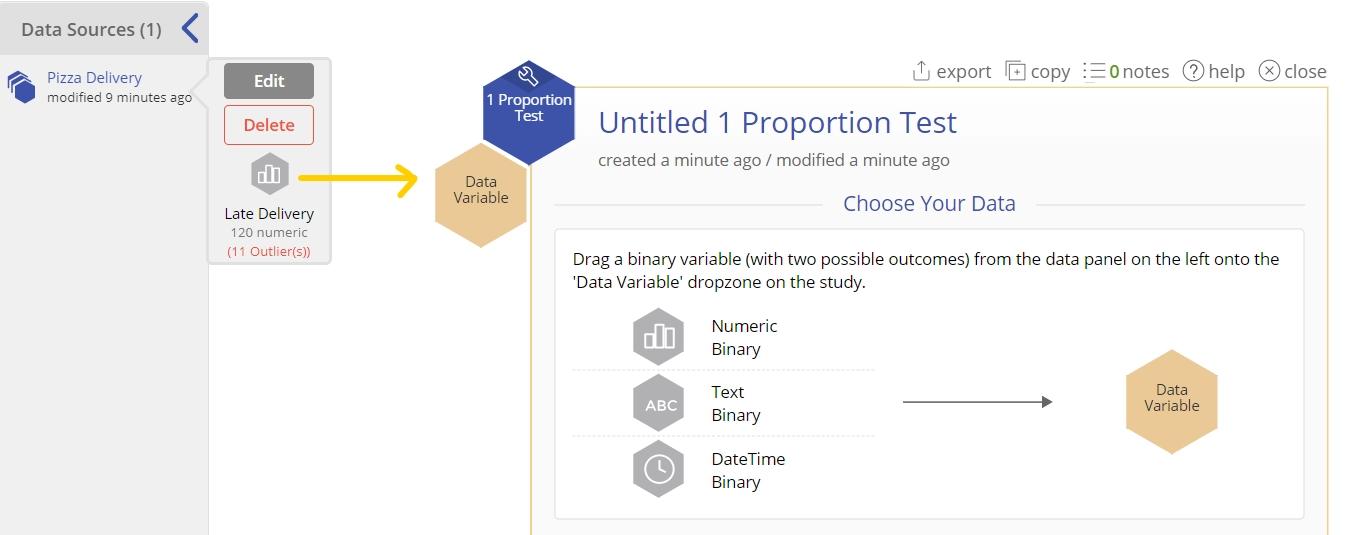
- Open the test and drag the Late Delivery variable from the data source onto the Data Variable drop zone:
- Set up the test as shown and click Launch:
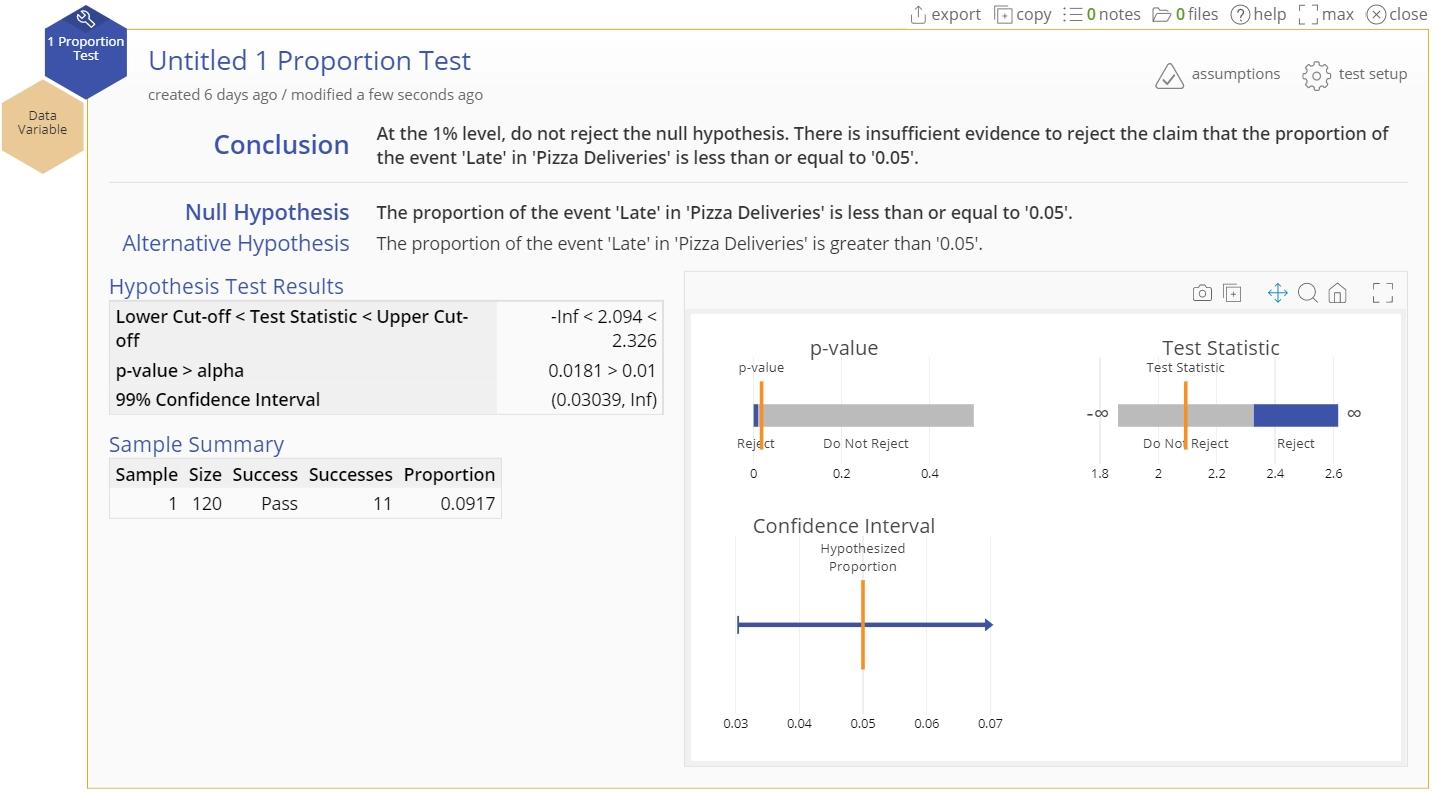
- The 1 Proportion test output using raw data is shown:
1 Proportion Test Video Tutorial
Instructor Resources
Was this helpful?