
Power and Sample Size Calculator Tutorial
When to use this tool
Use this Power and Sample Size calculator for Hypothesis Tests to find the power or required sample size for the any of following tests:
- One Proportion Test
- Two Proportions Test
- One Mean t-Test (or Paired t-Test)
- Two Means t-Test
- One-Way ANOVA
The Power of a test answers the question: "If the null hypothesis is false, what is the probability that the data from the experiment will reject the null hypothesis?" In other words, Power is your probability of successfully detecting a signal amid the noise. That signal is the smallest shift or improvement in your process that actually matters to your business. Naturally, a high-powered test is desirable, but detecting smaller differences requires lower variation and larger sample sizes. The goal of a Power Analysis is to strike a balance among these competing factors so you can catch the difference that matters without over-investing resources.
The factors affecting power are:
Effect Size / Signal (Δ): This is the minimum difference or process shift that is important to detect—representing the smallest magnitude of change of practical significance to your business. In EngineRoom, rather than entering a single calculated Δ value directly (except in One-Way ANOVA), you define this difference by entering your baseline and comparison hypothesis parameters:
- One Proportion: Enter P0 (null proportion) and P1 (alternative proportion). EngineRoom calculates Δ = |P1 - P0|.
- Two Proportions: Enter P1 (Group 1 proportion) and P2 (Group 2 proportion). EngineRoom calculates Δ = |P2 - P1|.
- One Mean t-Test (or Paired t-Test): Enter mu0 (null mean) and mu1 (alternative mean). EngineRoom calculates Δ = |mu1 - mu0|.
- Two Means t-Test: Enter mu1 (Group 1 mean) and mu2 (Group 2 mean). EngineRoom calculates Δ = |mu1 - mu2|.
- One-Way ANOVA: Enter the “difference to be detected” as Δ directly into the tool.
Significance Level (α): The maximum risk you are willing to accept of falsely rejecting the null hypothesis when it is actually true (Type I error, commonly set at 0.05).
Sample Size (n): The number of observations available or required per group/sample.
Population Standard Deviation (σ): The inherent process variability (required for continuous data tests: t-tests and ANOVA).
By adjusting the values of these inputs where possible, you can ensure a high level of power for detecting meaningful process changes. You can use this tool to calculate the power of a test given a specific sample size, or to determine the sample size required to achieve a target power level.
How to use this tool in EngineRoom
To see how EngineRoom balances these parameters in practice, consider a typical scenario: a project team is evaluating if a new process change affected average cycle time (measured in minutes). The current process mean (mu1) is 5 minutes, and the team wants to detect whether the new process mean (mu2) increased or decreased by 2 minutes. The signal of 2 will be represented by mu2 = 7 so that Δ = |7 - 5| = 2 minutes. Historical data indicates a pooled process standard deviation (σ) of 2.25 minutes. The standard significance level (α) is set to 0.05 for the study.
EngineRoom allows practitioners to solve for either unknown variable: determining the resulting Power given a fixed sample size, or solving for the required Sample Size given a target power.
Calculating Power for a Fixed Sample Size
When resources or time limit the number of data points you can collect, calculating power upfront tells you whether the planned sample size provides a realistic chance of detecting the process shift.
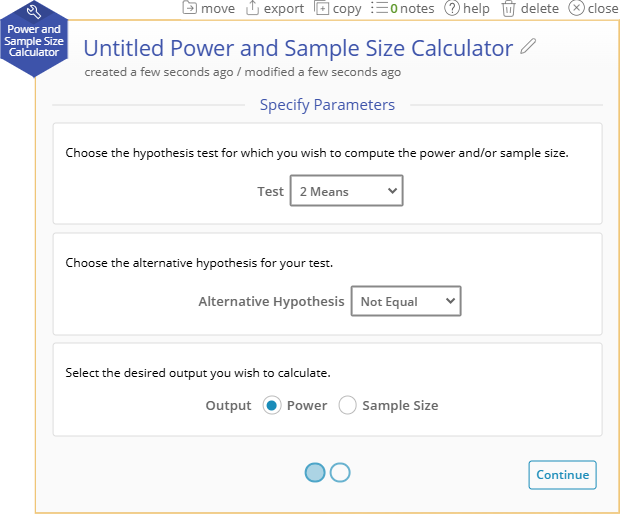
Open the Power and Sample Size Calculator in EngineRoom and select the Two Means test and the desired output as Power.
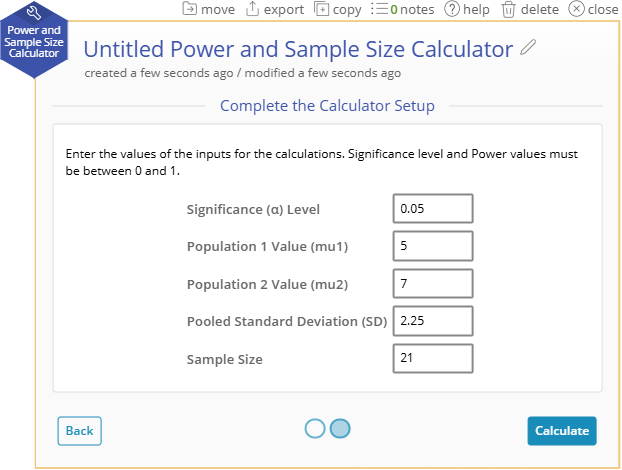
Enter the baseline parameter values:
- Null Mean (mu1): 5
- Alternative Mean (mu2): 7
- Pooled Standard Deviation (σ): 2.25
- Significance Level (α): 0.05
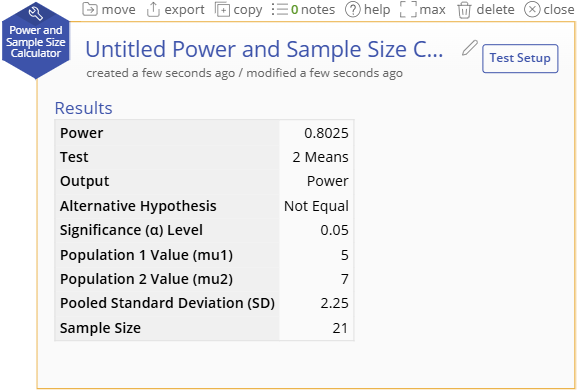
Click Calculate and EngineRoom generates the calculation output. For n = 21 observations per group, the calculated power is approximately 0.8025 (80%). This indicates an 80% chance of detecting a 2-minute shift in cycle time.
Calculating Required Sample Size for a Desired Power
During project scoping, practitioners usually work in reverse: deciding on a target power (typically 0.80 or 80%) and calculating how many samples must be collected to achieve it.
Toggle the calculator mode to determine Sample Size.
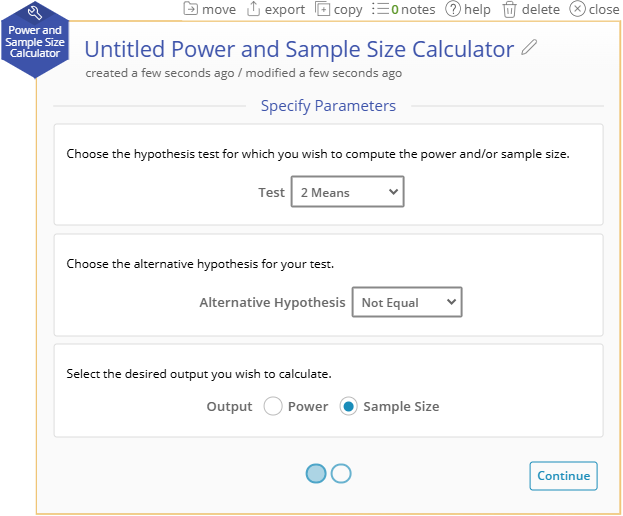
The parameter values (mu1 = 5, mu2 = 7, σ = 2.25, α = 0.05) remain the same from the previous run. This time insert 0.8 for Desired Power.
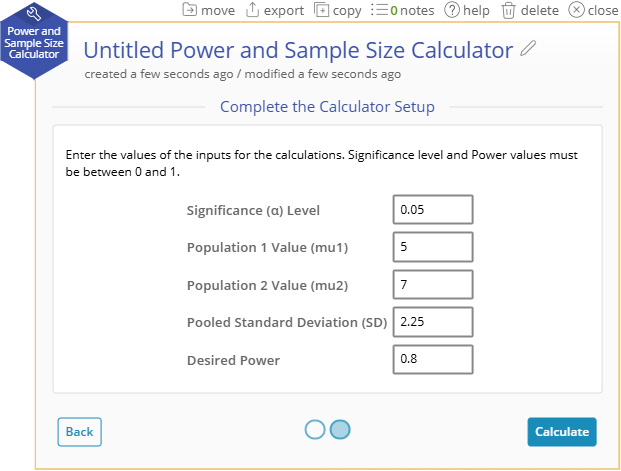
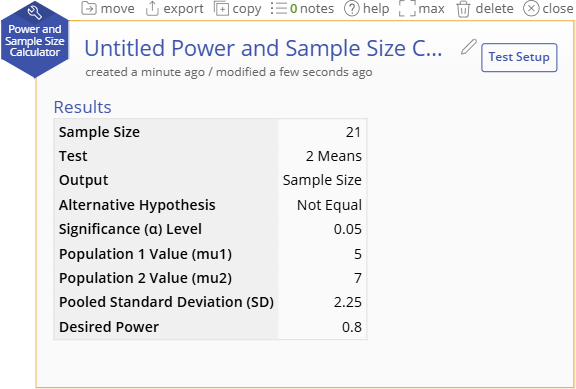
Click Calculate. EngineRoom returns the required sample size: 21 observations per group (total N = 42).
Generalizing Across Other Hypothesis Tests
While this example uses a Two-Sample t-Test, the workflow in EngineRoom remains identical across all standard hypothesis tests. The only difference lies in how you define the signal (Δ):
- One Proportion Test: Enter P0 (baseline) and P1 (target). EngineRoom evaluates Δ = |P1 - P0|.
- Two Proportions Test: Enter P1 (Group 1) and P2 (Group 2). EngineRoom evaluates Δ = |P1 - P2|.
- One Mean t-Test / Paired t-Test: Enter mu0 (baseline/null) and mu1 (comparison). EngineRoom evaluates Δ = |mu1 - mu0|.
- One-Way ANOVA: Enter the “difference to be detected” as Δ directly, alongside group variance estimates.
By maintaining this consistent framework, you can navigate any power calculation.
One-Sided vs. Two-Sided Alternative Hypotheses
The example above assumes a two-sided test (H1: mu1 is not equal to mu2), which divides the total significance level α = 0.05 equally into both tails of the distribution (α/2 = 0.025 per tail). This tests for process shifts in either direction (improvement or degradation).
If your project team is strictly interested in a directional shift such as verifying that cycle time has only increased (H1: mu1 < mu2), you can select a one-sided test:
- Impact on Statistical Power: In a one-sided test, the entire risk allowance (α = 0.05) is placed in a single tail. This lowers the critical threshold required to declare statistical significance.
- Sample Size Efficiency: For the same parameters (mu1 = 5, mu2 = 7, σ = 2.25, Power = 0.80), a one-sided test requires fewer samples (approximately n = 17 per group instead of n = 21) to achieve 80% power.
- Practical Risk: While one-sided tests increase statistical sensitivity, they forfeit the ability to detect shifts in the unanticipated direction. If the process actually degrades (e.g., cycle time decreases to 3 minutes instead of increasing), a one-sided lower-tail test will fail to flag the change as significant. In most studies, two-sided tests remain the recommended default unless directional shifts are strictly dictated by process economics.
Was this helpful?