One-way ANOVA Tutorial
When to use this tool
Use the One Way Analysis of Variance (ANOVA) Test to check the equality of three or more means from independent groups/populations. As an example, you can test whether the mean 'taste' score is the same across different brands of ice cream, based on a taste test with numeric scores.
ANOVA assumes the underlying data distributions are normal and that the variances are equal across the populations.
The test makes the following assumptions:
- The data are continuous numeric.
- The units are randomly sampled.
- The groups are independent.
- The groups are normally distributed.
- The groups have equal variances.
Note: This test is robust to the violation of the normal distribution assumption for large samples. Similarly, the test is fairly robust to the violation of the equality of variances assumption IF all the samples are of the same size.
Using EngineRoom
Note: You must have raw data to run this test. Summary data cannot be used to run the ANOVA.
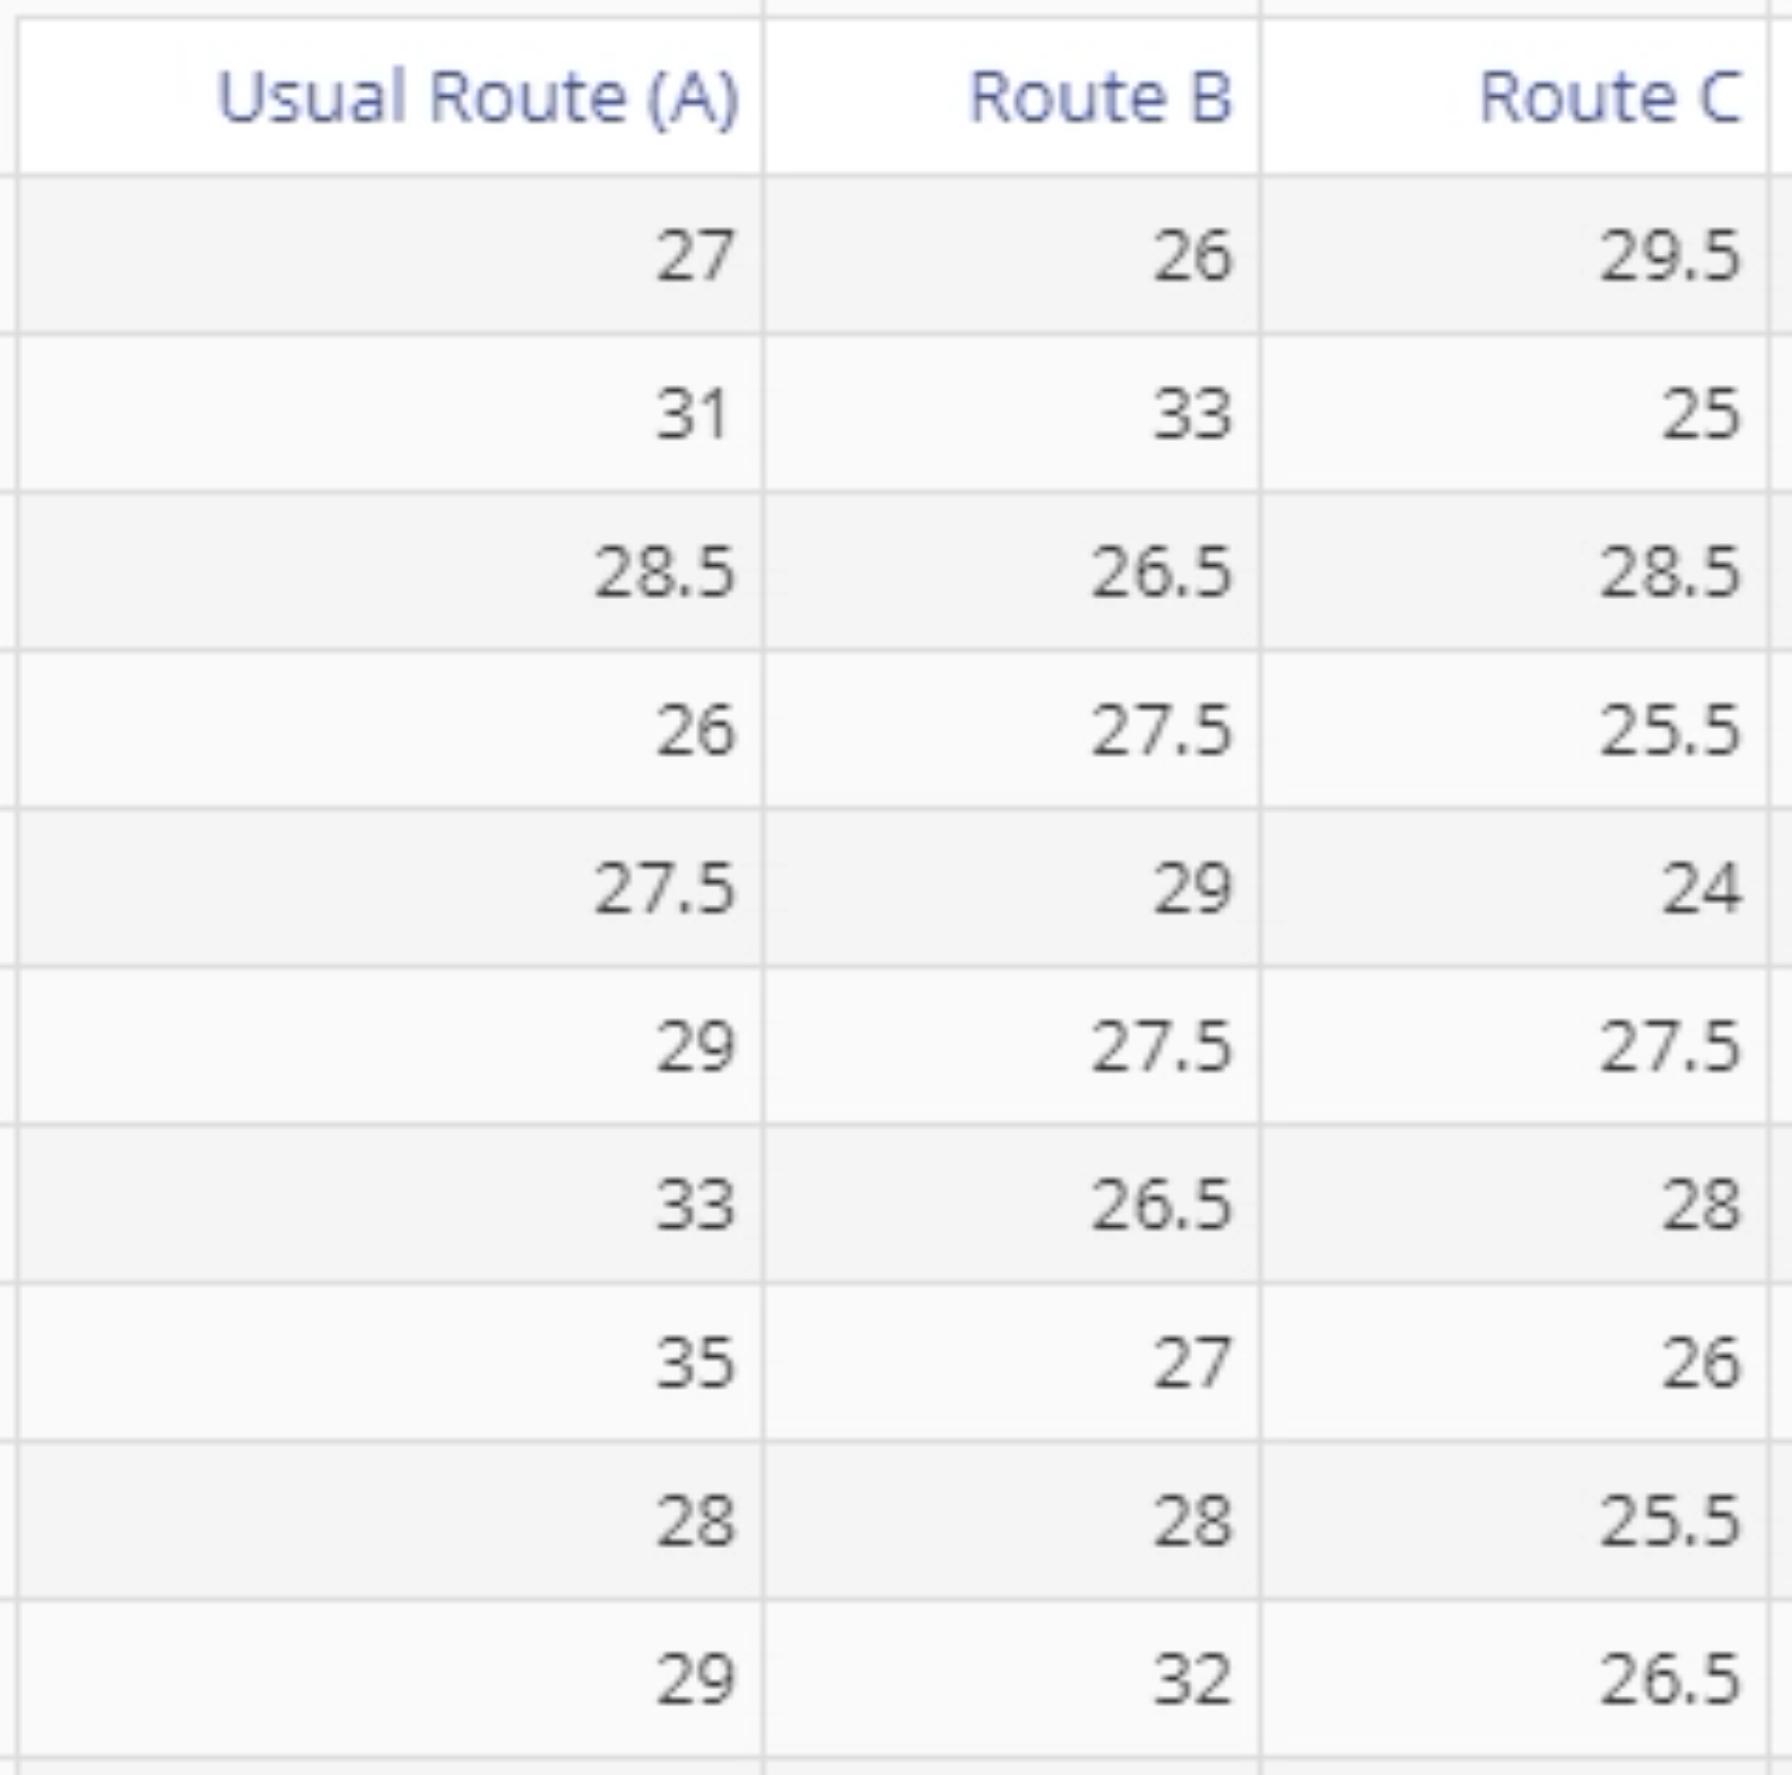
You can only use this test on raw data. The data variables may be in separate columns, or in a single column with a second column containing the group IDs:
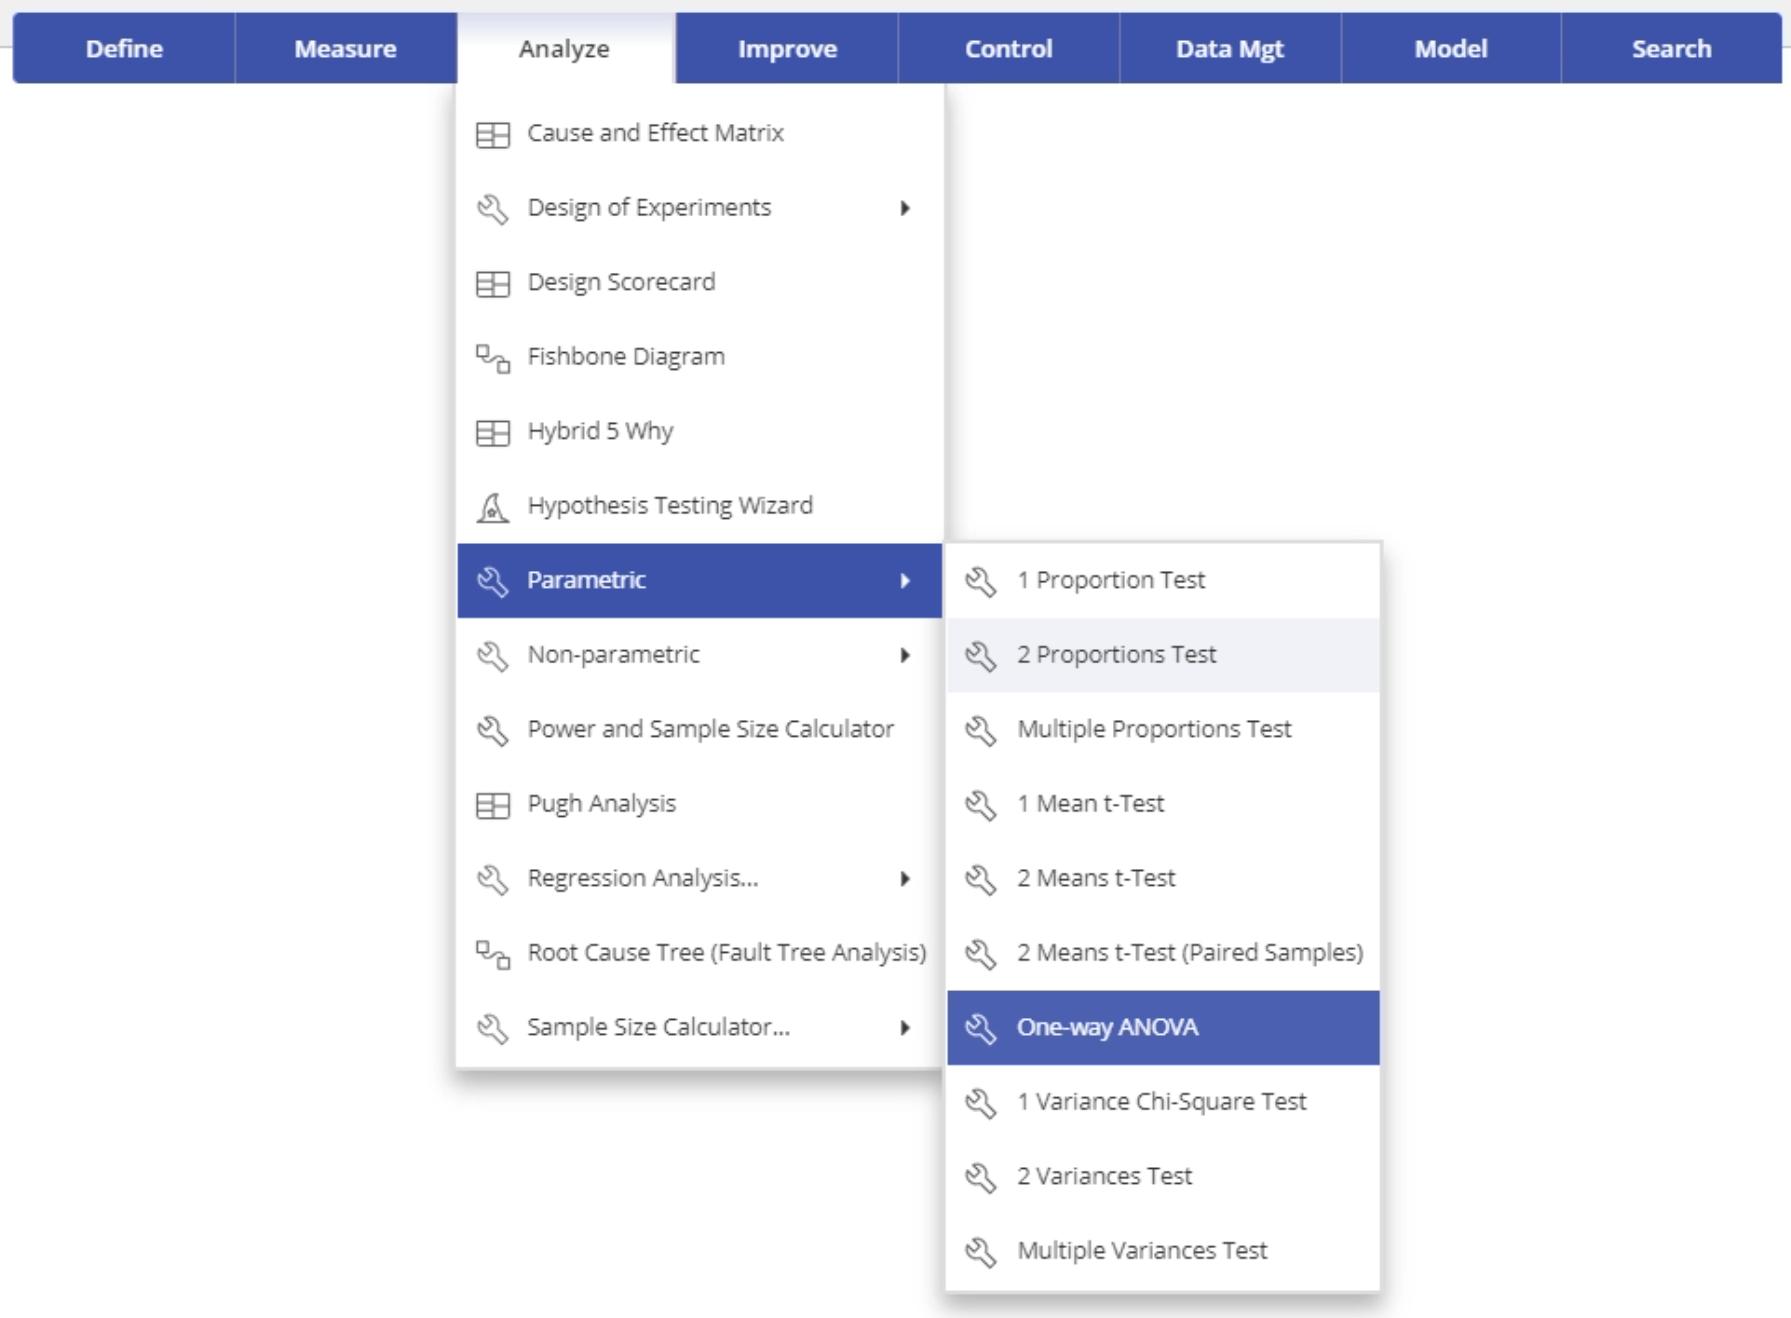
Select One-Way ANOVA from the Parametric Test menu OR follow the steps in the Hypothesis Testing Wizard for three or more continuous variables.
Example:
In this example, we have data on the time taken to complete deliveries using three different routes. We will use the standalone ANOVA test from the Parametric menu to test whether the route means differ significantly, and if they do, identify the shortest route.
Steps:
- Select the Analyze menu > Parametric > Click on One-Way ANOVA:
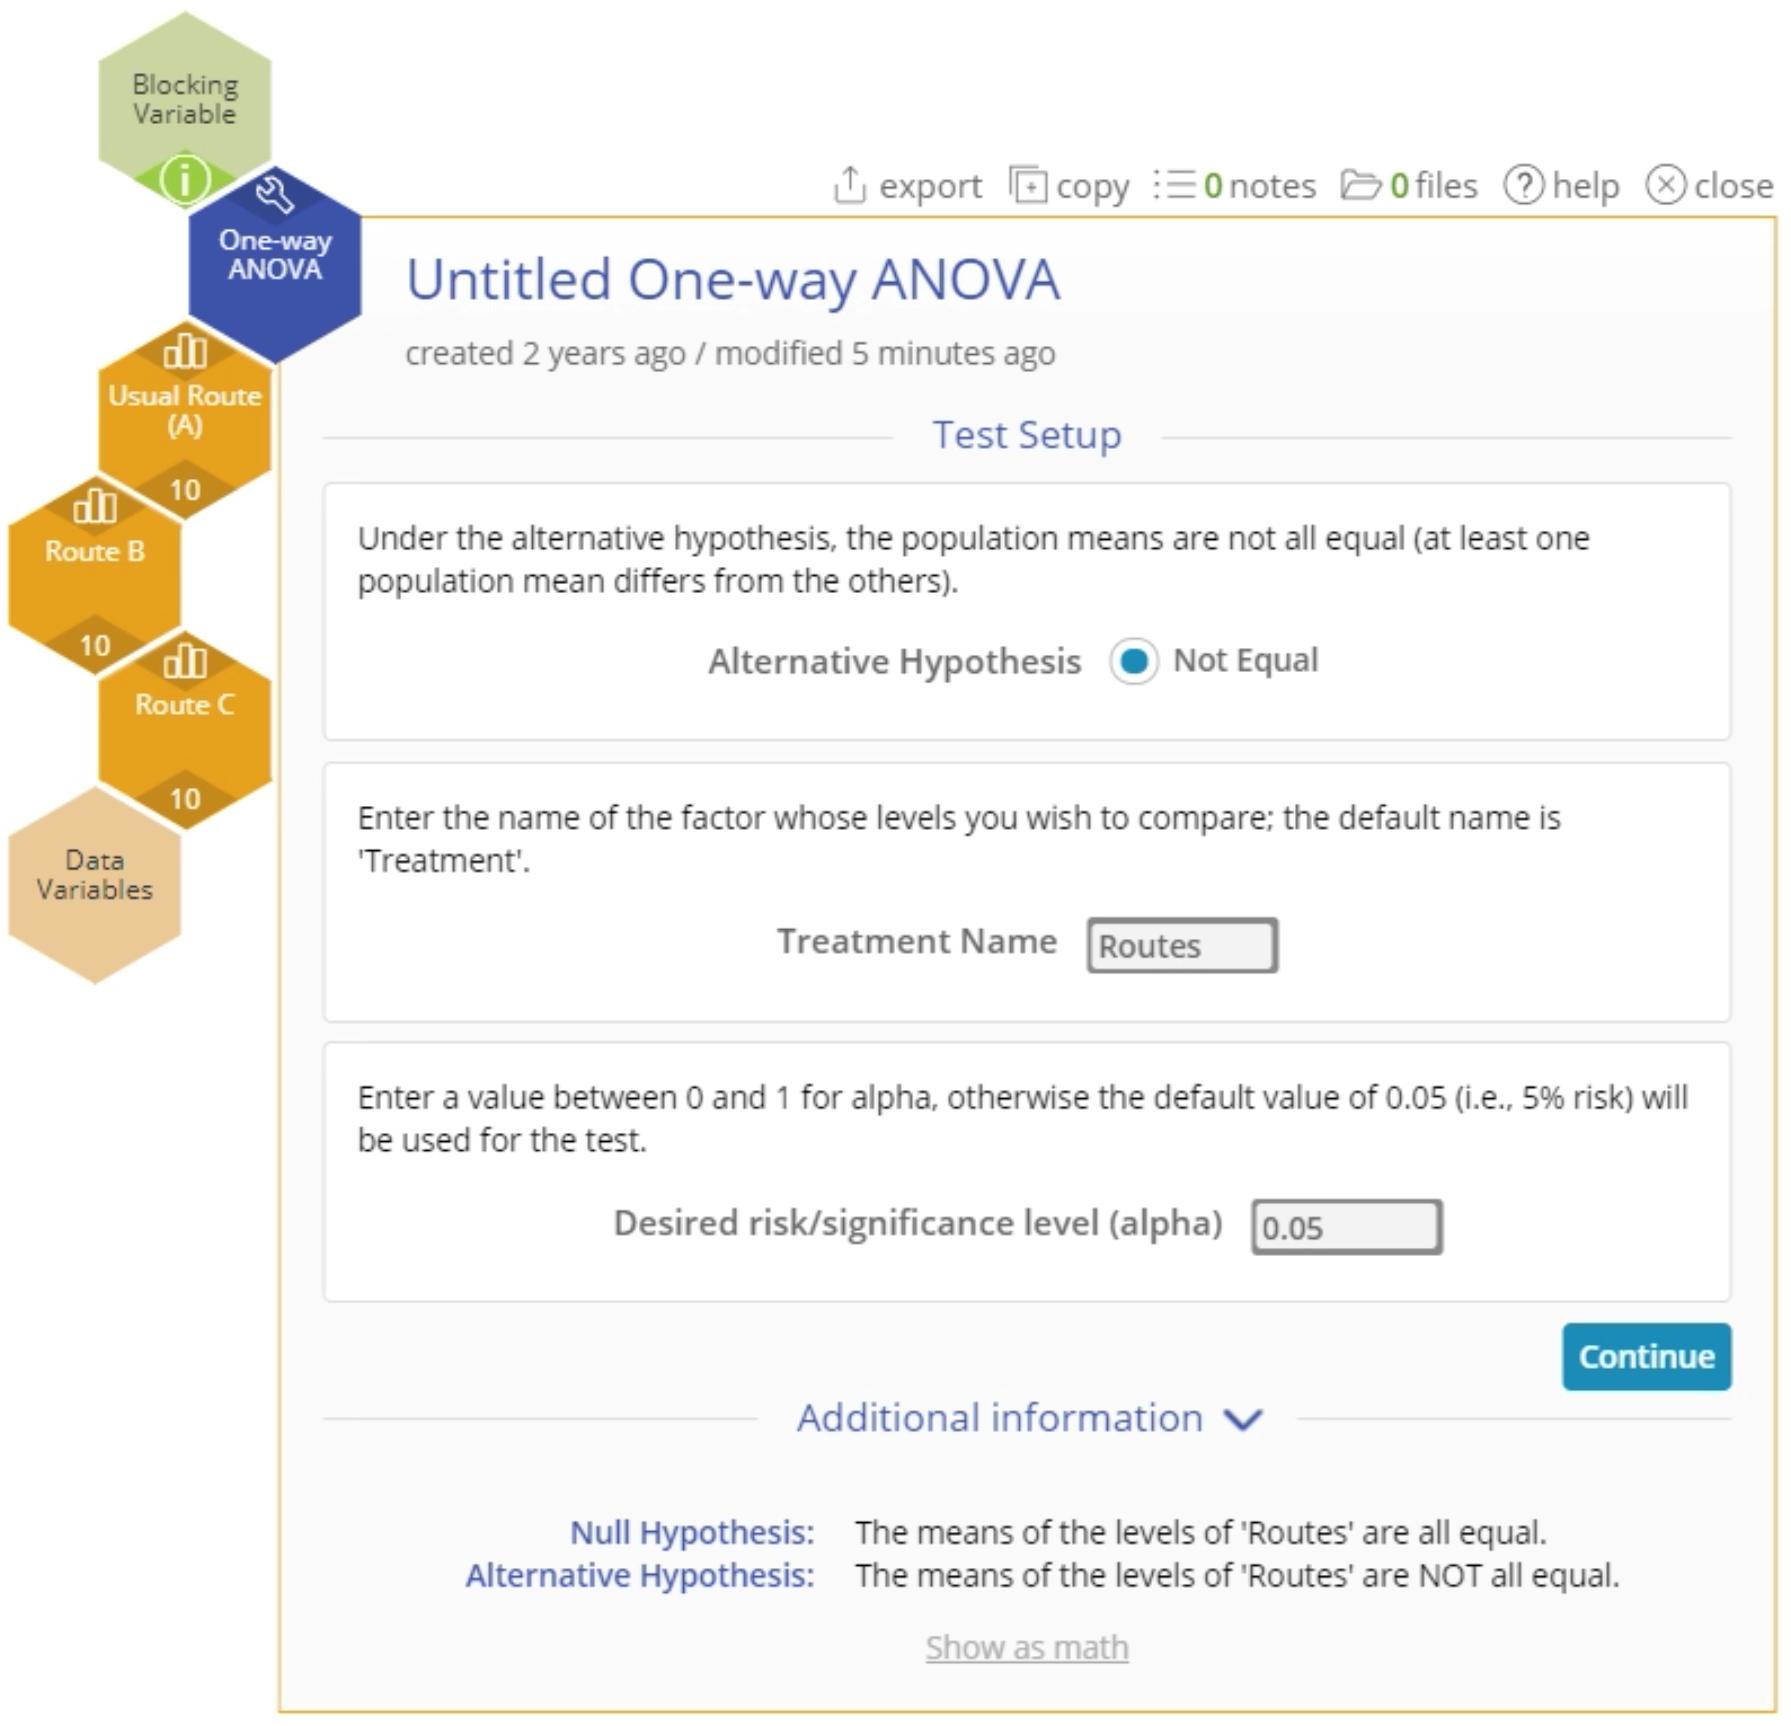
- Drag each route variable onto the Data variable drop zones which appear on the study and set up the test as shown, and click Continue:
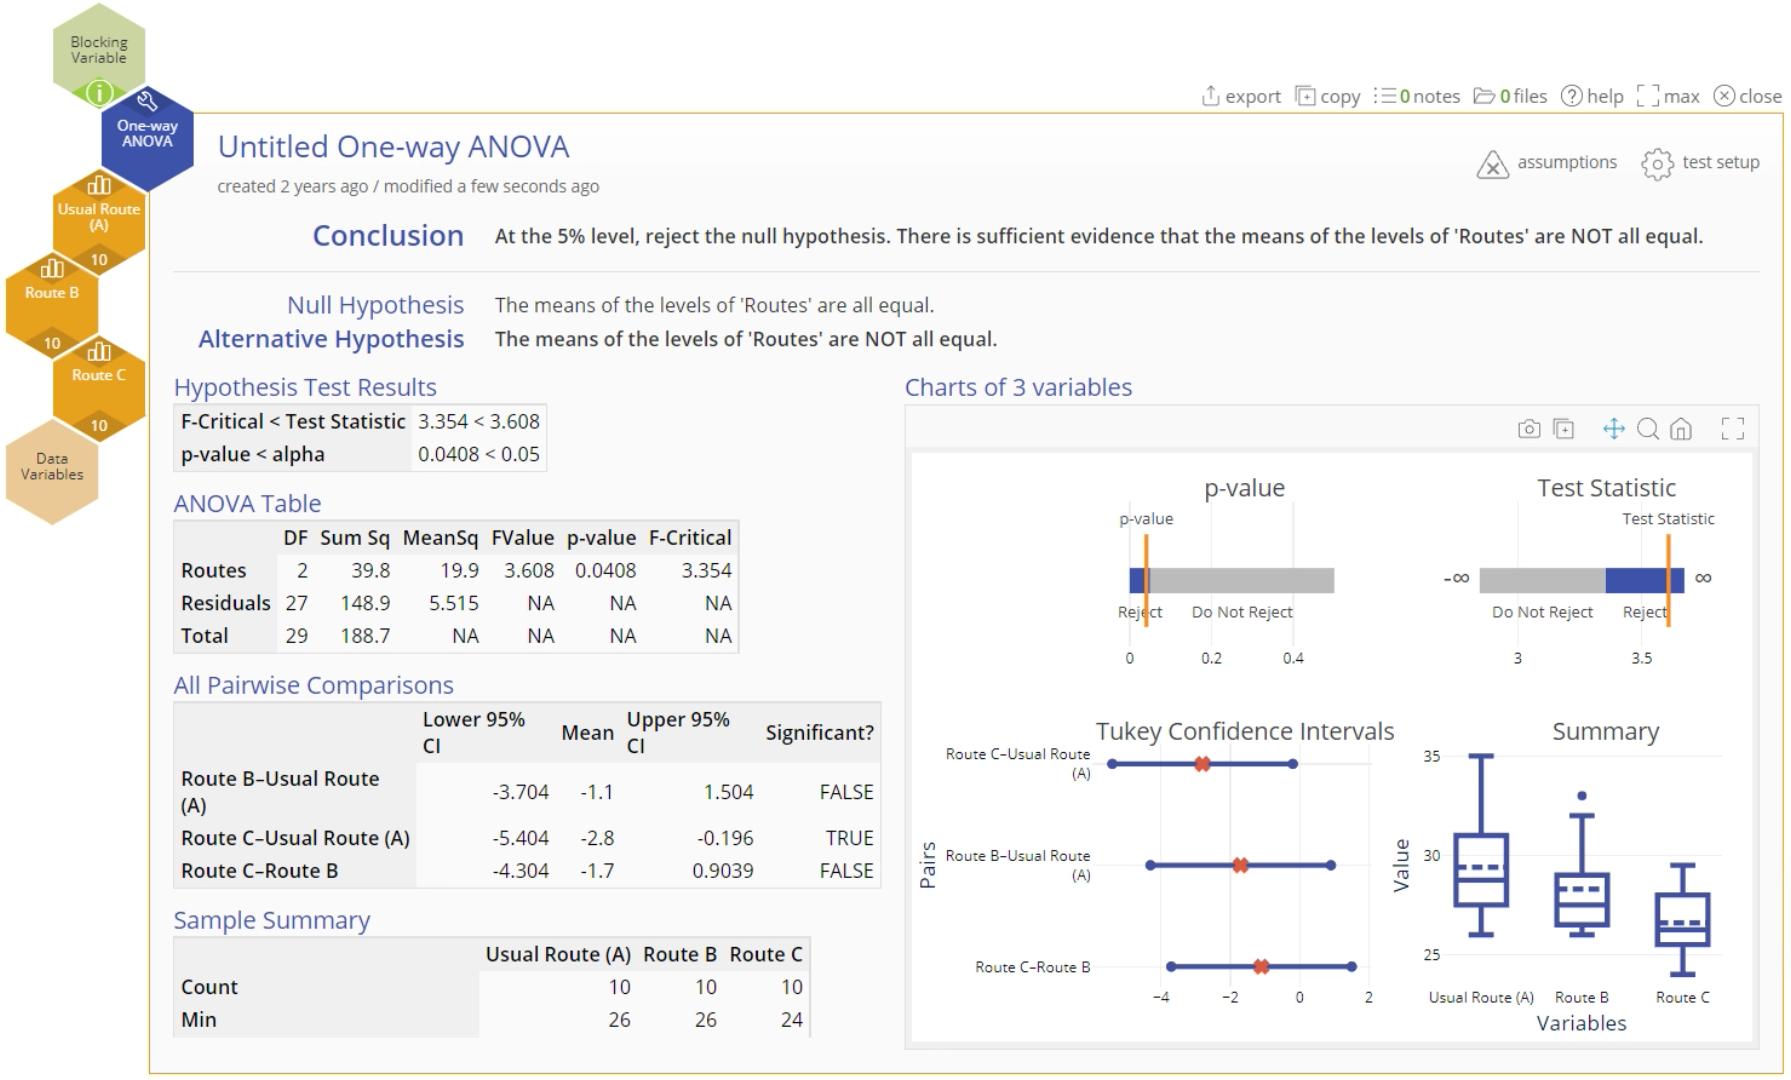
- The ANOVA output is shown:
Note:
- The output includes the ANOVA table showing the p-value. If the p-value is smaller than the chosen significance level (0.05 by default), then we reject the null hypothesis and conclude that the means differ significantly. This is the case in this example.
- If the test is significant (i.e. we reject the null hypothesis), the next task is to identify which pair/s of means is/are different. Examine the All Pairwise Comparisons table in the output to get this information. In our example, the difference of means of Route C - Route A is significant, so route C differs significantly from route A. Further, this difference is negative (from the sign of the mean difference, -2.8) so we can say that the mean distance from route C is shorter than that from route A. Thus, route C is the shortest route.
One-way ANOVA Video Tutorial
Instructor Resources
Was this helpful?


