
2 Means t-Test Tutorial
When to use this tool
Use the 2 Means t-Test or 2 samples t-Test to compare the means of two independent groups/populations. As an example, the average monthly sales of two products, Brand A and Brand B, are compared to see which one is more popular.
The test makes the following conditions/assumptions:
- The data are continuous numeric.
- The units are randomly sampled.
- The two groups are independent.
- The two groups are normally distributed.
There are two versions of the Two Means t-Test depending on whether the groups being compared have equal or unequal variances. In EngineRoom, you would use the 2 Means t-Test in either case - it checks whether or not the variances are equal and automatically applies the correct test version.
This test is robust to violations of the normal distribution assumption, i.e., it performs well for small to moderate departures from normality, especially for large samples (n > 30).
Using EngineRoom
Click to Download Data File The test can be used on raw data (i.e., the actual sample measurements) or sample summary data in the form of the sample sizes, means and standard deviations.
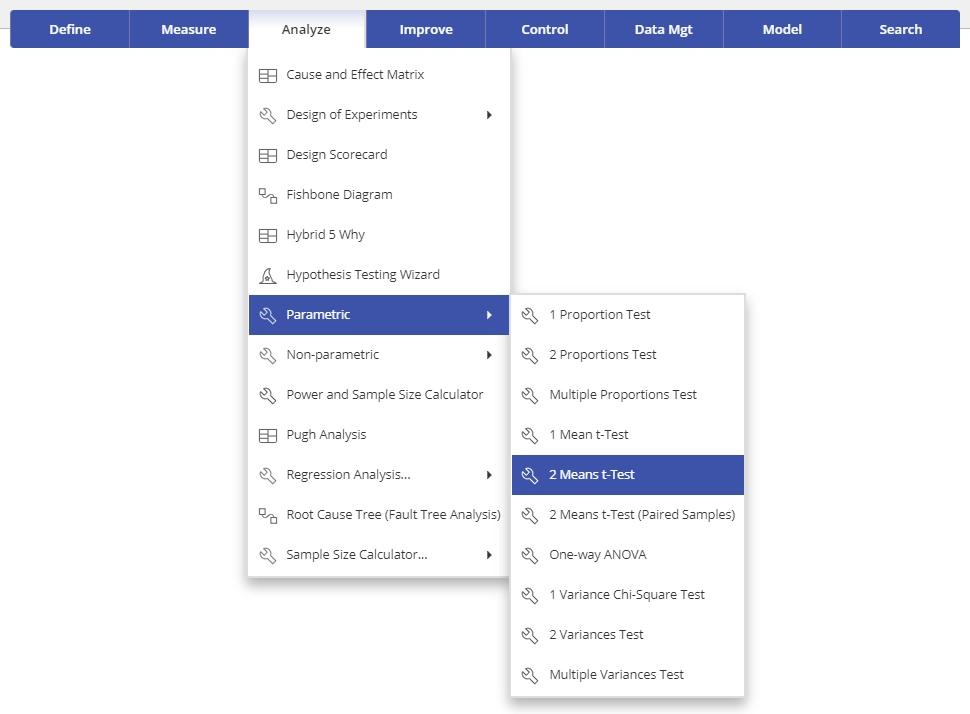
Select the 2 Means t-Test from the Parametric Test menu OR follow the steps in the Hypothesis Testing Wizard for two continuous data variables.
Example:
Let’s consider an example comparing the mean sales at two different stores. Store A underwent a change to the store layout, so the parent company wants to compare its sales to that of another store in the same area, to see if sales are significantly higher at Store A. A meaningful difference would be an increase of more than $5 thousand in weekly sales. In this example we will use the standalone test from the Parametric menu.
Raw data
Your data must be formatted in one of two ways: the two samples can be in separate columns, or all the sample data in a single column with the corresponding labels (the group assignments) contained in a second column:
To use the sample data in two columns, follow these steps:
- Select the Analyze menu > Parametric > Click on the 2 Means t-Test
- Navigate to the data source and place the Store A variable onto the Data Variables drop zone on the study:
- A new Data Variable drop zone appears. Drag the Store B data variable onto the second Data Variable drop zone:

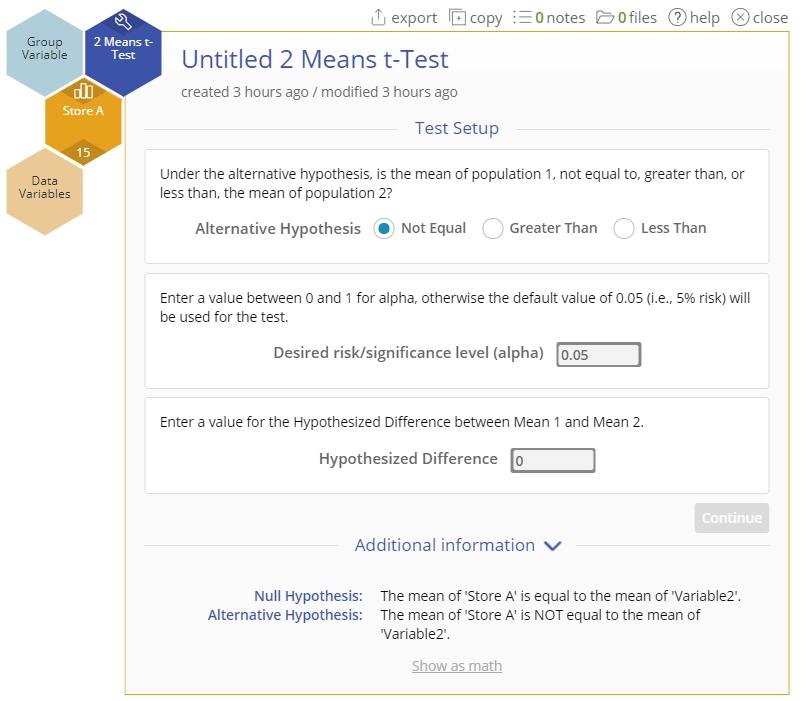
- We want to test whether Store A's sales are over $5 thousand greater than Store B's sales (the data are in thousands), at the 5% level of significance. Set up the test as shown below:

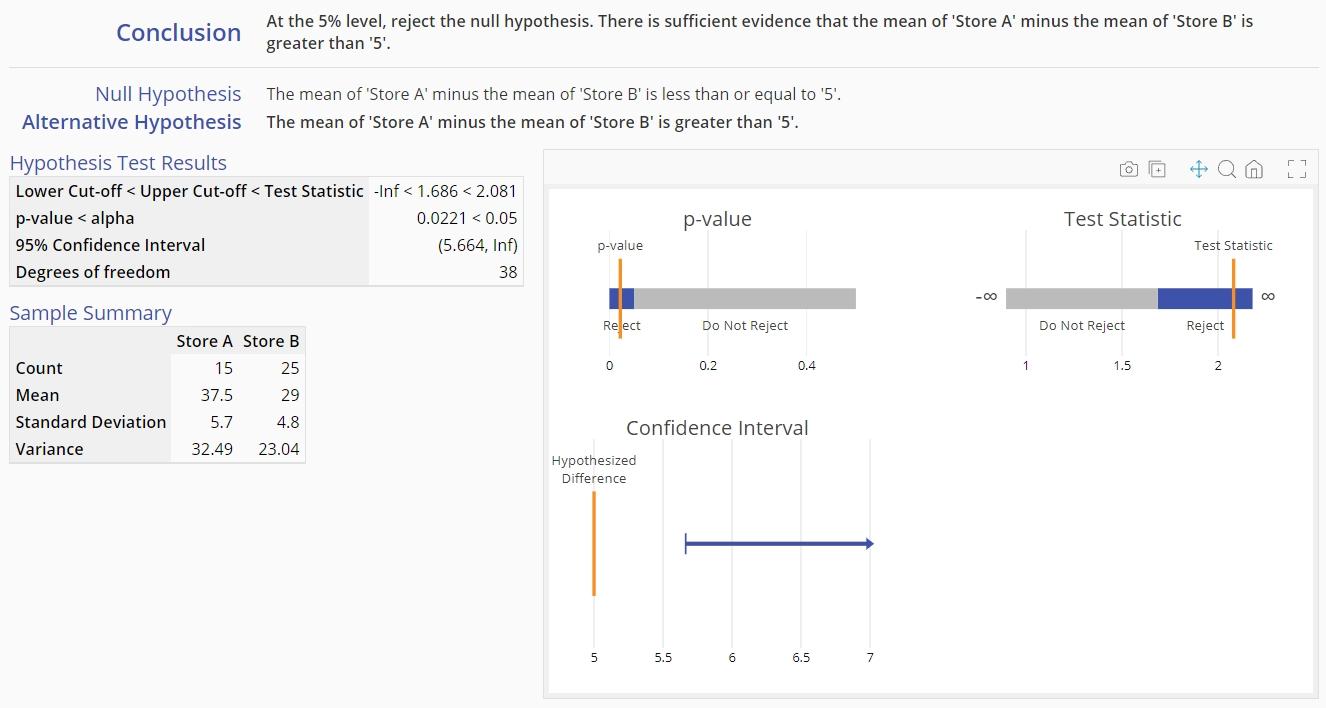
- Click Continue. The output for the 2 Means t-Test for independent samples is shown:
To use the single column of data with group ID variable, follow these steps:
Steps:
- Select the Analyze menu > Parametric > Click on the 2 Means t-Test
- Navigate to the data source and place the Weekly Sales variable onto the Data Variables drop zone on the study:

- Drag the Store variable onto the Group variable drop zone:
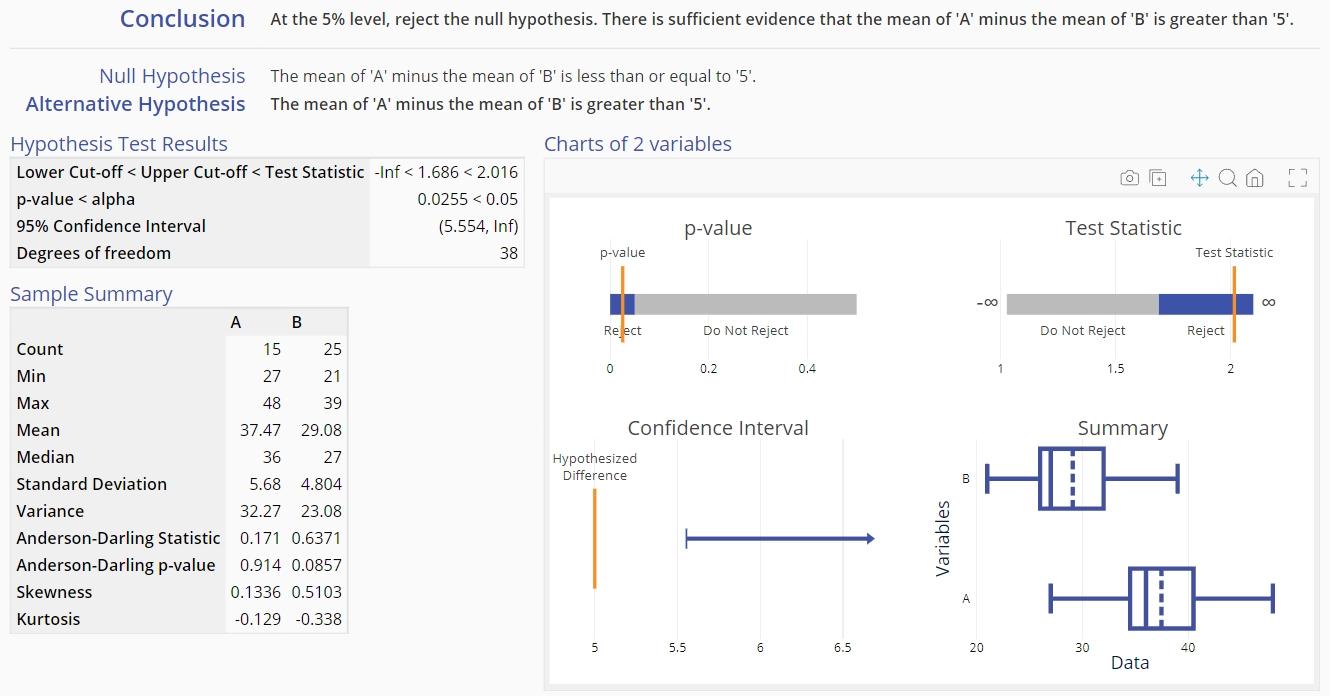
- Set up the test as before, and click Continue to see the test output, which is the same as before (since we're using the same data, only in a different format):
Notes:
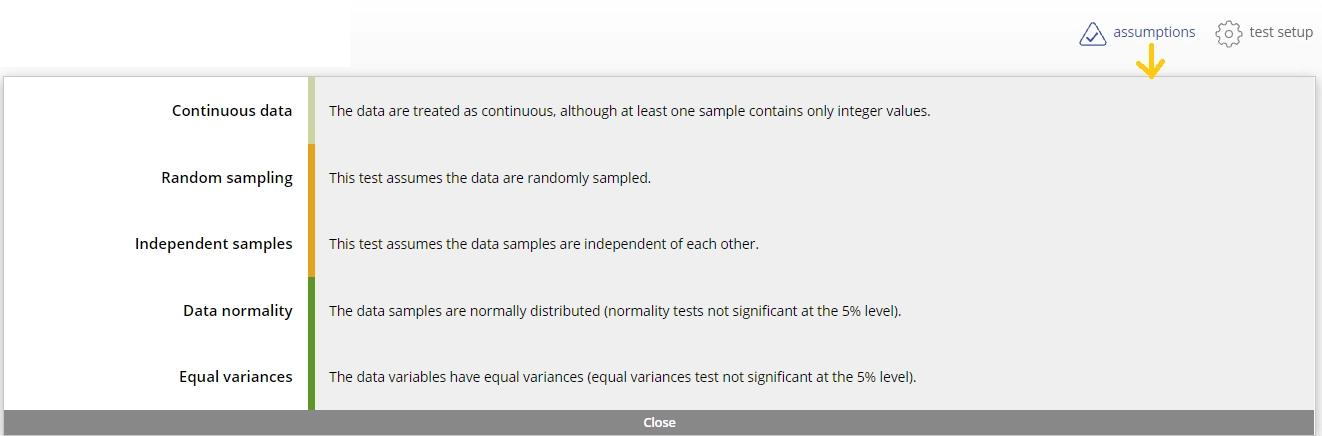
1. To see the assumptions checks, click the assumptions button at the top right of the study:
2. You can change the test settings by clicking on the test setup button, next to the assumptions button:

Summary data
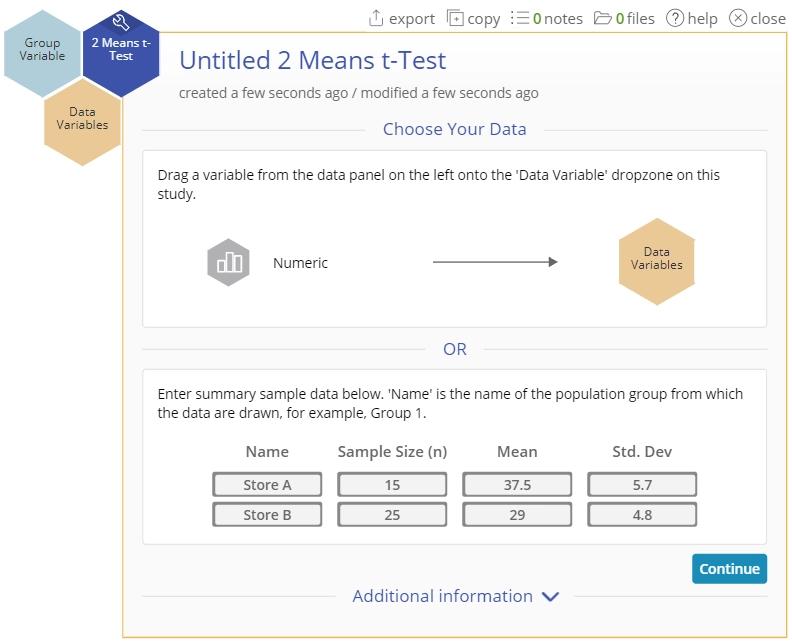
If you only have the summary statistics available for the two samples, enter them into the test setup dialog and follow the remaining steps as listed above:
The 2 Means t-Test output using summary data is the same as before (since we're using summary statistics from the same data set), except that some summary statistics are omitted from this output because it is not possible to calculate them from the summary data provided. Similarly, the boxplot graph is omitted since the actual data are not available for graphing.
2 Means t-Test Video Tutorial
Was this helpful?