
Classification and Regression Tree Tutorial
Tutorial
Coming Soon
Regression Case: Click to Download Data File
Classification Case: Click to Download Data File
When to use this tool
There are two main uses for the Classification and Regression Tree:
- Predict the output of a given set of features, or inputs
- Understand which features have the most effect on the prediction of your outputs
Use this tool when you have a large amount of categorical and continuous data and the relationship between the features/inputs and response may not be linear.
How to use this tool in EngineRoom
In general this tool performs best with larger datasets.
1. Go to the Analyze (DMAIC) menu and click on Classification and Regression Tree to open it onto the workspace.
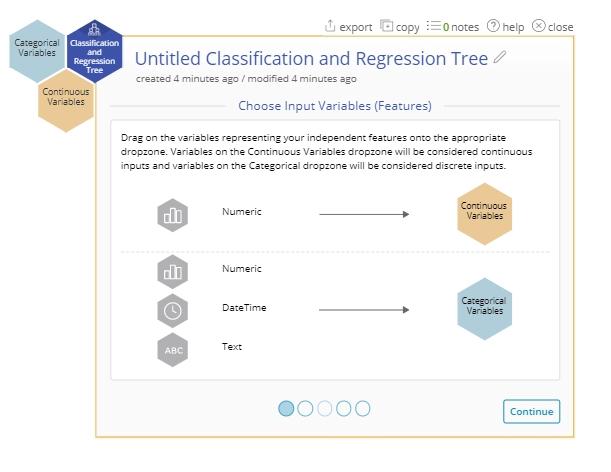
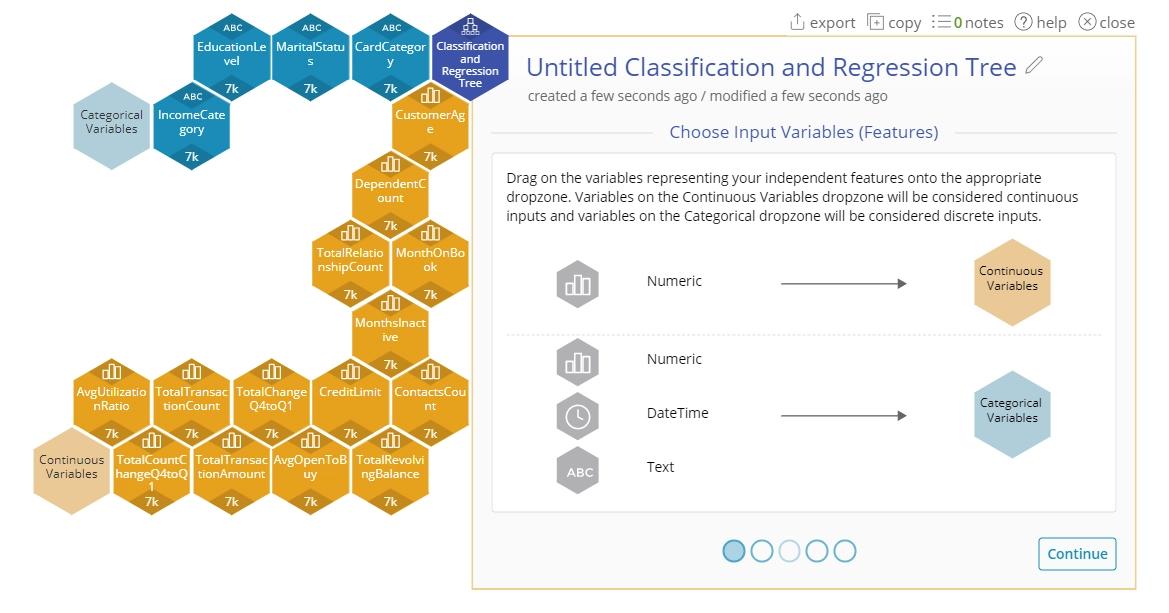
2. Drag the continuous variables on to the Continuous dropzone and drag the categorical variables on to the Categorical dropzone.
3. Click "Continue".
4. Drag on your response variable to the Response Variable dropzone.
- In General: If your response is Text, it will be considered Categorical. If the response is numeric and has more than 6 unique values, it will be considered Continuous. If there are numeric values that have fewer than 6 unique values, then it will be considered Discrete.
5. (Note: This screen may be skipped) If your data is numeric with fewer than 11 unique variables, the Type of Analysis screen will allow you to confirm whether your numeric input should be considered Continuous or Discrete. Select the appropriate value and click "Continue".
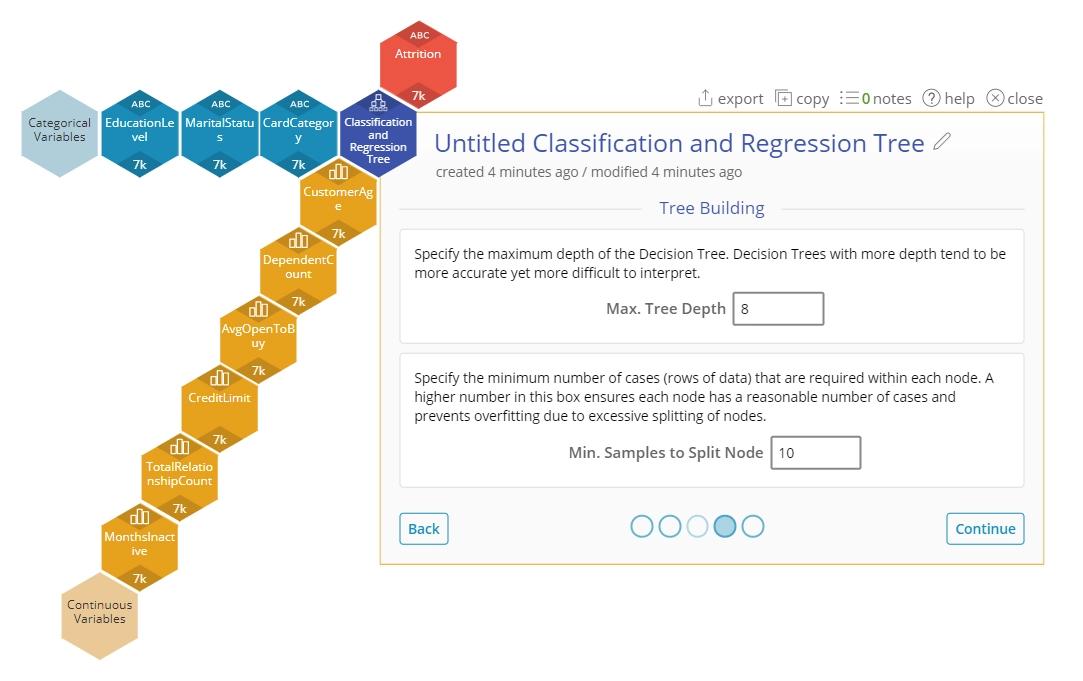
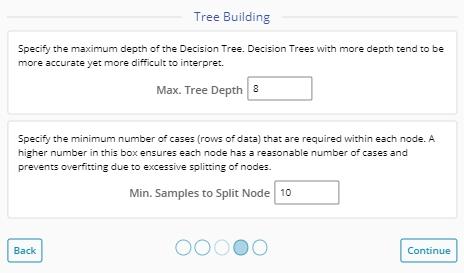
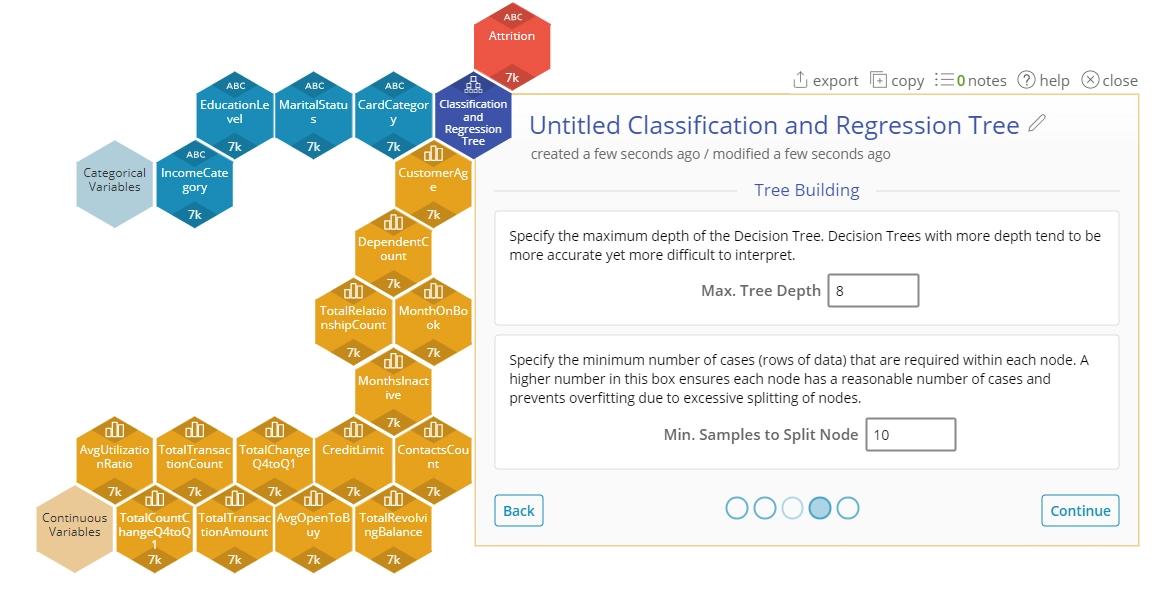
6. Select options related to how the tree should be built.
- Max. Tree Depth - indicates the maximum number of splits allowed before reaching a leaf node (terminating node)
- Min. Samples to Split Node - indicates the minimum number of observations that need to be in a resulting node to create a split. The tree will stop splitting once it reaches the maximum tree depth indicated before, even if the minimum observations in the node has not been reached.
7. Click "Continue".
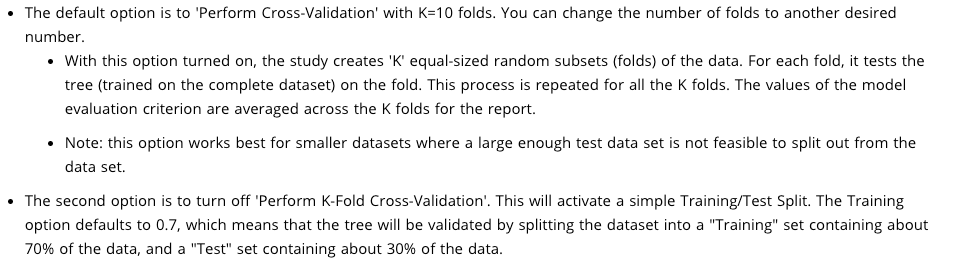
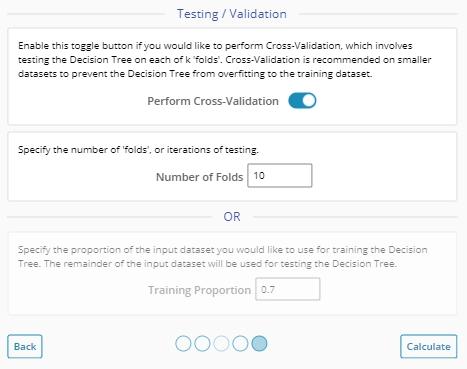
8. Select options related to the Testing of the Tree. This will give some indication on how well the tree would perform with a test/'unseen' data set.
9. Click "Continue".
10. View the results of the tree. A Discrete output will result in a "Classification" tree and a Continuous output will result in a "Regression" tree.
The Output
The output includes:
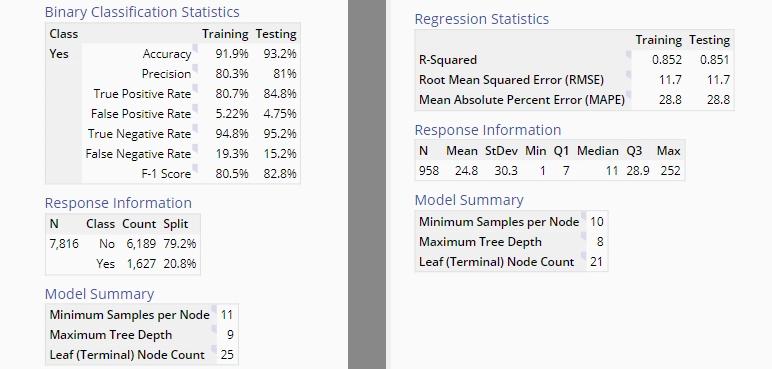
- Table Output: The tables on the left are different between the Classification and Regression Trees but the first few tables give an indication of the performance of the tree.
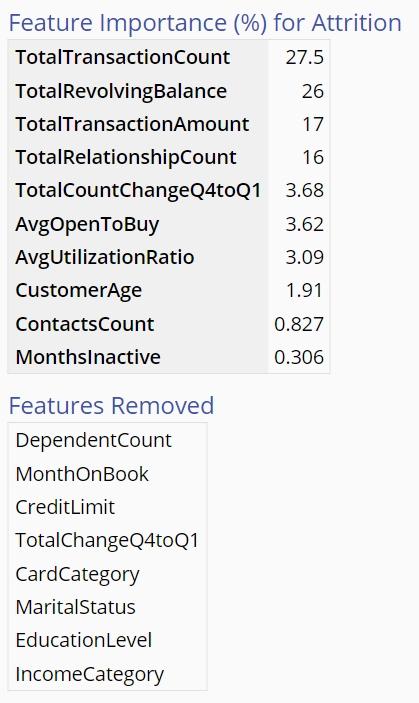
- Feature Importance: The next few tables will indicate the relative importance of certain features as well as the Features that were removed from the model because they had little to no effect.
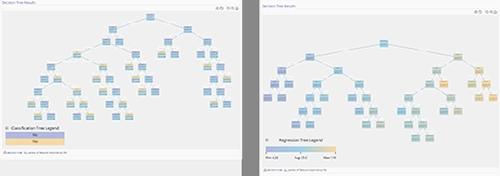
- Tree Visualization: the tree output will give indication of the results at each node. In the Regression case, the nodes are colored according to how close they are to the minimum or the maximum. In the Classification case, they are colored according to the dominant output class in that node.
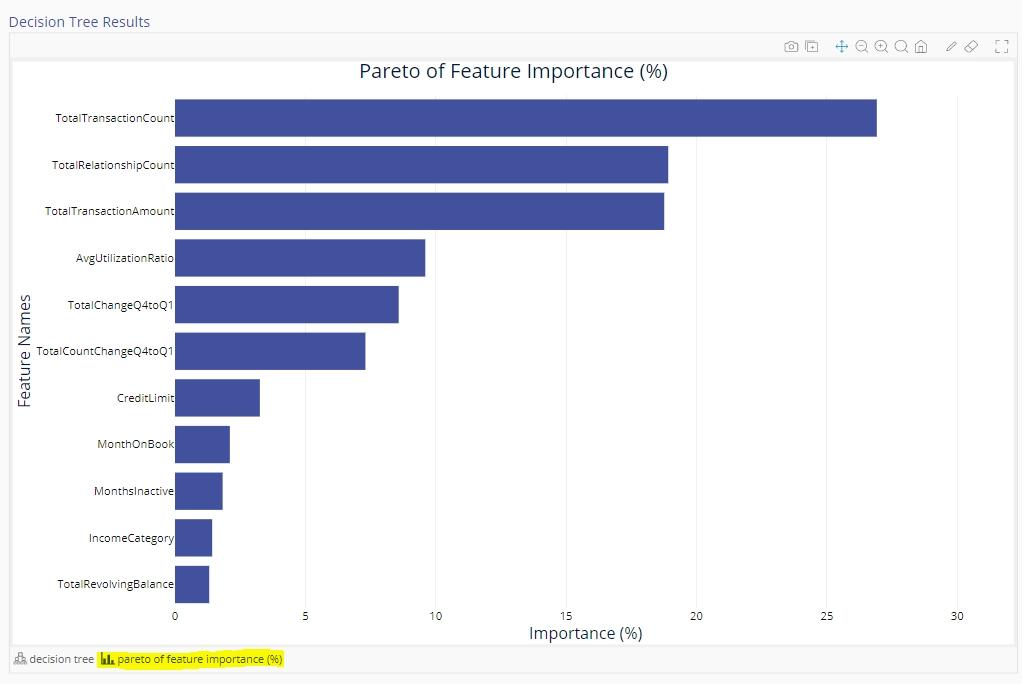
- Pareto of Feature Importance (%): This is a pareto chart that visualizes the relative impact of each feature on the tree. This is a chart representing the information in the table on the left.
Example 1: Classification Tree
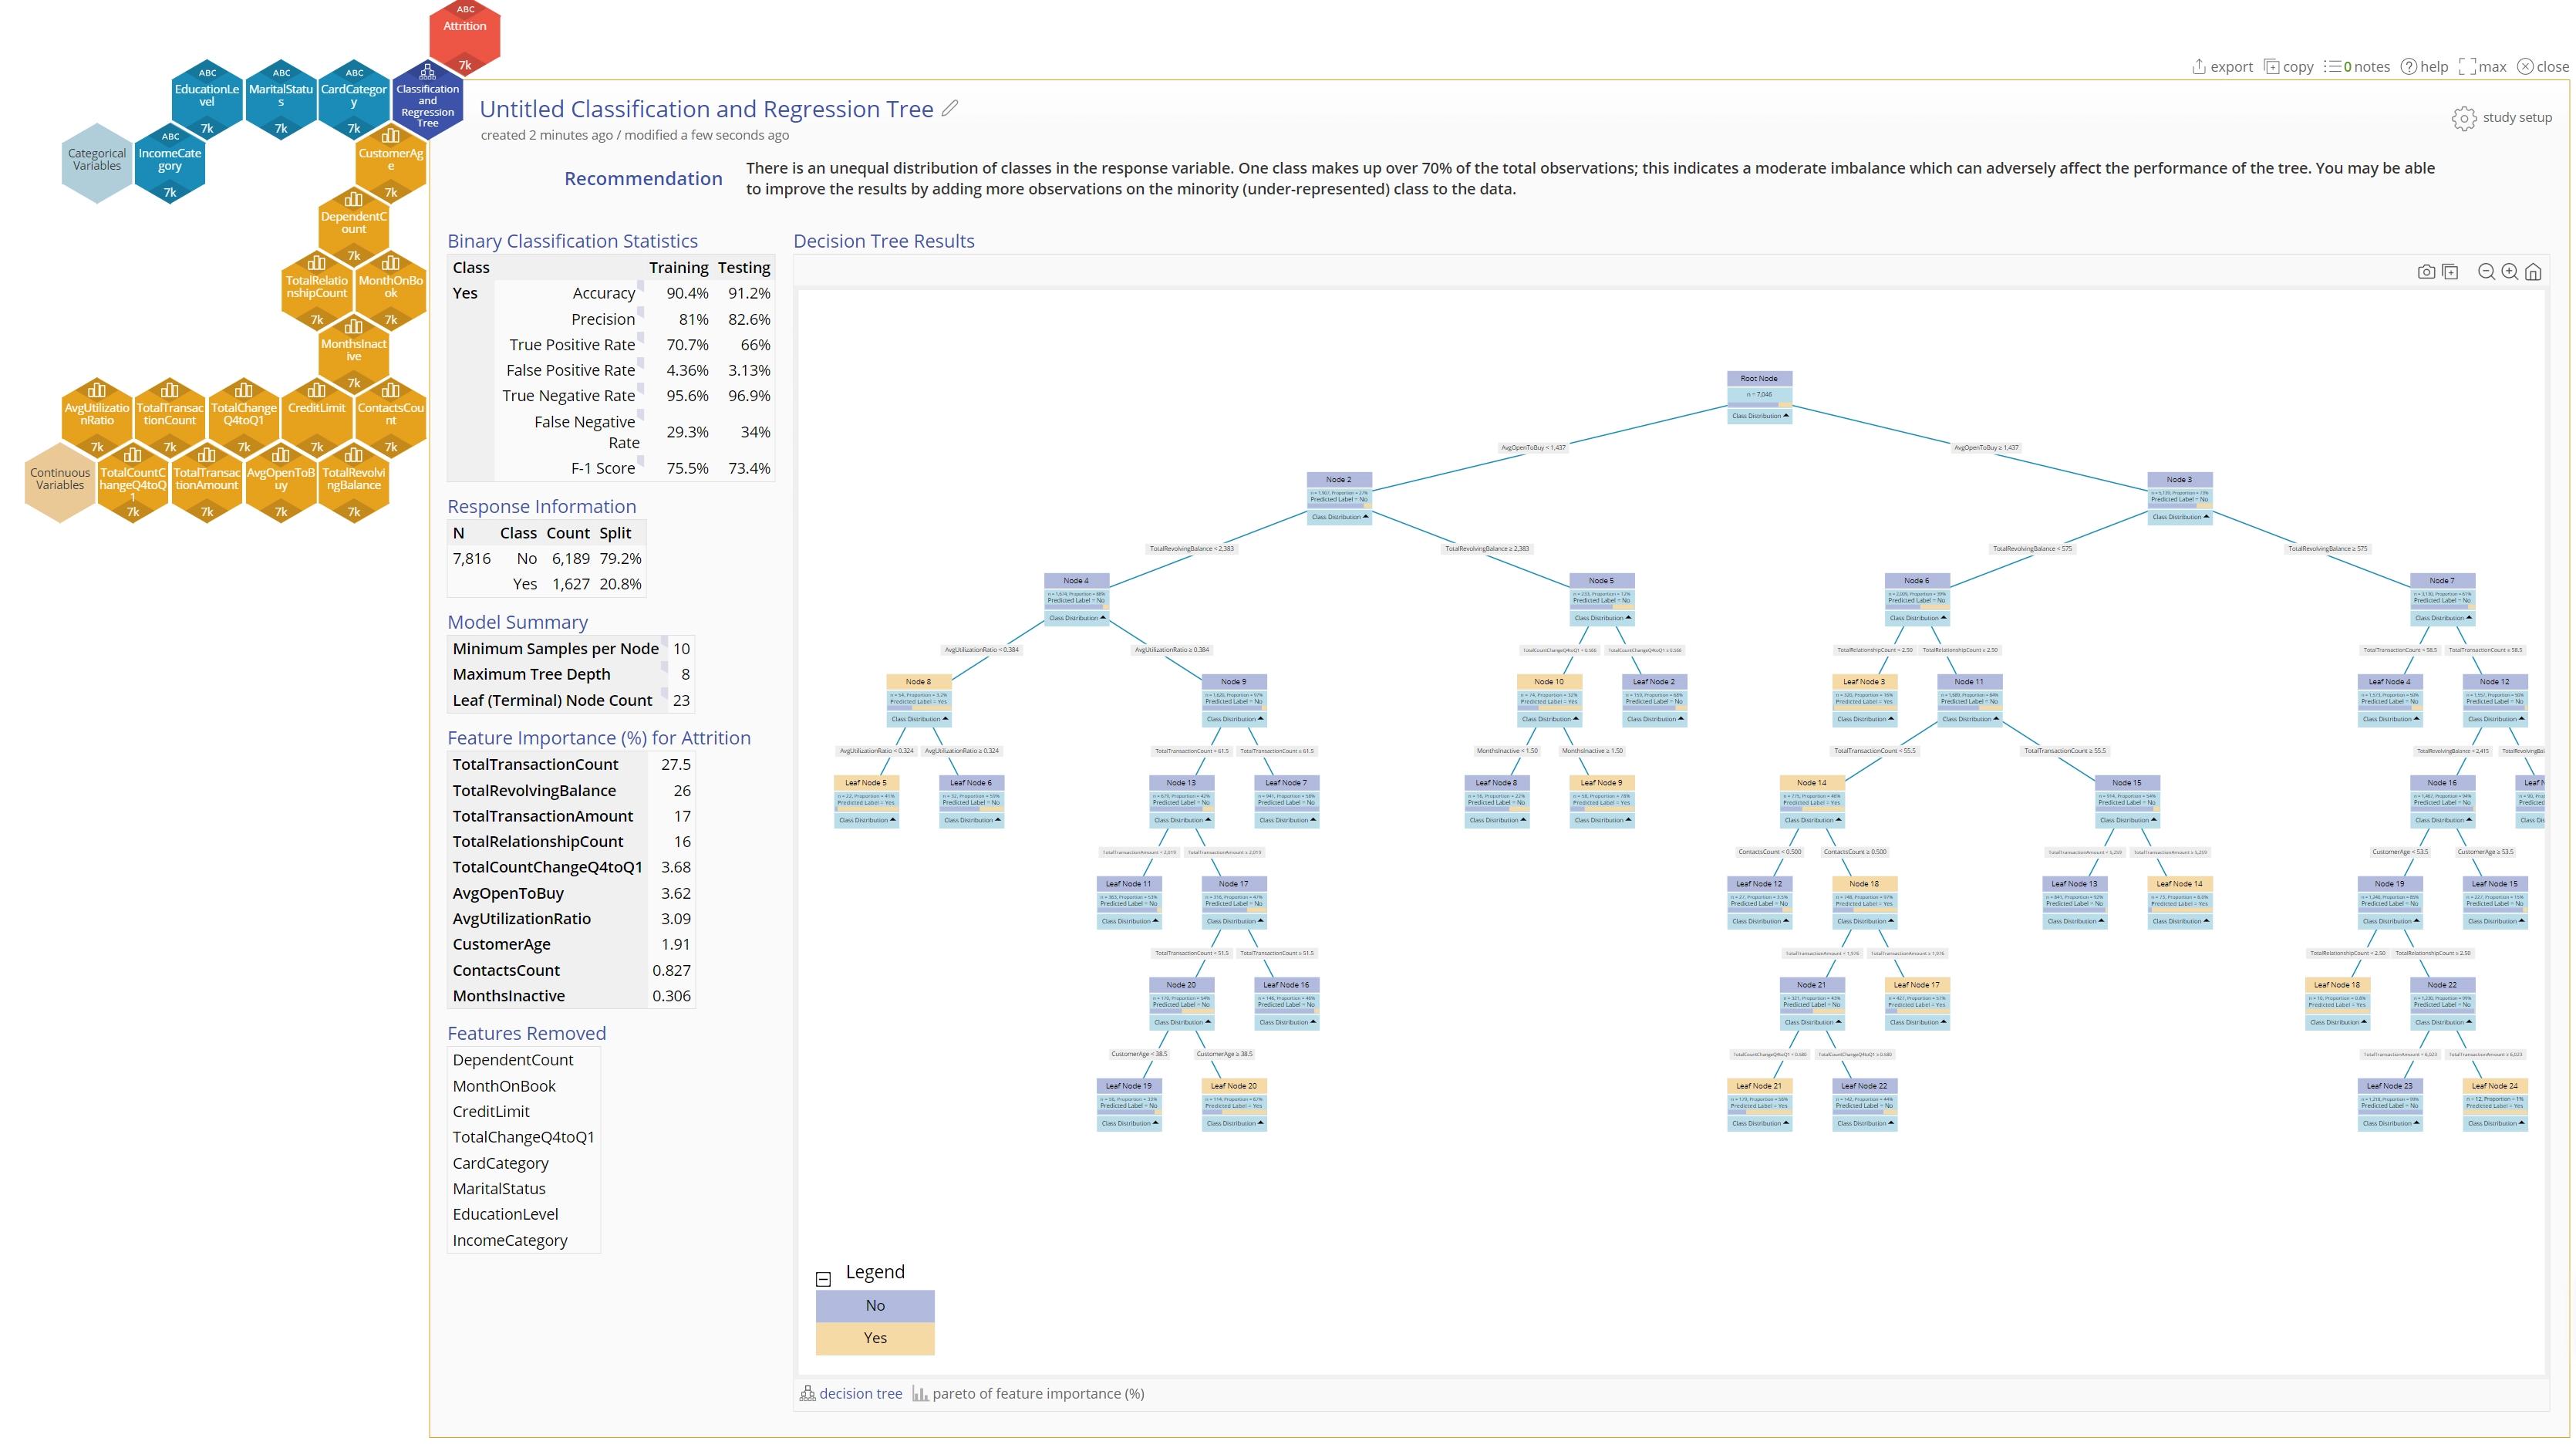
A consumer credit card company wants to better predict customers at risk of attrition (exiting the company). It has collected data from its consumer credit card portfolio, with the aim of helping analysts predict customer attrition. Develop a classification tree to help predict customer attrition with high accuracy.
- Open a Classification and Regression Tree from the Analyze menu.
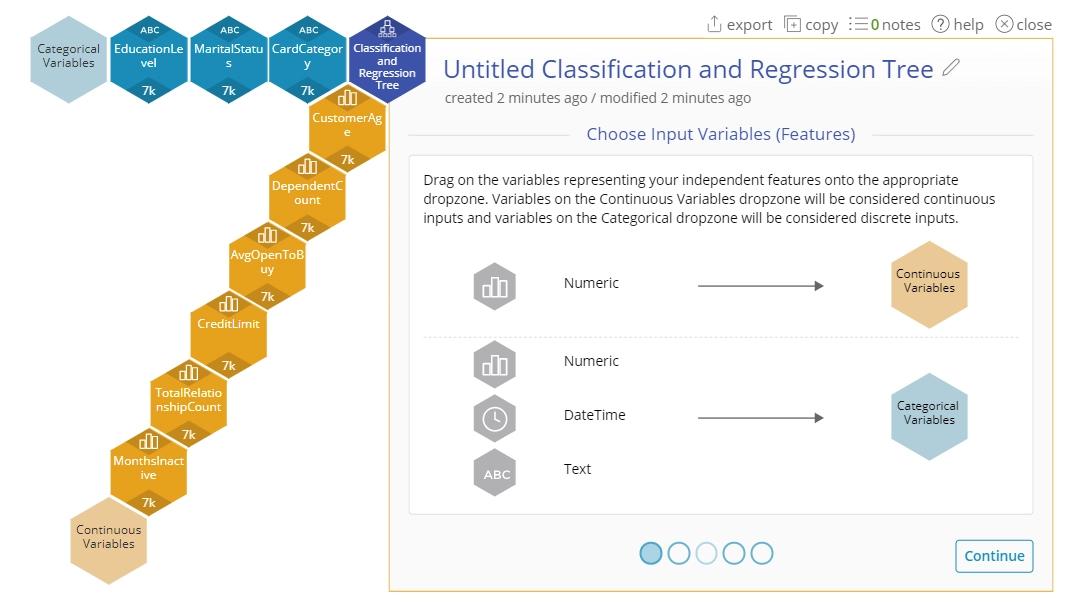
- Drag on the input variables. For this example drag on the following:
- EducationLevel - Categorical
- MaritalStatus - Categorical
- IncomeCategory - Categorical
- CardCategory - Categorical
- CustomerAge - Continuous
- DependentCount - Continuous
- MonthsOnBook - Continuous
- TotalRelationshipCount - Continuous
- MonthsInactive - Continuous
- ContactsCount - Continuous
- CreditLimit - Continuous
- TotalRevolvingBalance - Continuous
- AvgOpenToBuy - Continuous
- TotalChangeQ4toQ1 - Continuous
- TotalTransactionAmount - Continous
- TotalTransactionCount - Continuous
- TotalCountChangeQ4toQ1 - Continuous
- AvgUtilizationRatio - Continuous
3. Drag on "Attrition" onto the response variable.
4. Click "Continue"
5. We will accept the defaults so click "Continue" and then "Calculate"
6. The result will be a classification tree organizing the observations based on attrition. Note that EngineRoom provides a recommendation that indicates that there is an imbalance in the data set, which may affect the results of the tree.
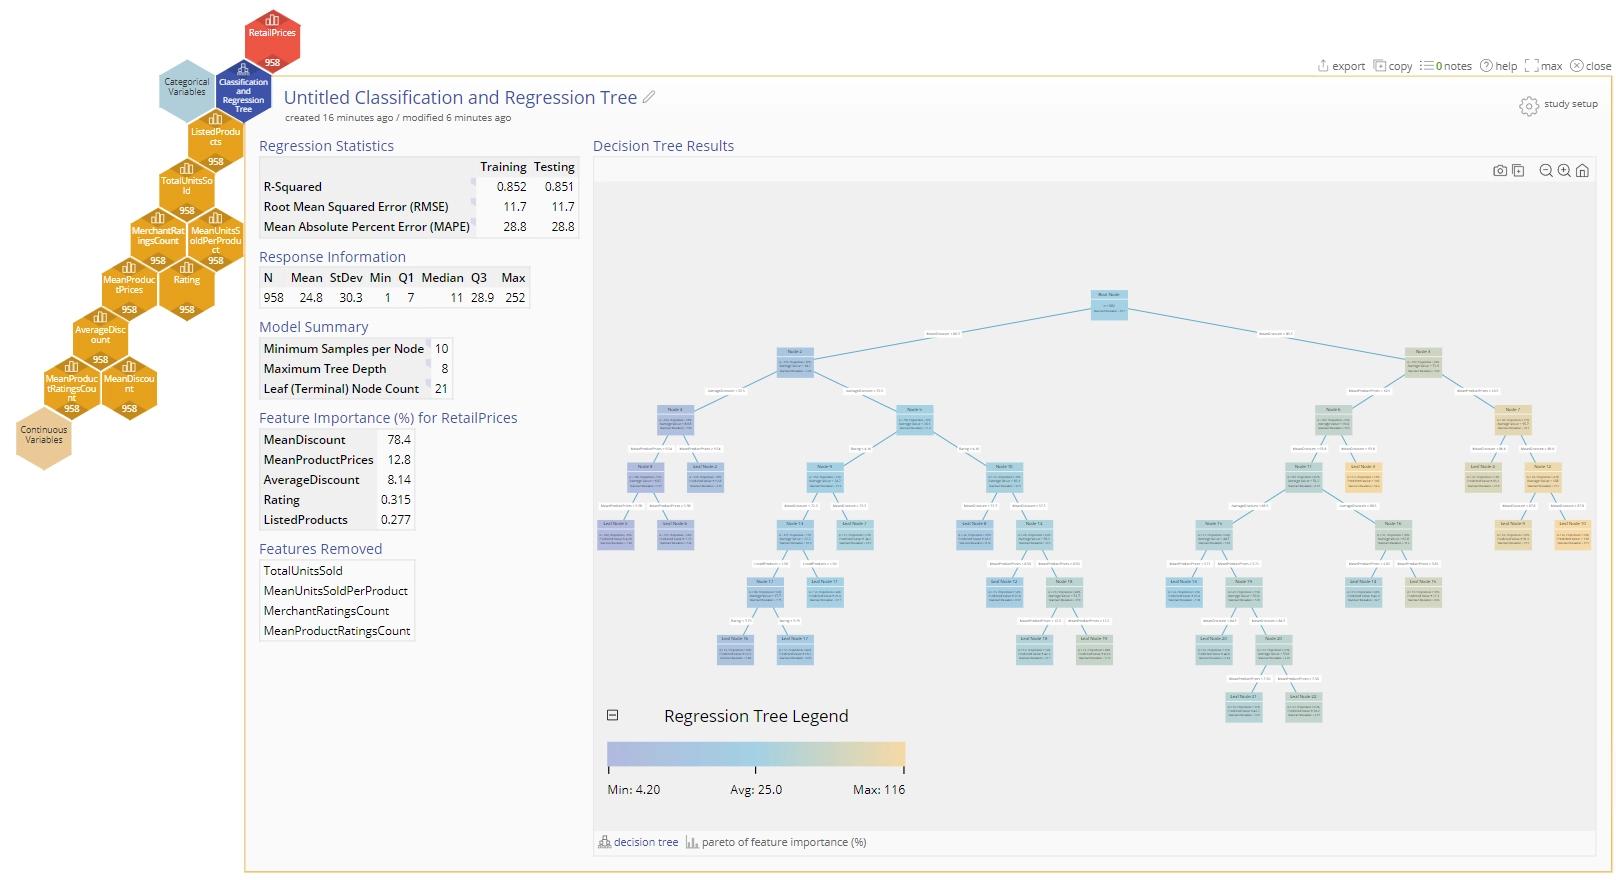
Example 2: Regression Tree
A newly introduced e-commerce platform is trying to determine the optimal retail price that it should set for it products - it has developed this dataset containing product listings, ratings, and sales performance data. Come up with a regression tree that can help inform the optimal pricing strategy for a product based on its ratings, merchant ratings count, mean discount and other metrics.
- Open a Classification and Regression Tree from the Analyze menu.
- Drag on the input variables. For this example, drag on the following variables to the Continuous Variables dropzone:
- ListedProducts
- TotalUnitsSold
- MeanUnitsSoldPerProduct
- Rating
- MerchantRatingsCount
- MeanProductPrices
- AverageDiscount
- MeanDiscount
- MeanProductRatingsCount
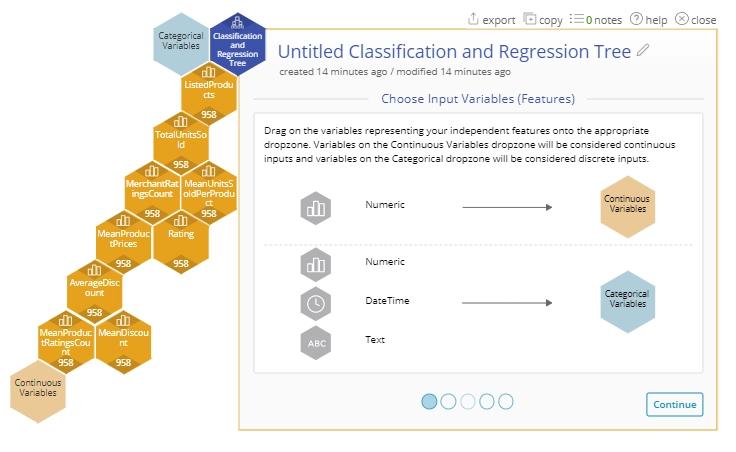
3. Click "Continue".
4. For this example, drag on "RetailPrices" to the Response Variable dropzone.
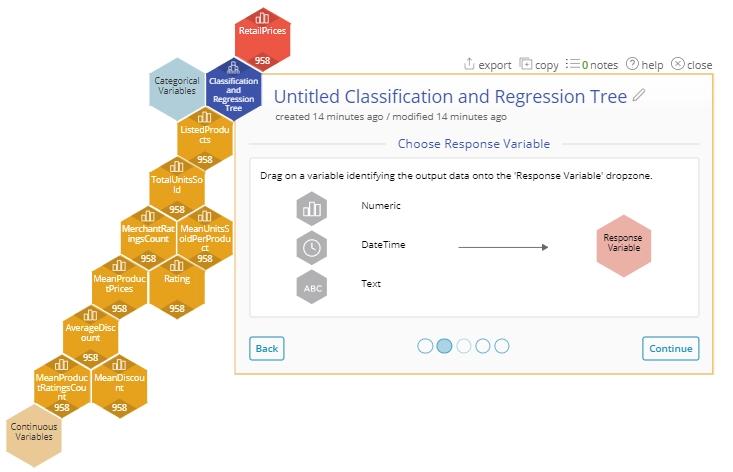
5. Click "Continue".
6. We will accept all of the defaults for options. Click "Continue" and then "Calculate".
7. The result will be a Regression tree for your results.
Note: Classification and regression tree data sets extracted from kaggle.com
Frequently Asked Questions
How does EngineRoom's C/RT decide how to split the nodes?
In the classification use case, EngineRoom’s C/RT uses Gini as the splitting criterion, and in the regression use case, EngineRoom’s C/RT uses RSS (residual sum of squares) as the splitting criterion.
Can I use a "nominal" response variable in EngineRoom?
Yes
How many input variables can I add to C/RT in EngineRoom? How many text variables? How many numeric variables?
Users can add up to 50 continuous variables (which must be numeric variables) and/or 50 categorical variables (which can be numeric, datetime, or text variables), for a total of 100 feature variables.
If EngineRoom can process 10K data observations per variable, does it mean I can have an "X" number of input variables with 10K each?
EngineRoom can process up to 50K data observations per variable. This means that EngineRoom can theoretically process 100 feature (input) variables with 50K rows each. There is technically no “hard” limit to EngineRoom’s processing capability in terms of variable size. The data limits are reached when a user’s study does not complete its execution within four minutes or a user’s computer runs out of memory while editing large datasets within EngineRoom’s data editor.
What's the maximum depth of the tree, in nodes?
The maximum tree depth in EngineRoom is 25.
What's the minimum number of cases per node? What´s the "rule of thumb"?
The minimum samples per node in EngineRoom is 5.
The minimum samples per node should be adjusted with the size of the dataset being analyzed. For example, for small datasets (less than 1,000 rows), minimum samples per node should be set to the minimum of 5. The minimum samples per node should be increased as the data size increases.
A good rule of thumb would be to increase the minimum samples per node by 5 for every factor of 10 increase in the dataset size. For example, a minimum ‘samples per node’ of 5 for a dataset of 1,000 rows, and a minimum ‘samples per node’ of 10 for a dataset of 10,000 rows. If the resulting trees tend to be overfitting, the minimum samples per node should be increased to reduce the likelihood of splits occurring. If the resulting trees are performing poorly on both the training and testing dataset, the minimum samples per node should be decreased to increase the likelihood of splits occurring.
How does "training" work for C/RT?
“Training” refers to the actual process of building a decision tree. During training, EngineRoom creates a training dataset (either the entire dataset provided by the user in the case of Cross-Validation being enabled, or a proportion of the entire dataset provided by the user) and a validation dataset. In Cross-validation, each row of the Training Dataset has an approximately 90% chance of becoming part of the "Tree Building Dataset" and a 10% chance of becoming part of the "Validation Dataset". The algorithm then builds a tree that perfectly predicts the "Tree Building Dataset", then takes this overfitted tree and prunes the tree back using the "Validation Dataset". Pruning is the process of simplifying the decision tree to the point where the tree satisfies the maximum tree depth and minimum samples per node metrics provided by the user, while also maintaining a high level of predictive accuracy on the 10% partition of the training dataset.
Can I specify the proportion of data to be used as "training data"?
Yes, in order to do this in EngineRoom, the user must disable Cross-Validation on the “Testing / Validation” slide and enter a “Training Proportion”. For example, if a Training Proportion of 0.8 is specified, EngineRoom randomly selects 80% of the provided data to be used as training data, and the other 20% of the provided data is used for evaluation (or testing). EngineRoom then builds two trees (one per growing strategy, as mentioned above) using the training dataset and returns the tree with the highest R-Squared metric when evaluated on the testing dataset (in the regression case) or the tree with the highest F1 Score when evaluated on the testing dataset (in the classification case). Why is it that I cannot select the percentage of data to be used as training?
The user can select the percentage of data to be used as training, provided that they disable Cross-Validation. This can be specified in the “Training Proportion” input box on the “Testing / Validation” C/RT study slide once the “Perform Cross-Validation” option is disabled. EngineRoom’s version of cross-validation does not allow the user to specify a training data proportion because EngineRoom’s cross-validation method trains each tree on the entire dataset.
How do I set the the number of "K-folds"? Rule of thumb?
In EngineRoom, the number of folds can be set by enabling “Perform Cross Validation” in the final "Testing / Validation" slide of the EngineRoom C/RT Wizard. The minimum number of folds is 2, and the maximum number of folds is 10.
How do the "folds" work?
When Cross-Validation is enabled, EngineRoom trains one tree for every combination of hyperparameters on the entire dataset. Currently, the only hyperparameters tuned by EngineRoom are the “growth strategy” used in building the tree. During this initial phase, one tree is built using a “local” growing strategy (each node is split independently of the other nodes) and another tree is built using a “best first global” growing strategy (the node with the best loss reduction among all the nodes of the tree is selected for splitting). EngineRoom then partitions the dataset into N folds, or splits, and evaluates each tree on each fold. In the regression case, the tree with the highest cumulative R-Squared metric across all N folds is deemed the “optimal” tree and is returned to the user. In the classification case, the tree with the highest cumulative F1 score is deemed the “optimal” tree and is returned to the user.
What are the differences between Minitab's CART® and EngineRoom´s C/RT?
They are the same basic procedure. Minitab has a registered trademark for the term "CART" in relation to statistical-analysis software. ER creates a single tree when no validation is selected. Otherwise, ER picks the ‘best’ tree when validation is used.
Minitab gives me an "optimal" tree. How can I do this in EngineRoom?
In the Cross-Validation case (taken from above):
When Cross-Validation is enabled, EngineRoom trains one tree for every combination of hyperparameters on the entire dataset. Currently, the only hyperparameters tuned by EngineRoom are the “growth strategy” used in building the tree. During this initial phase, one tree is built using a “local” growing strategy (each node is split independently of the other nodes) and another tree is built using a “best first global” growing strategy (the node with the best loss reduction among all the nodes of the tree is selected for splitting). EngineRoom then partitions the dataset into N folds, or splits, and evaluates each tree on each fold. In the regression case, the tree with the highest cumulative R-Squared metric across all N folds is deemed the “optimal” tree and is returned to the user. In the classification case, the tree with the highest cumulative F1 score is deemed the “optimal” tree and is returned to the user.
In the Training Proportion case (taken from above):
If a Training Proportion of 0.8 is specified and Cross-Validation is disabled, EngineRoom randomly selects 80% of the provided data to be used as training data, and the other 20% of the provided data is used for evaluation (or testing). EngineRoom then builds two trees (one per growing strategy, as mentioned above) using the training dataset and returns the tree with the highest R-Squared metric when evaluated on the testing dataset (in the regression case) or the tree with the highest F1 Score when evaluated on the testing dataset (in the classification case).
Was this helpful?