
Fishbone Diagram Tutorial
Fishbone Diagram Tutorial
When to use this tool
The Cause & Effect, or Fishbone Diagram was first used by Dr. Kaoru Ishikawa of the University of Tokyo in 1943 - hence its frequent reference as a "Ishikawa Diagram". This diagram is used to identify all of the contributing root causes likely to be causing a problem. This methodology can be used on any type of problem, and can be tailored by the user to fit the circumstances. It is usually used in the Analyze phase of the Six Sigma DMAIC process to understand the sources of process variability.
Use of this tool has several benefits to process improvement teams:
- Involves the workforce in problem resolution - preparation of the Fishbone Diagram provides an education to the whole team.
- Organizes discussion to stay focused on the current issues.
- Promotes "System Thinking" through visual linkages.
- Prioritizes further analysis and corrective actions.
How to use this tool in EngineRoom
1. Select “Fishbone Diagram” from the Analyze menu at the top of the EngineRoom screen. The new study will open in the EngineRoom workspace.
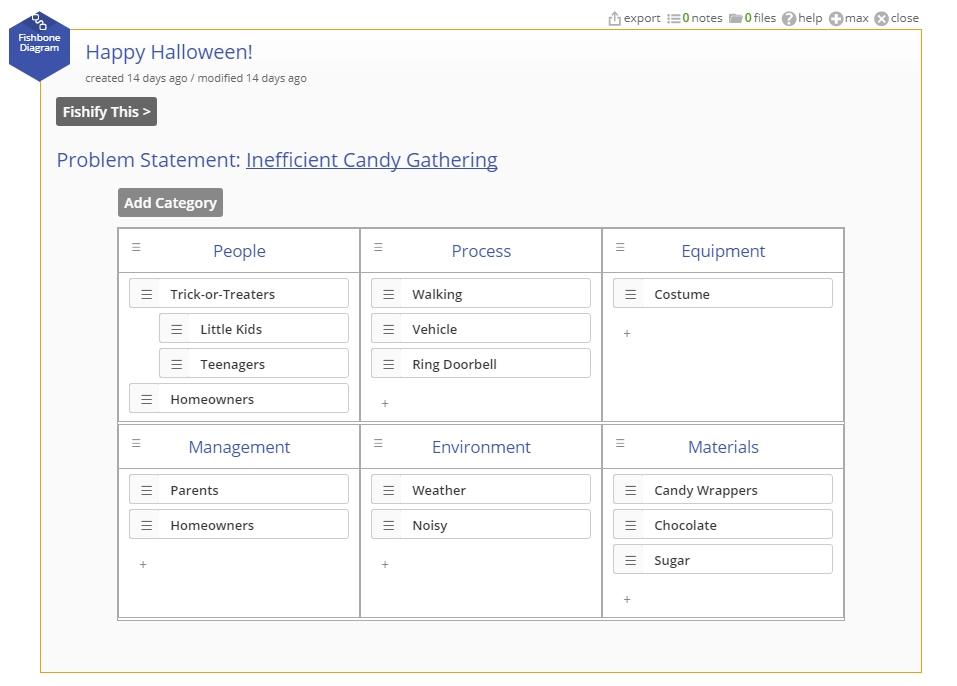
2. There is an Edit View and a Diagram View. You can switch easily between the two views with the top button (“Fishify This”).


3. Start by entering your main theme, idea or problem statement in the space next to “Problem Statement” in the Edit View.
4. This Fishbone Diagram allows three levels of hierarchy for your data: the Category, the Bone, and the Sub-Bone.

5. Each category represents a main bone on the fishbone diagram.
- Editing: You can edit the titles of the categories by clicking on the category title.
- Reordering: Categories can be reordered by dragging the icon in the upper left corner of the category.
- Add Categories: Add additional categories with the “Add Category” button
- Delete Categories: Delete categories by hovering over the category and clicking the “X” in the upper right corner. (Note: A Category cannot be deleted unless all Bones inside are moved or deleted.
6. The bones inside a category can be Bones or Sub-bones.
- Adding Bones: Click on the + button inside a Category and type in the label.
- Adding Sub-Bones: Create a Bone using the plus button and type in the label. Then drag the left side icon on this Bone inward (to the right) to make it a Sub-Bone of the Bone above it. A Sub-Bone can become a Bone by dragging it out to the left (Note: If a Bone has more than one Sub-Bone, and you want to make them Bones, start dragging out from the bottom of the list.)
- Editing Bones: Click on the text on the bone to edit it.
- Rearranging Bones: The left side icon for each Bone allows you to drag them to new categories and reorder the bones. Dragging a Bone will include all related Sub-Bones.
- Delete a Bone: Hovering over a bone will reveal an “X” to click to delete the Bone. (Note: A Bone with Sub-Bones cannot be deleted until all of its Sub-Bones are either moved or deleted.
7. Click “Fishify This” to check out your finalized Fishbone
8. Go back to editing by pressing the “Edit View” button, or export for printing using the “export” button in the top-right corner of the study.
The Fishbone Diagram can be used to populate an Input Screening Report.
A final Fishbone Diagram example is shown below:

Was this helpful?