
Gauge R&R (Nested/Destructive)
When to use this tool
The regular (or Crossed) Gauge R&R analysis is used to evaluate a measurement system when every operator measures the same set of parts multiple times. When parts are destroyed or otherwise modified during measurement, however, or when each operator must measure a different set of parts due to small batch sizes or some other reason, the Gauge R&R (Nested/Destructive) analysis is more appropriate because it correctly accounts for the nesting of the parts within operators.
Gauge R&R (Nested/Destructive) differentiates the measurement variation due to the different sources: the operators doing the measuring, the parts or process units nested within operators, and the variation in repeated measurements taken using the same gauge. Note that for the repeatability calculations in the nested situation, the measurements of different parts in subsequent trials count as 'repeated' because the parts are assumed to be similar (homogenous) enough in the measured characteristic so as to be essentially considered the same part.
Using EngineRoom
Note: the demonstration below has the Guided Mode disabled, so it combines some steps in one dialog box. You can enable or disable Guided Mode from the User menu on the top right of the EngineRoom workspace.
To use the tool, in the DMAIC menu select Measure > Measurement System Analysis (MSA)... > Gauge R&R (Nested/Destructive). The study opens on the workspace:

There are three hexagons or 'drop zones' attached to the study:
- Part Number Variable (required): A numeric or text variable containing the part identifiers/numbers.
- Appraiser Name Variable (required): A numeric or text variable identifying the appraiser/operator names.
- Measurement Variable (required): A numeric variable containing the measurement data from the study.
Example:
In our example, the hardness of plastic parts for prosthetics are to be tested by indentation and a score assigned on a scale of 0-100. Since the parts are modified by the indentation test, no part can be tested twice. Additionally, the parts are produced in small lots. For the study, 5 lots are selected at random from the entire range of the operating process. From each lot, 6 parts are randomly selected and 2 parts assigned to each appraiser. The parts from each lot are assumed to be similar (homogenous) enough in hardness that they can be considered identical.
Upload the data set provided, with three column of data: Parts (containing the part numbers), Appraiser (containing the names of the three appraiser) and Measurement (containing the measurement data). The 2 parts tested by each appraiser from each lot are numbered the same, representing two 'trials'.

Steps:
1. Go to Measure > Measurement System Analysis (MSA) in the DMAIC menu and open the Gauge R&R (Nested/Destructive) tool onto the workspace.
2. Navigate to the data source and drag Measurement onto the Measurement Variable hexagon.
3. Drag Appraiser onto the Appraiser Name Variable hexagon.
4. Click on the data source and drag Part onto the Part Number Variable hexagon.
5. Customize the study options to your requirements (all are optional):
- Enter a lower specification limit and/or
- Enter an upper specification limit For this example enter the lower specification limit as 32 and the upper specification limit as 42.
- You can instead enter the tolerance range (upper minus lower specification) as 10 (=42-32).
- Enter a historical standard deviation if you know it
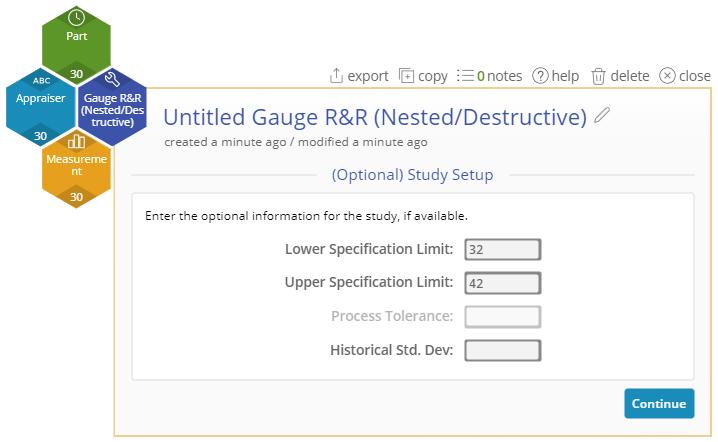
6. Click Continue.
Results:
The Gauge R&R output includes graphical and numeric output:
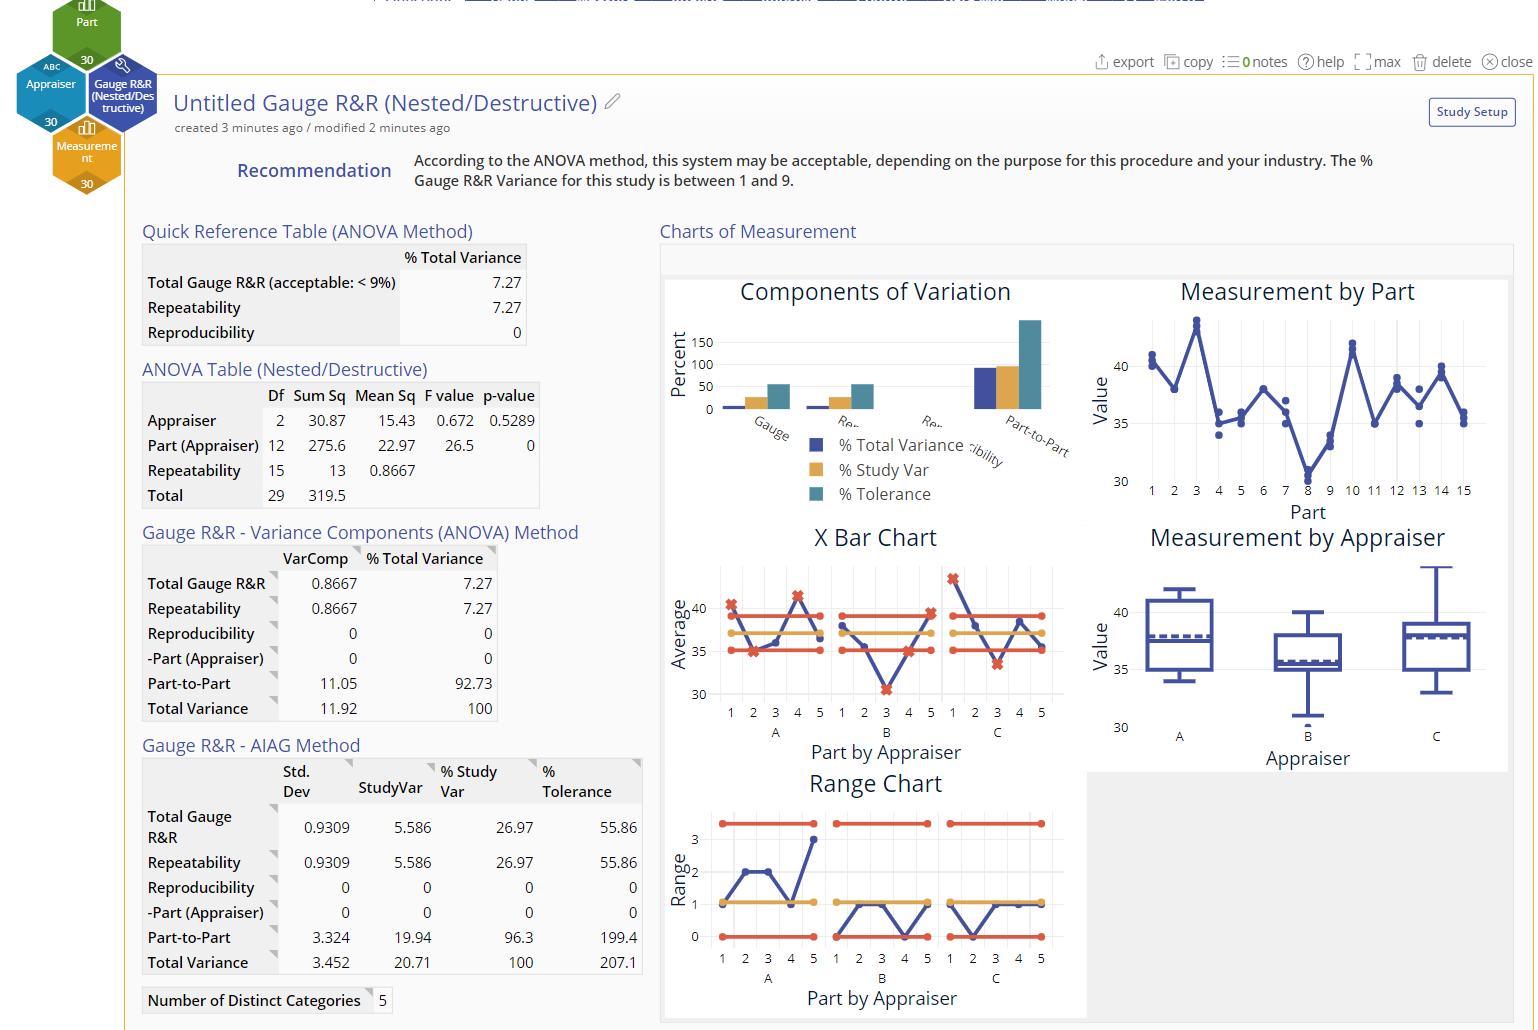
1. The recommendation statement summarizes the key findings of the analysis which are also displayed in the Quick Reference Table.
2. The graphical output contains:
- Components of Variation bar chart showing the relative contributions of variation from each of the sources studied
- Xbar Chart (you want to see at least 50% of the points falling outside the control limits on this chart)
- Range Chart (you want to see points falling within the control limits on this chart)
- Data by Parts chart - variation among trials for a part should be smaller than variation between parts
- Data by Appraisers chart - shows the center and spread of the measurements made by each appraiser
- Note that there is no Parts by Appraisers Interaction Chart, since the parts were nested within appraisers, so that no two appraisers saw the same parts.
3. The numeric output contains:
- The ANOVA Table showing the F-tests corresponding to the sources: Appraisers, and Parts nested within Appraisers.
- The Gauge R&R table for the Variance components output.
- The Gauge R&R - AIAG method table which takes ratios of the study variances and shows their amounts relative to the total study variation and Tolerance.
Note:
- The %Tolerance column is displayed only if you entered at least one specification limit value or a tolerance value in the study setup dialog.
- Entering an historical standard deviation value in the setup creates an additional column in the Gauge R&R table called %Process.
Gauge R&R (Nested/Destructive) Video Tutorial
Coming Soon
Instructor Resources
Was this helpful?