
Logistic Regression Analysis Tutorial
Tutorial
When to use this tool
Use Logistic Regression Analysis to model the relationship between a binary (e.g. '1/0' or 'Yes/No') dependent or output variable and a set of continuous or categorical independent or input variables. The tool helps model or predict a binary response variable from a set of independent or input variables. The response variable in this is assumed to have a normal distribution. e has a binomial distribution (as opposed to a normal distribution assumed in multiple regression), so this approach applies a linear model to the logarithm of the odds of an event, rather than to the response variable itself, which is typically in the form of Event=1, Non-event=0 or expressed as counts of events among opportunities.
The Logistic Regression Analysis output includes:
- A table summarizing the binary response variable
- The fitted model
- The log likelihood of the fitted model
- Estimated coefficients of the response model
- Summary of various tests of model fit
- Table showing the multicollinearity statistics corresponding to model variables
- diagnostic plots/graphs: Delta Chi-square vs. Estimated Proportions, Delta Deviance vs. Estimated Proportions and Delta Beta vs. Estimated Proportions
Logistic Regression Analysis models the data using a linear equation of the form:
where
- Logit(Y) = the log of the odds of the responseevent. Odds is simply the ratio of the probability of the event occurring over the probability of the event not occurring
- Y = the output or response variable, taking values 0 or 1
- a = the constant term (value of Y when all inputs are set to zero)
- X1, X2, .…Xk = the inputs or predictor variables. While Y is assumed to be continuous, the X inputs can be continuous or categorical.
- b1, b2, ...bk = the partial regression coefficients corresponding to the inputs
- e = the error or unexplained variance
In simpler terms, the Logistic Regression Analysis equation is:
Log-odds (Y) = constant + coefficient1 (input1) + coefficient2(input2) + ..... + coefficientk(inputk) + error
How to use this tool in EngineRoom
Raw Data Example
If you have raw data, your worksheet should look like this:
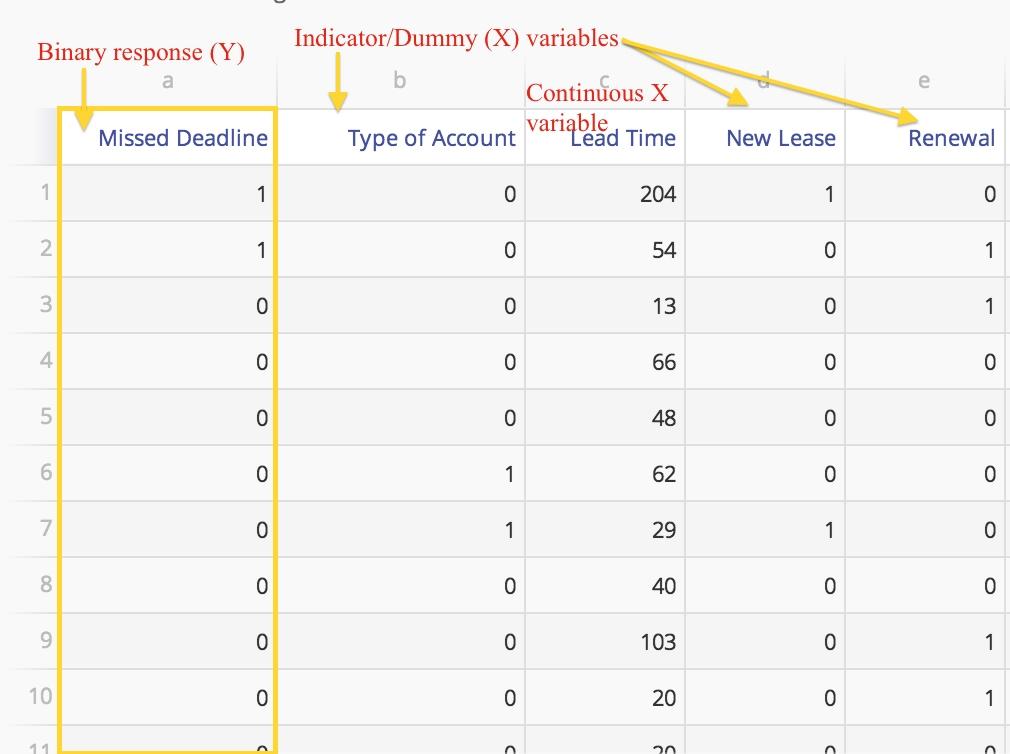
To analyze raw data, go to Analyze > Regression Analysis > Drag the Logistic Regression tool on to the workspace > Drag the binary (can be numeric or text) response variable into the Response Variable drop zone > Drag the independent variables into the Independent Variables drop zone. Enter the desired significance level (default is 0.05) and click the 'Update' button.
The independent variables may be numeric (assumed continuous), binary (binary variables can be formatted as numeric or text) or multinomial (several nominal levels) or ordinal in nature. Categorical independent variables with multiple levels must be converted to indicator/dummy variables before running the analysis.
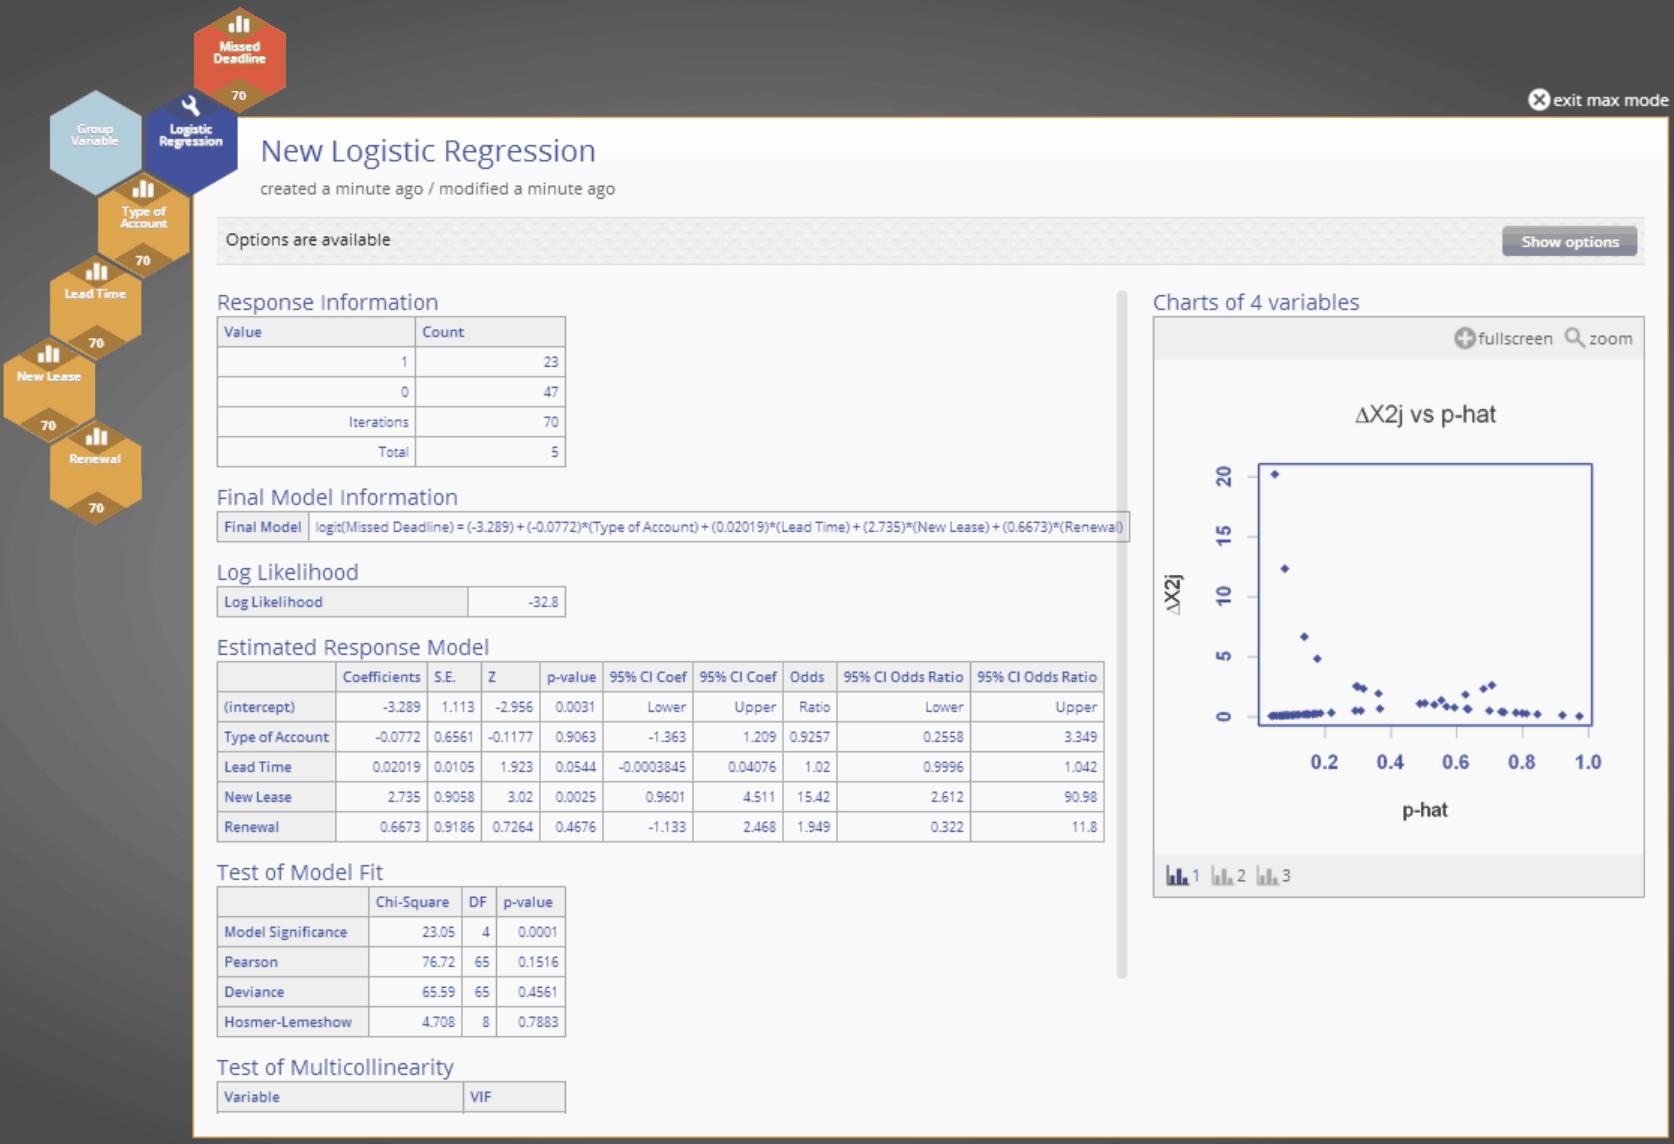
The Logistic Regression Analysis output (using raw data) is shown below:
Grouped Data Example
If you have grouped data, your worksheet should look like this:
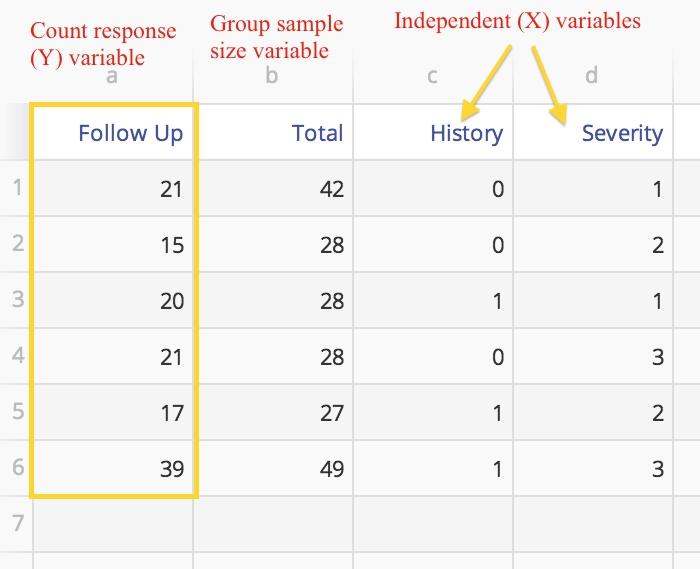
To analyze raw data, go to Analyze > Regression Analysis > Drag the Logistic Regression tool on to the workspace > Drag the response variable that is in the form of counts or frequencies (numeric) onto the Response Variable drop zone > Drag the variable containing the sample or subgroup sizes on to the Group variable drop zone > Drag the independent variables into the Independent Variables drop zone. Enter the desired significance level (default is 0.05) and click the 'Update' button.
The independent variables may be numeric (assumed continuous) or categorical. Categorical X variables may be binary (can be formatted as numeric or text) or multinomial (several nominal levels, like ‘red, blue and white’) or ordinal (‘low, medium, high’). Categorical X variables with multiple nominal levels must be converted to indicator/dummy variables before running the analysis.
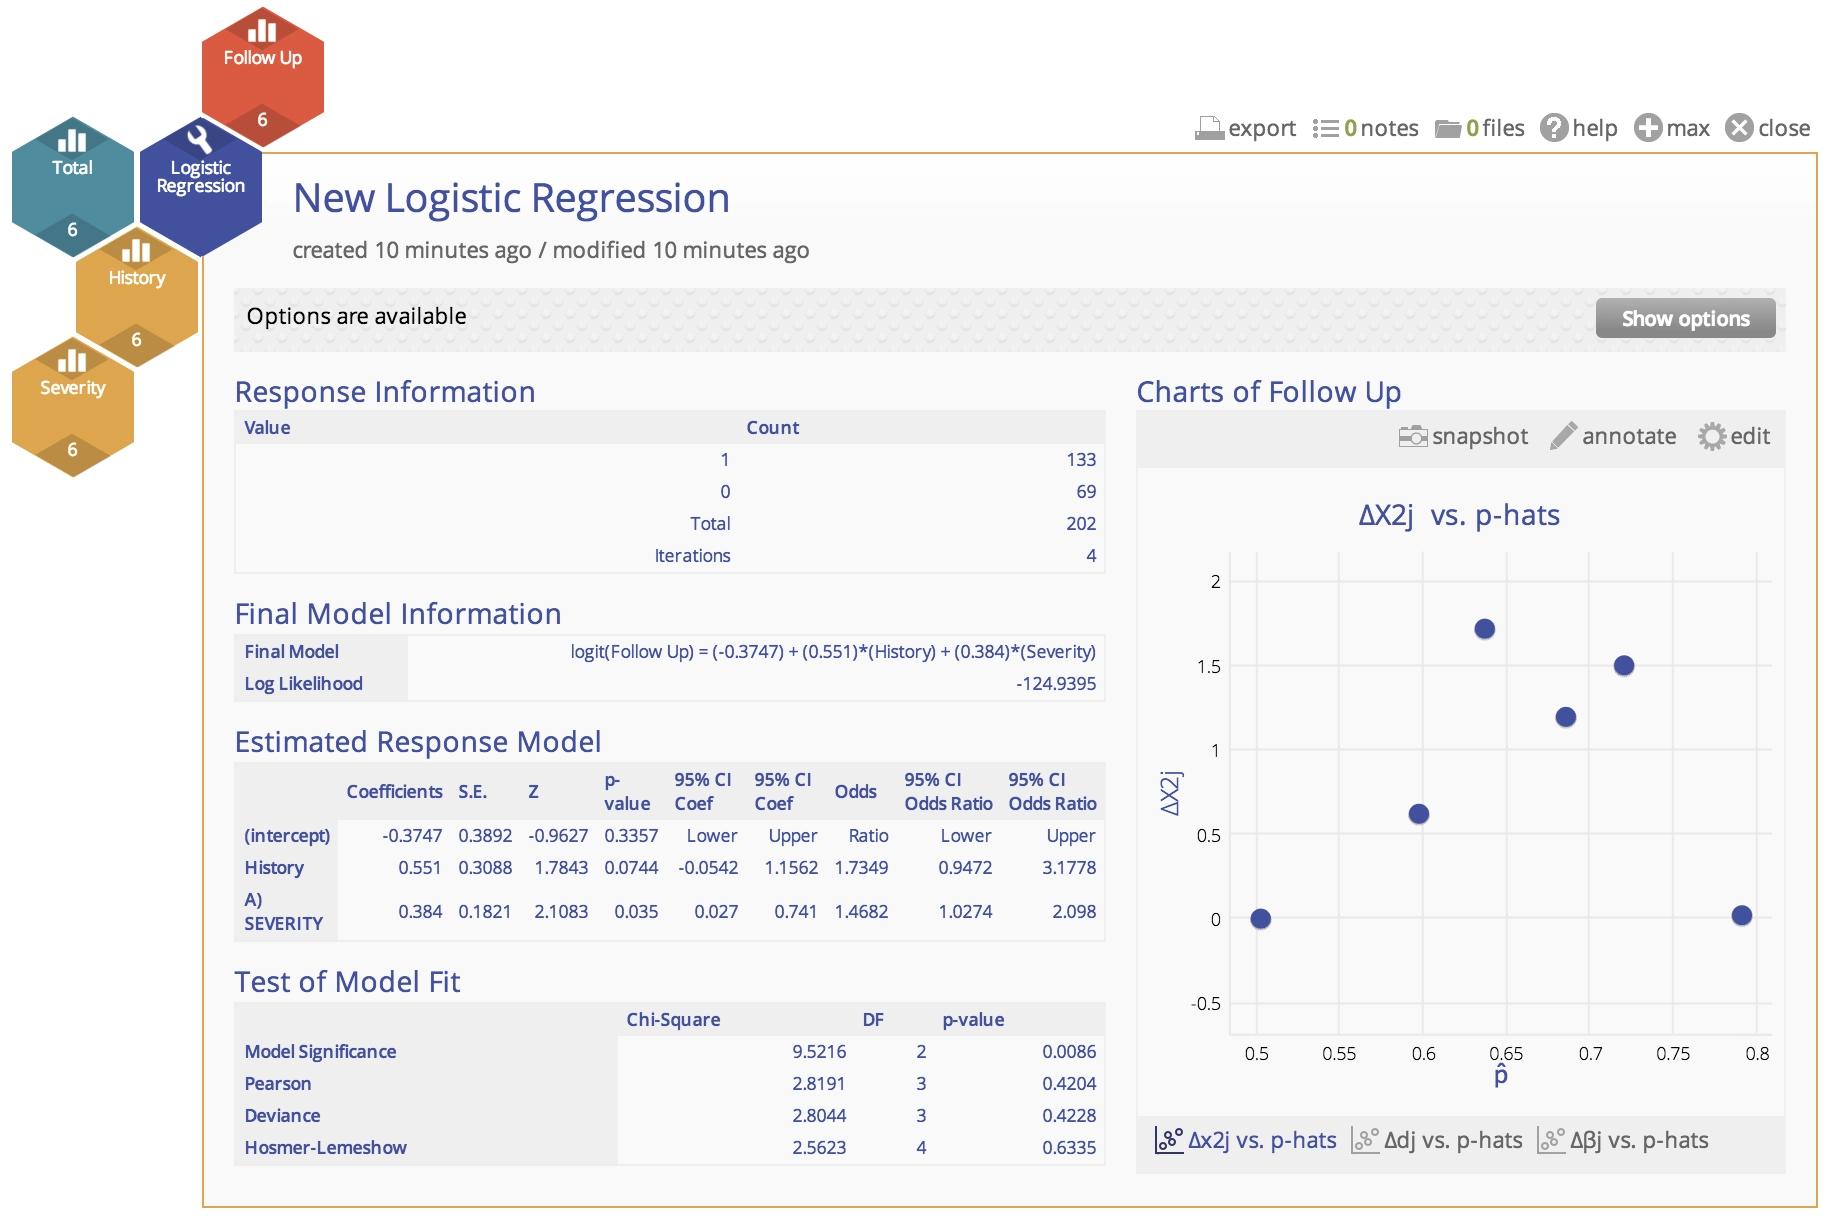
The Logistic Regression Analysis output (using grouped data) is shown below:
Instructor Resources
Was this helpful?