
Process Flow Chart Tutorial
Tutorial
When to use this tool
Use a Process flow chart (also called flowchart or flow diagram) to create a detailed graphical representation of the sequence of activities in a process, including those related to procedures and decision-making routines. This chart shows the inputs and outputs, decision points, decision criteria, feedback loops, and delays, among other things, that affect the process and tends to be slightly more complex than a high level process map.
Constructing a chart of the process flow is typically one of the first activities of a process improvement effort.
Using EngineRoom
To use this tool:
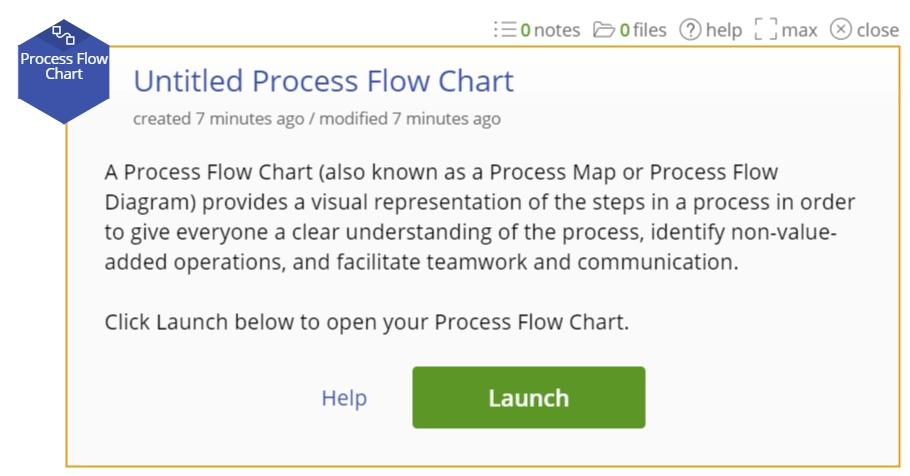
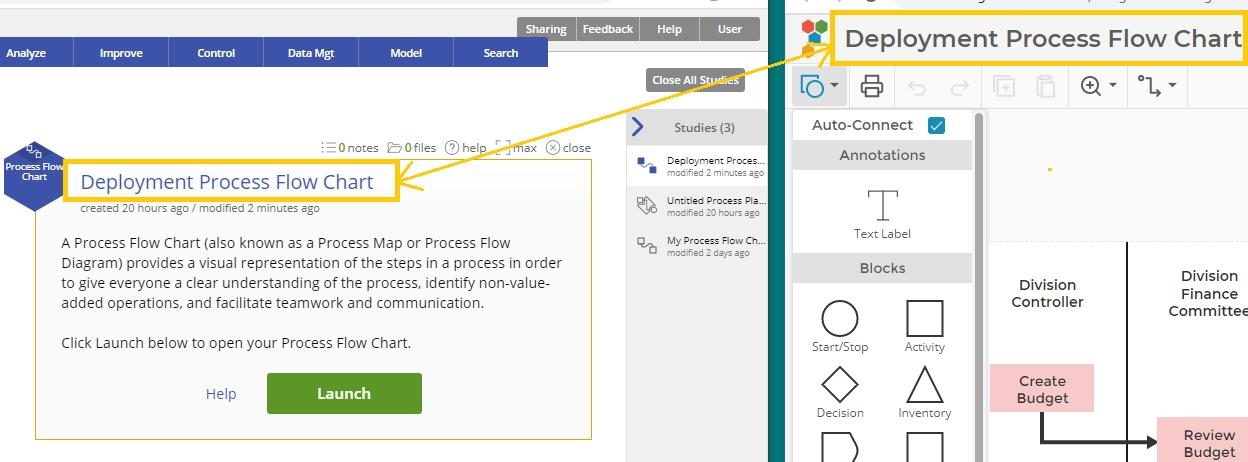
- Select the Define menu > Process Flow Chart. A study opens on the workspace, with a button to launch the flow chart workspace:
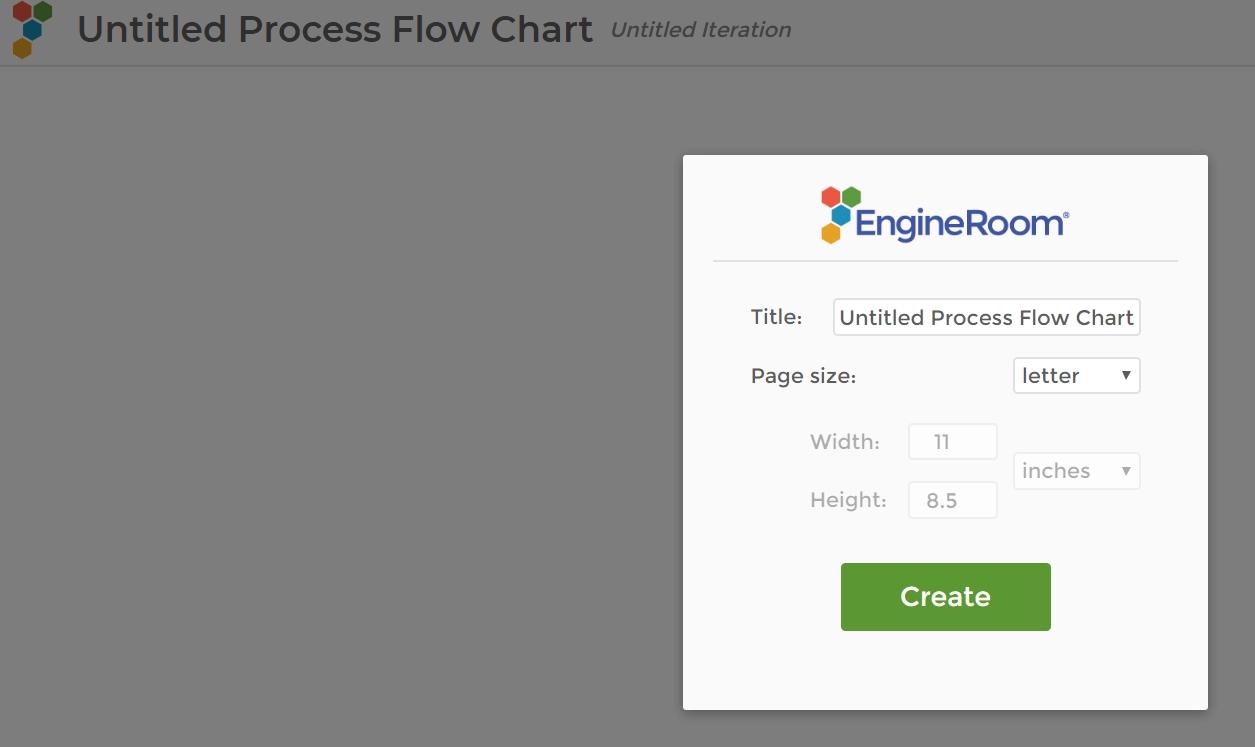
- Click on the Launch button. This opens the flow chart dialog in a separate browser tab/window:
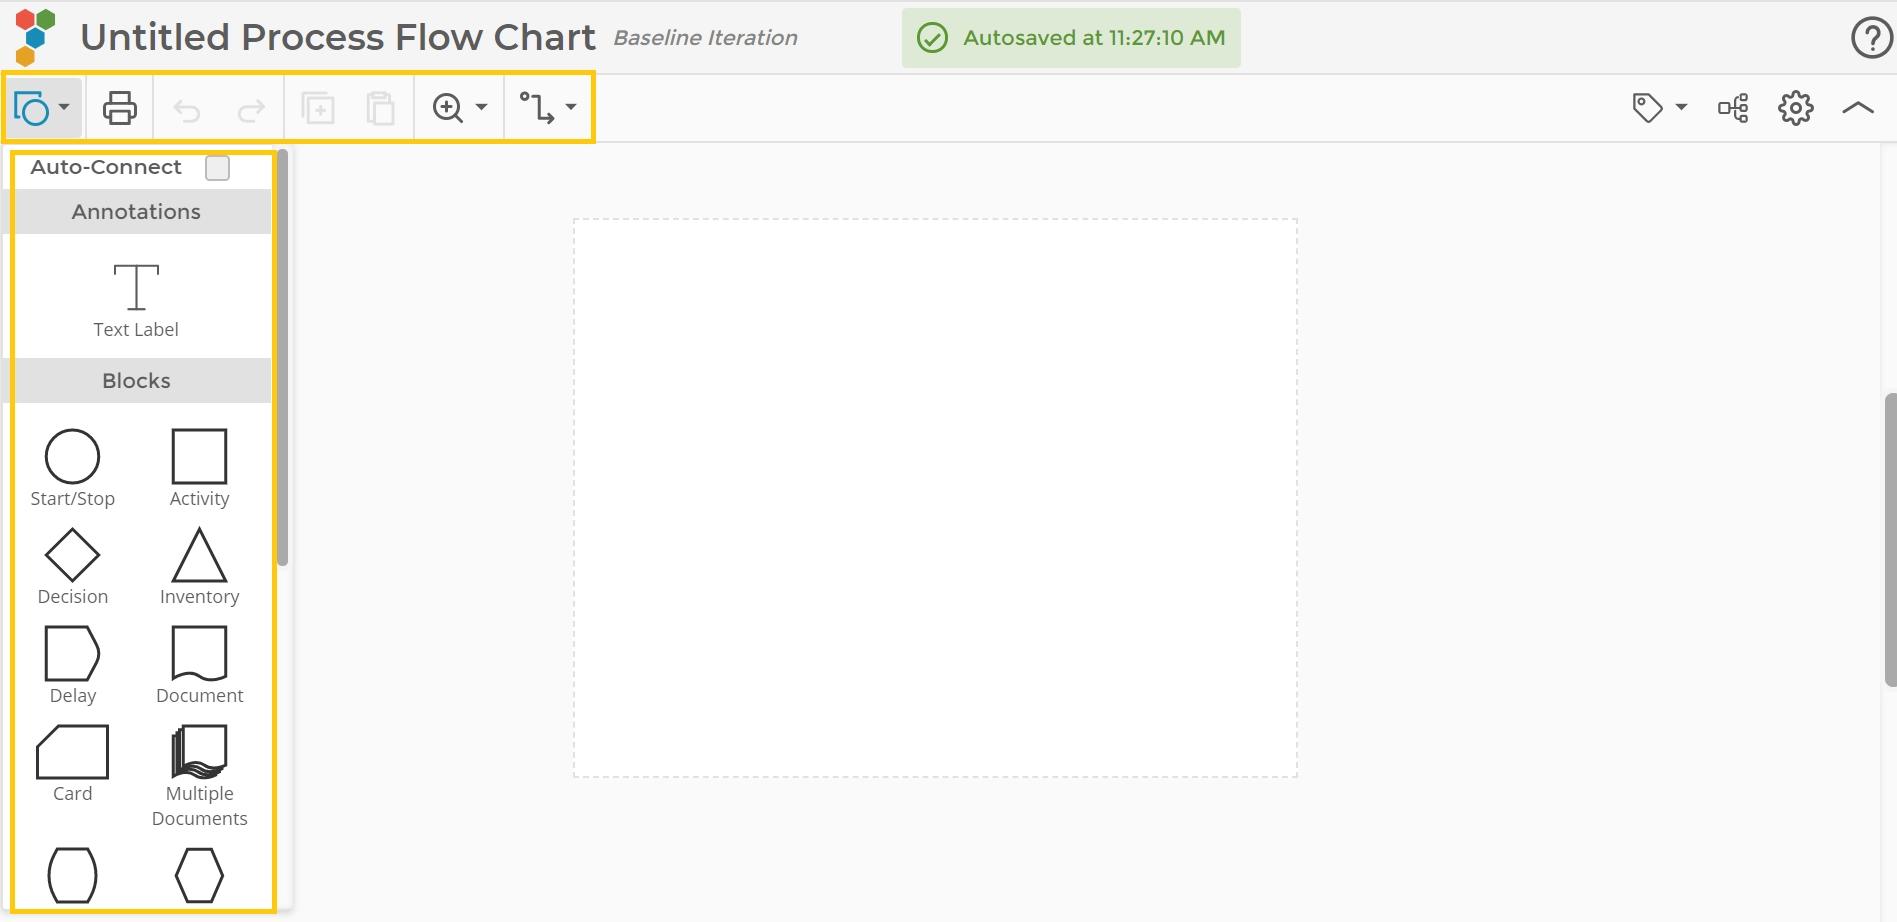
- Click on the Create button - the workspace opens, allowing for the area in which to build your map. The panel on the left provides easy access to all the diagram shapes needed to create the chart, as well as text boxes and the ability to auto-connect arrows. The taskbar on the top gives access to the editing functions like save, Undo/redo, copy/paste, zoom in, etc.:
The flow chart uses many of the shapes/objects commonly used in mapping, such as:
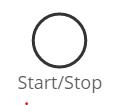
Start/Stop:
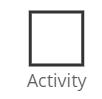
Activity:
Decision:

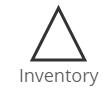
Inventory:
and many more.
Example:
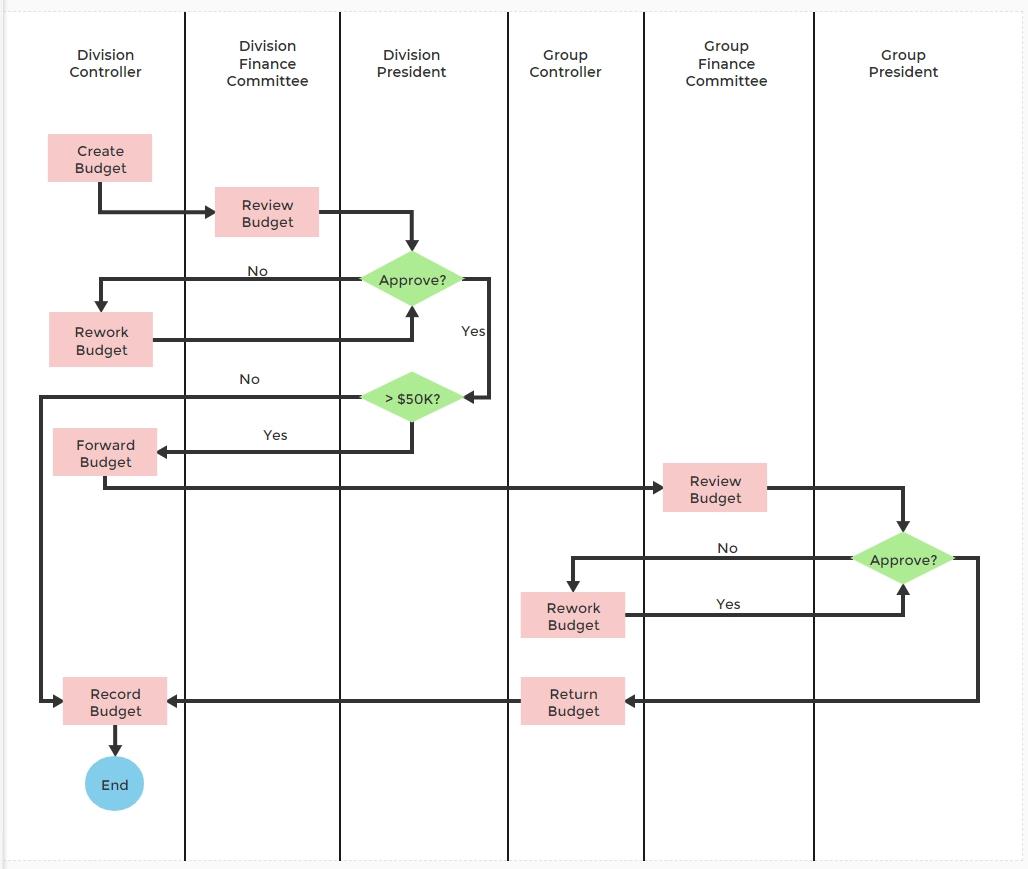
Suppose you want to create a process flow chart to show the functional areas involved in each process step and identify the hand-off points between them. Here's how you can do this in EngineRoom:
- List the process steps along with the group or individual involved in each step:
- Create Budget - Division Controller
- Review Budget - Division Finance Committee
- Approve/Reject Budget - Division President
- Rework Budget - Division Controller
- Forward Budget if > $50,000 - Division Controller
- Review Budget - Group Finance Committee
- Approve/Reject Budget -Group President
- Rework Budget - Group Controller
- Return Approved Budget - Group Controller
- Record Budget - Division Controller
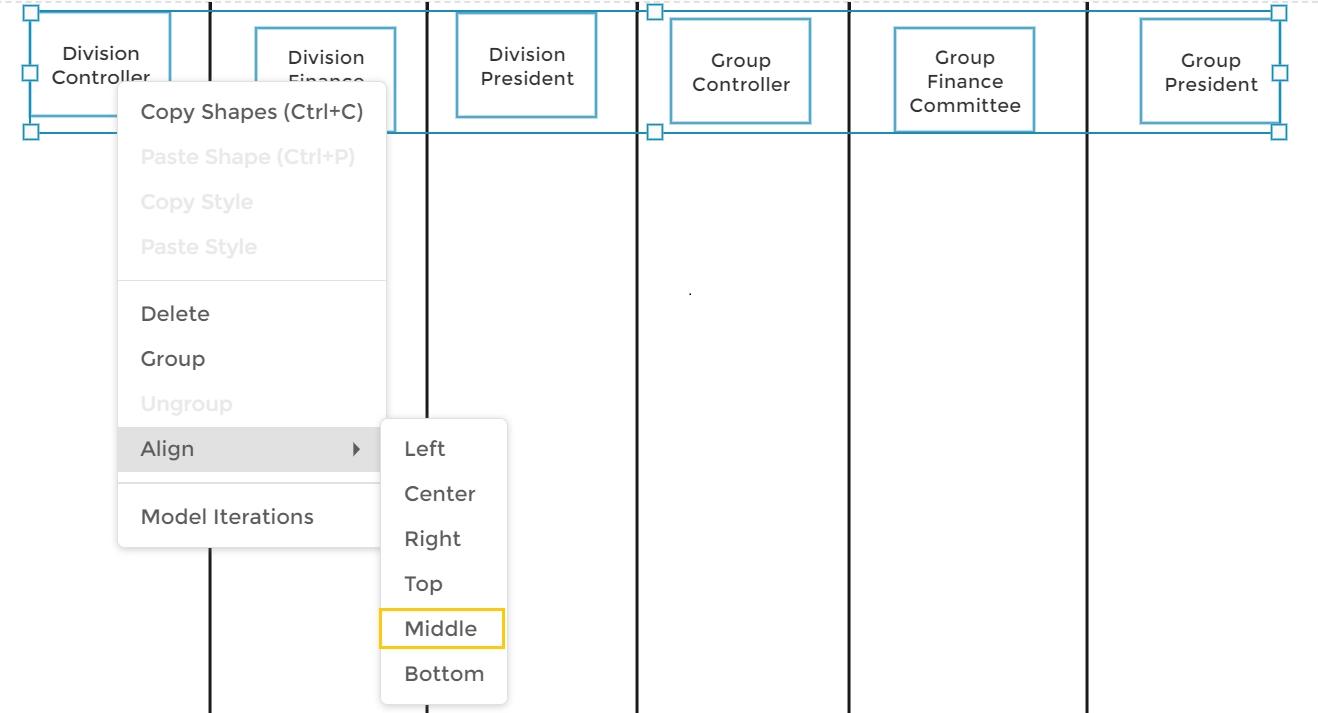
- Follow the basic steps listed above under 'Using EngineRoom' to start a new process flow chart and create vertical swimlanes to represent each of the six functional groups in our example. Label them using the Text Label boxes. You can use Right-click > Align > Middle to align the labels horizontally:
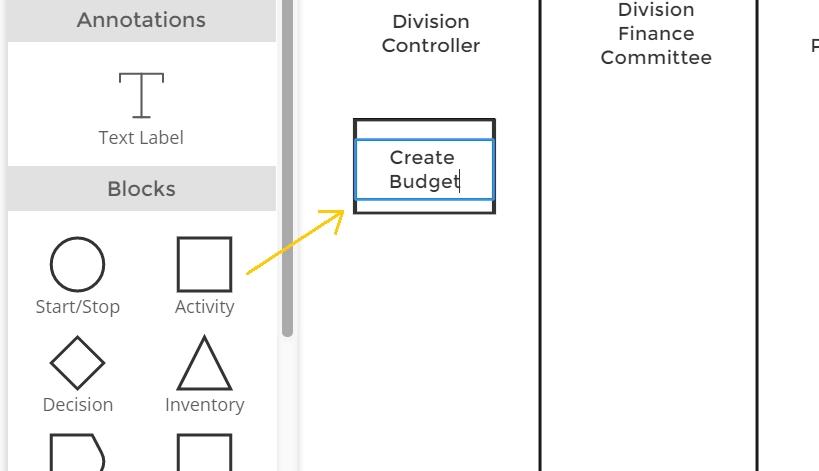
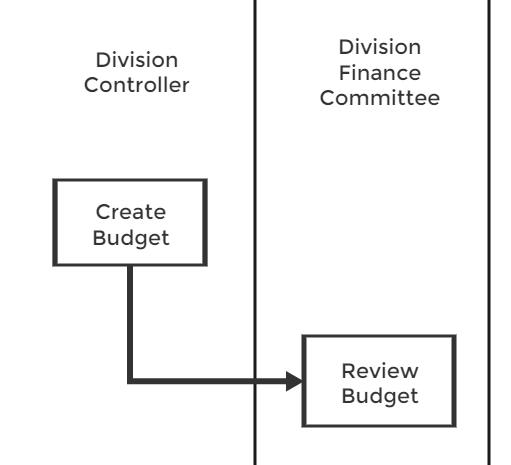
- Click and drag a process shape/block out onto the workspace from the tools panel on the left into the first swimlane and double click on it to label it 'Create Budget' (you can resize the block to fit, if needed):
- Drag another process shape/block out to the workspace and place it in the second swimlane, under Division Finance Committee, and label it Review Budget. If they're not automatically connected, connect the two blocks by dragging your cursor from one of the blue landing targets on the first to the second block:
- Now draw the rest of the chart by dragging the blocks onto the appropriate department swimlanes. You can edit the objects as you like, with border and fill colors to suit the need, and apply formats across multiple objects by selecting them (click and drag over them) and using the Paint format button:
- Don't forget to name your chart so you can find it later - naming it in the modeling workspace will carry the title over to the study in EngineRoom, and vice-versa:
Your deployment flow chart is now ready!
Notes
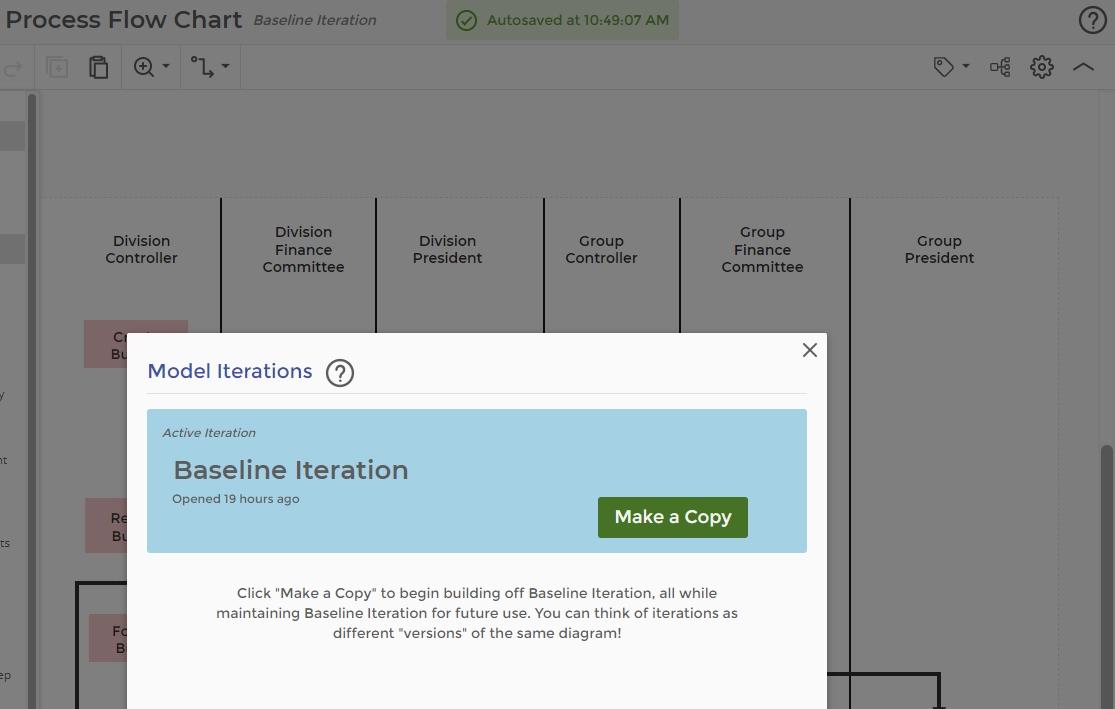
1. When testing out different scenarios or improvements to the process, you might want to create different 'iterations' of the chart - you can do this by clicking the 'Baseline Iteration' link on the top left of the window, or the 'Model Iterations' button on the top right, click 'Make a copy' of the original chart and rename the copy. Now you can edit the chart as you wish, without losing the original iteration. All the iterations are saved in the same study, so just click 'Model Iterations' again to see them.
2. Close the flow chart tab/window to return to EngineRoom - the study is stored in the Studies panel so you can access it at any time
3. To delete a map, click the Delete Studies button in the Studies panel in EngineRoom and select the chart study from the list.
Was this helpful?