
Value Stream Map Tutorial
Tutorial
When to use this tool
A Value Stream Map is a graphical representation of the sequence of activities the organization follows to produce its end product or service. It shows the flow of information and material and the occurrence of actions using easy-to-understand symbols.
This map should be created prior to any lean initiative or in the first steps of a Six Sigma project.
Using EngineRoom
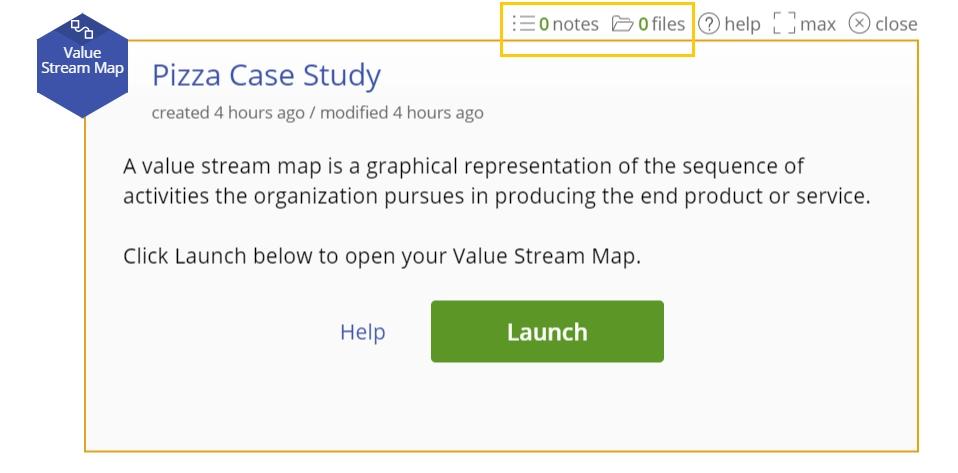
To use the tool, select Define > Value Stream Map. A study opens on the workspace, with a button to launch the VSM workspace:
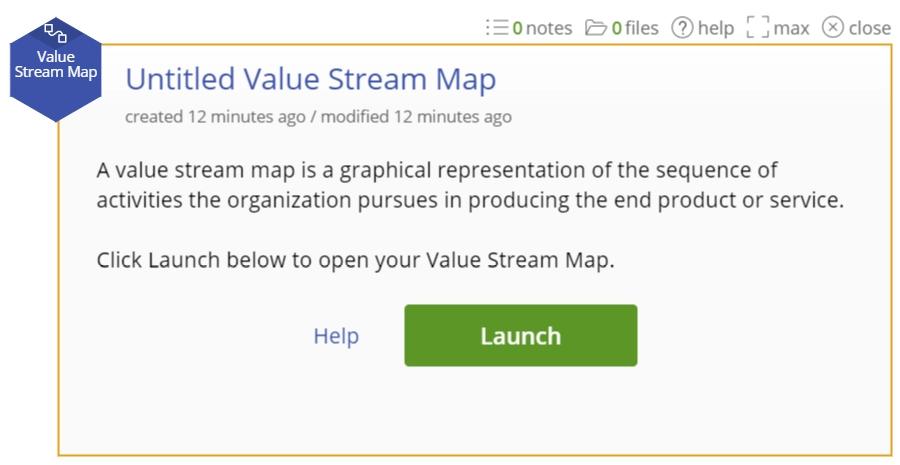
Note: Clicking on the Launch button opens the Value Stream Map in a separate tab or window to allow for the maximum workspace in which to build your map.
Creating a new value stream map is easy:
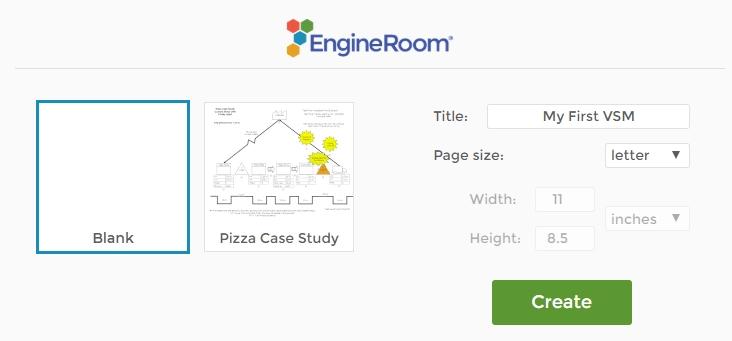
1. Open the VSM tool in a new tab and select the Blank option
2. Label your new map and click the Create button:
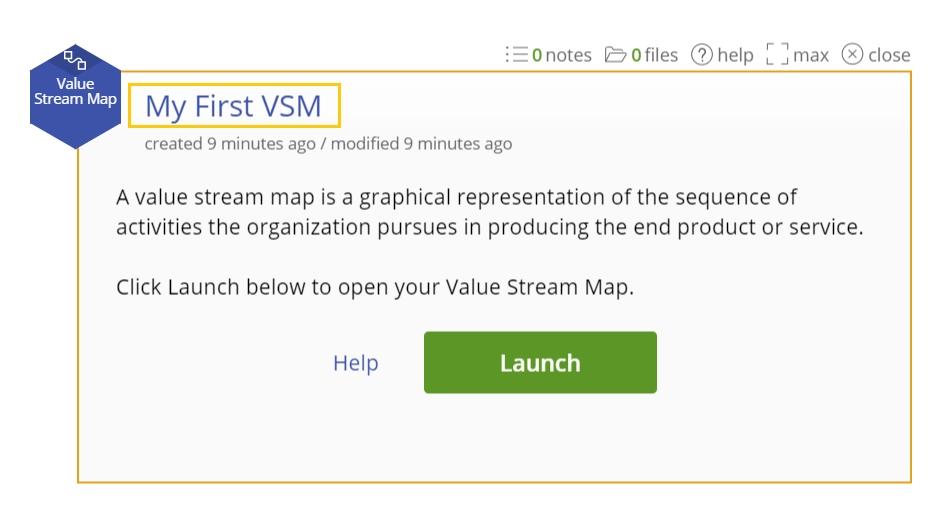
3. If you click back into EngineRoom, note that the VSM study now reflects the new name:
4. Drag a Process Step object out onto the workspace from the tools panel on the left:
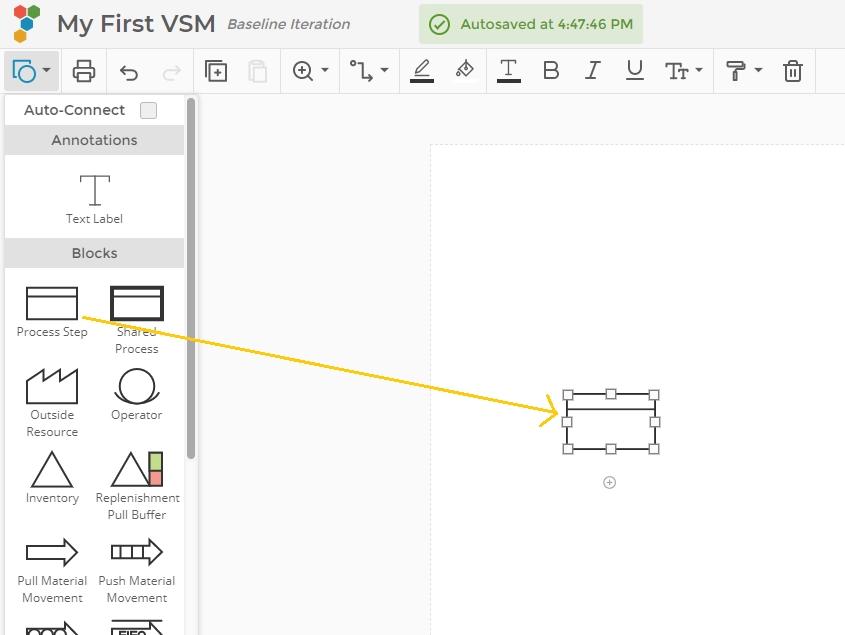
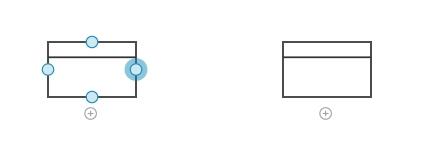
5. Drag another process step object out and connect the two objects by dragging your cursor from the blue hover zone on the first to the second object:
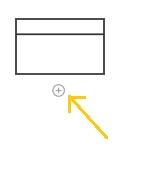
6. Click on the “+” sign below the object to create a Data Block below the object:
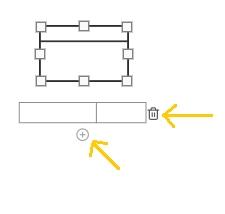
7. Now you can enter information about the process step into the data block. You can add additional rows to the data block by clicking the “+” below the row or removing the data block row by clicking the trash can icon to the right of the row.
You are now well on your way to creating your Value Stream Map!
Example:
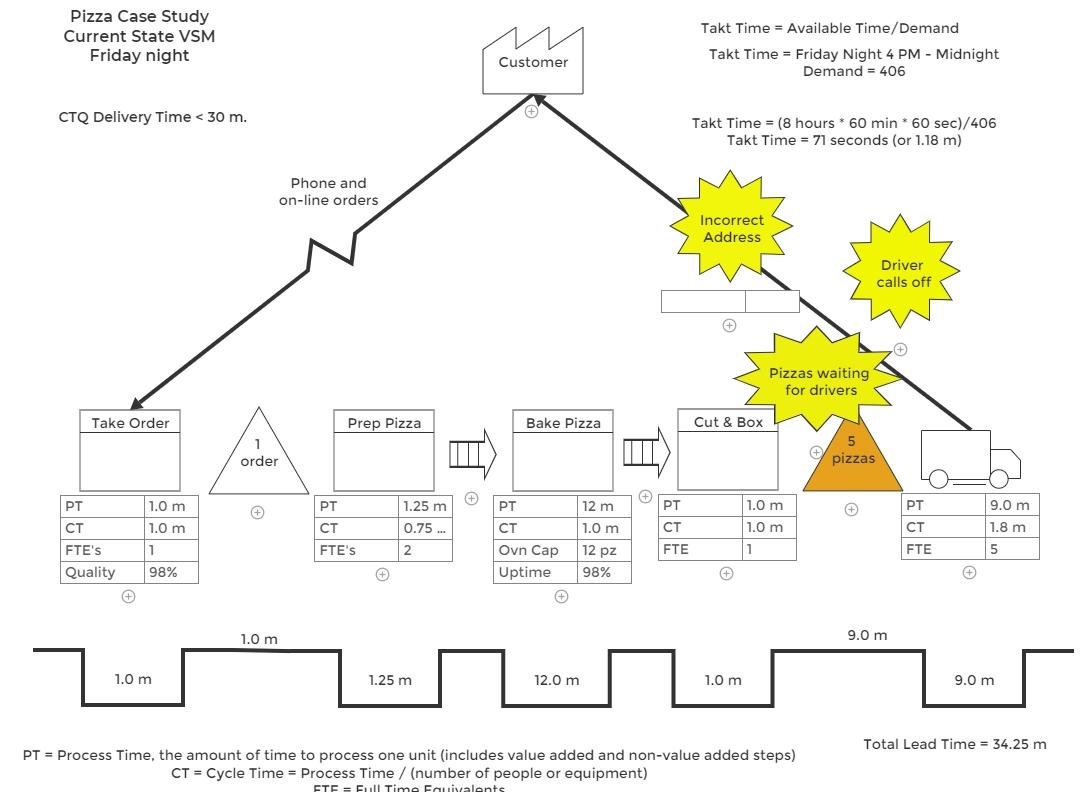
To describe the various elements of the VSM tool, we will use the Pizza Case Study that is pre-loaded into the VSM library. Watch the tutorial above to see the functionality of the different pieces and how they fit together.
The Pizza VSM uses most of the options available in the VSM tool. They include:
- Text boxes: Add these anywhere on the map to annotate objects. You can edit, resize, or connect these text boxes to other objects.
- Shapes: Available for use are all the traditional VSM shapes such as process steps, inventory, arrow connectors, swimlanes, etc.
- Data blocks: These house the process step’s information.
- Timeline: Here, you can add or remove “valleys” and add text to enter the time.
- Call outs: Use these to add Kaizen icons, among other things.
Note: The map autosaves every few seconds as you work, so you do not need to manually save changes.
The tutorial shows you how to add, edit, and remove the objects in the map.
The Pizza Case Study VSM is shown below:
Notes:
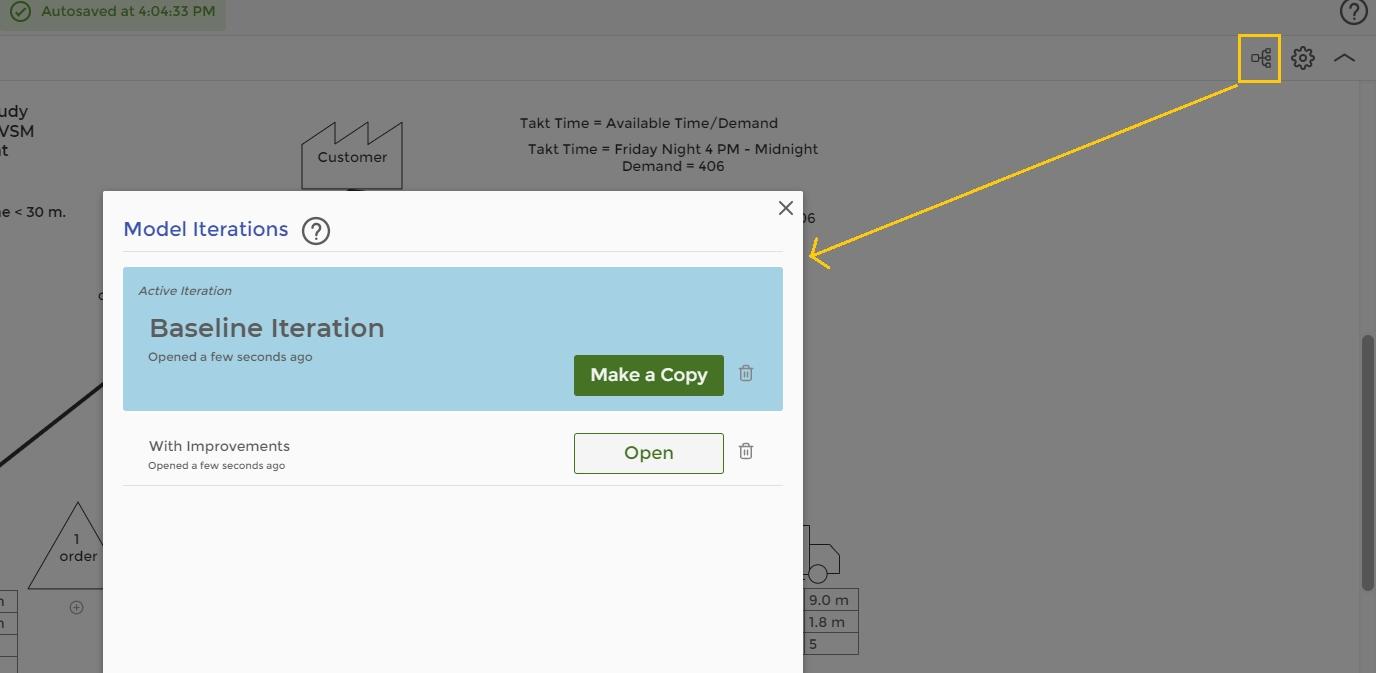
1. When testing out different scenarios or improvements to the process under study, you might want to create different “iterations” of the map. You can do this easily by clicking the “Baseline Iteration” link on the top left of the window or the “Model Iterations” button on the top right. Click “Make a copy” of the original map and rename the copy. Now you can edit the map as you wish without losing the original. All map iterations are saved in the same study, so just click “Model Iterations” again to see them.
2. Close the VSM tab/window to return to EngineRoom. The VSM study is stored in the Studies panel and can be opened from there.
3. As with other EngineRoom studies, you can attach notes and files to the VSM study.
4. To delete a map, click the Delete Studies button in the Studies panel in EngineRoom and select the VSM study from the list.
Was this helpful?