
Gantt Chart Tutorial
Tutorial
When to use this tool
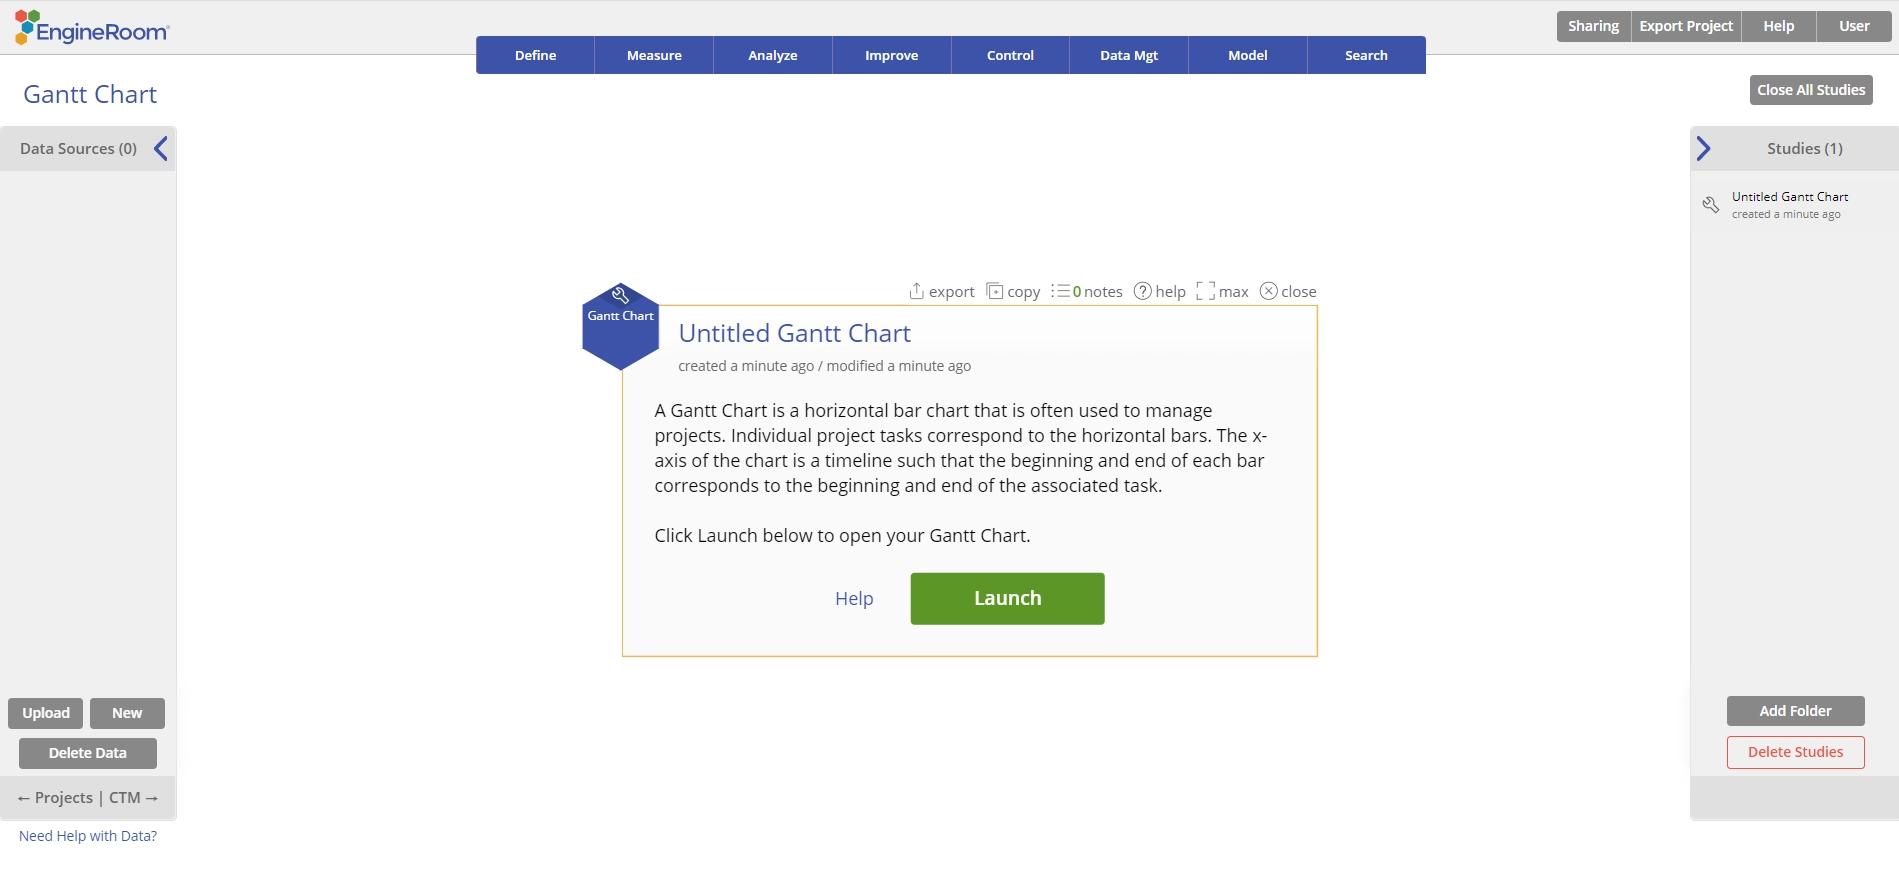
A Gantt Chart is a project timeline map that is often used to manage projects. Individual project tasks correspond to the horizontal bars. The axis of the chart is a timeline where the beginning and end of each bar corresponds to the beginning and end of the associated task.
How to use this tool in EngineRoom
1. Select Gantt Chart from the Define (DMAIC) menu and click the Launch Button.
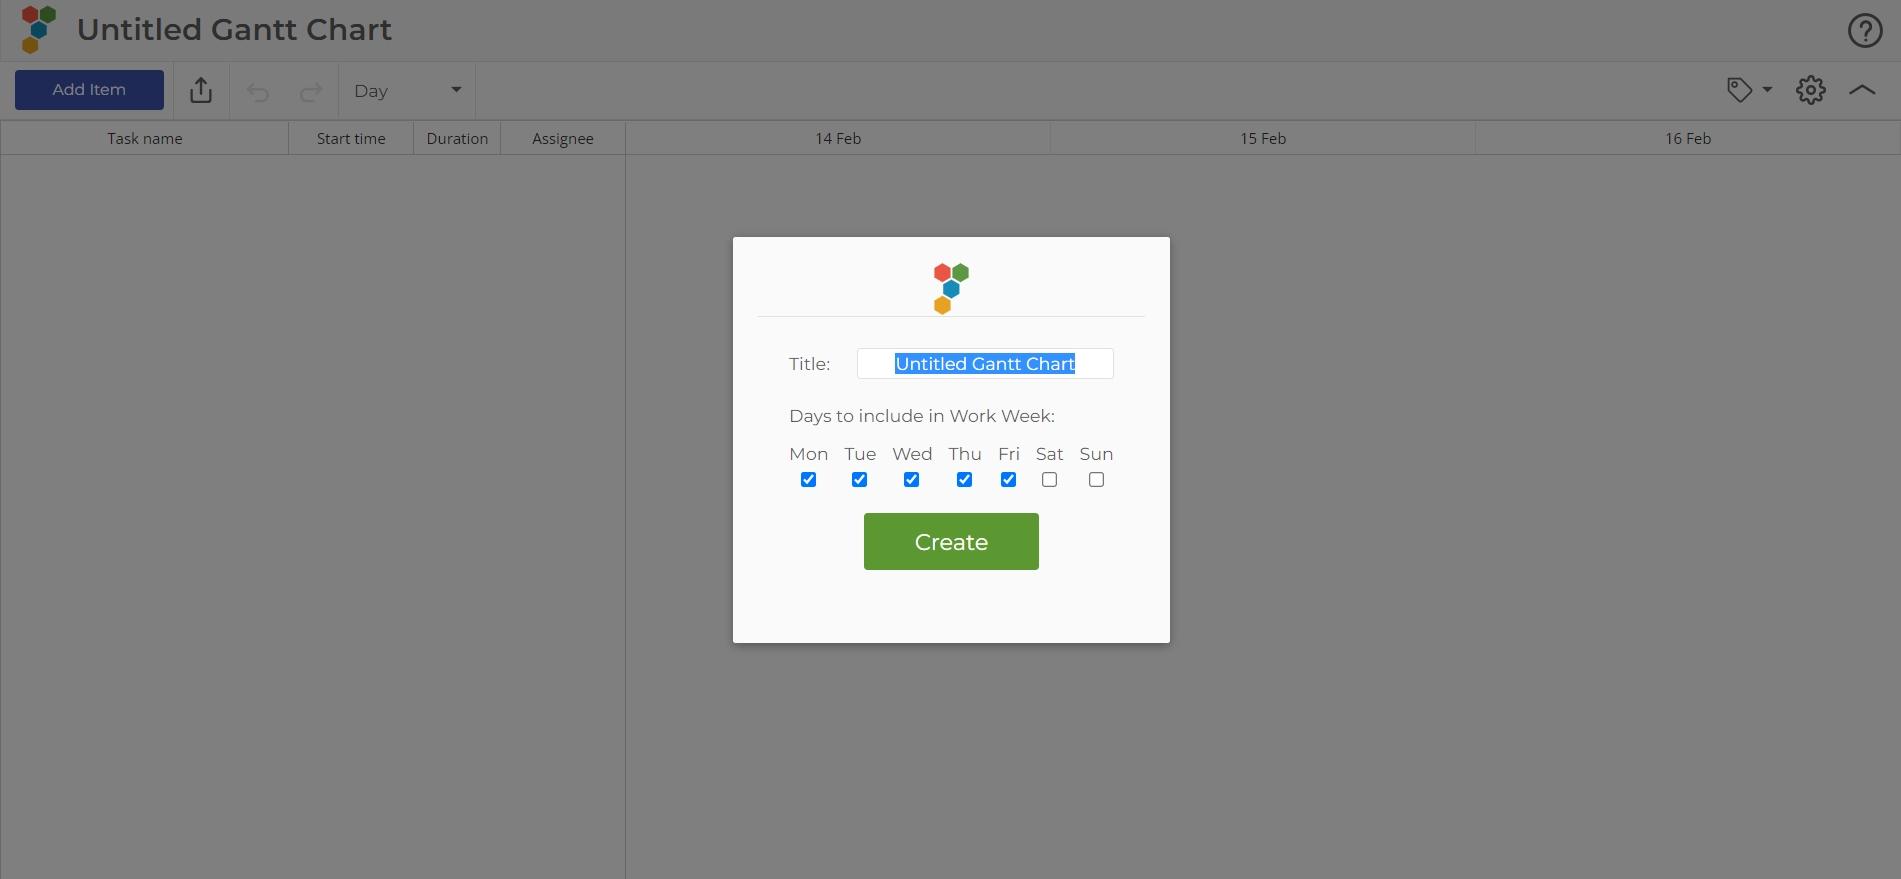
2. Rename the Gantt Chart and choose what days of the week you'd like in the work week.
Adding Tasks
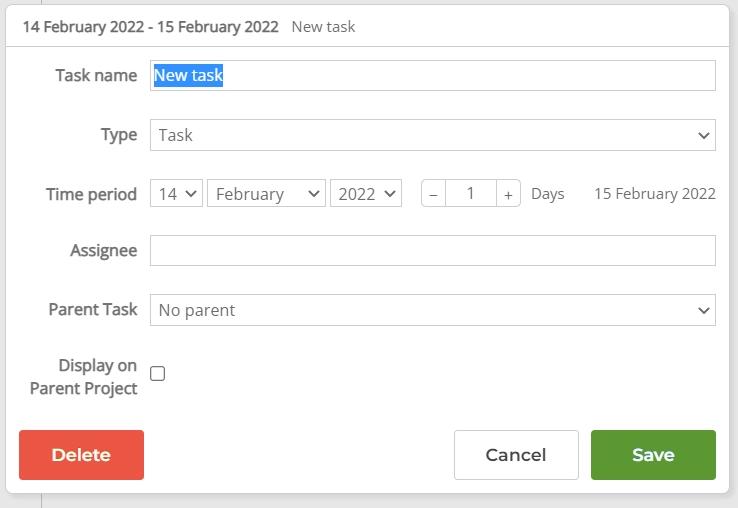
1. Click the "Add Item" button on the top left.

2. In the window, update the Task Name of the task.
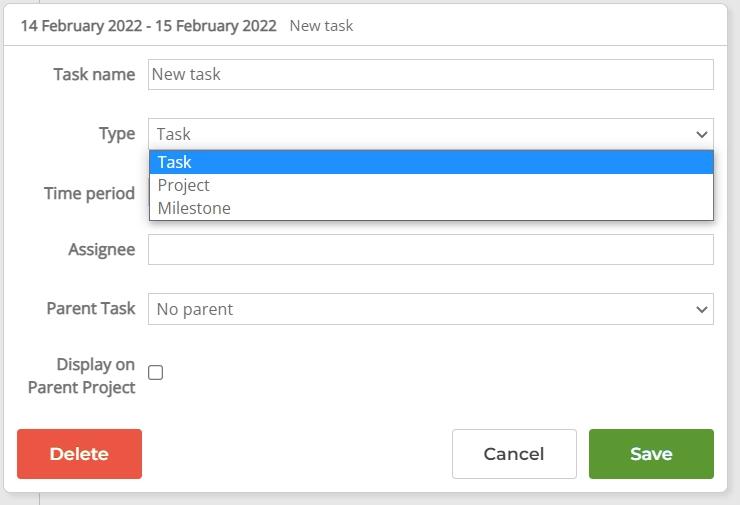
3. Choose a type. The options are:
- Task: The basic default task allows you to set a start date and a duration.
- Project: Allows you to group multiple tasks. Expands its duration based on the tasks within it.
- Milestone: A point in time with no duration.
4. If applicable, set the time period by choosing the date and the length of time. The date at the end indicates the end date based on these choices
5. (Optional) Type in a name or role for the one responsible for the task
6. Optional) Set a parent task. This will nest the new task under an existing task on creation. This allows you to hide long lists of tasks under a heading
7. (Optional) Set "Display on Parent Project". When this option is turned on, if the task is nested under a Project, it will show up on the Project line even if the Project is collapsed
8. Click Save.
Editing Tasks
There are many options for editing the task once it has been created.
- Click on the icon on the far-left of a task or double click on the task's bar to reopen the editing window.
- Click on a cell in the left columns to adjust the Task Name, Start Time, Duration, or Assignee.
- Drag the task's bar to the appropriate start date. Drag the end of the bar to the appropriate end date.
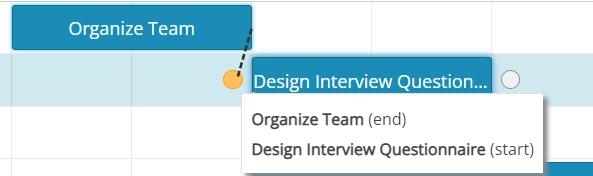
Creating Dependencies
Dependencies allow you to make connections between tasks and automatically adjust schedules as you experience delays and changes.
1. Highlight or hover over a Task's bar to show the circles at the end.

2. Click on the circle and drag the connector to another Task's circles.
Deleting Dependencies
To delete a dependency, double click on the arrow. Then click Ok. If it's difficult to click on the arrow, you may want to move your task to make the arrow longer and give more space to double click the connection.
Reordering Tasks
In order to put tasks into different orders there are a couple of options:
- Drag and drop tasks up and down to the appropriate spot. (Note: It is possible to nest a task this way, so be aware of how far the preview displays)

- Click on the headings of the columns on the left to sort in alphabetical or time order. You can use the Undo button to reset the order.

Nesting Tasks and Projects
Tasks can be nested into projects and other tasks to organize and hide long lists of tasks. Options include:
- Drag and drop the task on top of another task or project. This will display the task underneath the project.
- Double click on the Task's bar to open the editing window. Change the "Parent Task" to the task you would like to nest under.
Deleting Tasks
To delete a task
1. Double click on the task's bar to open the editing window.
2. Click the "Delete" button in the bottom left.
3. Click the confirm button to delete the task.
Using the Chart
When working on a project, the Gantt Chart tracks progress as well as the plan.
1. On a Task's bar, there is a triangle that you can drag to indicate completion of the task.

2. As Tasks get delayed, update the Gantt Chart by editing the Tasks or Task Bars. If you have Dependencies, they will automatically update the rest of the schedule.
Viewing the Timeline of the Project (Change Time Scale)
To view the project over a longer time frame, such as over weeks or months instead of by days, use the dropdown on the upper left to let the time scale.

Critical Path
The Critical Path indicates the tasks that cannot be delayed or else the entire project will be delayed.
- To turn this on, go to the tag icon in the upper right.
- Click on the checkbox to highlight the Critical Path tasks.

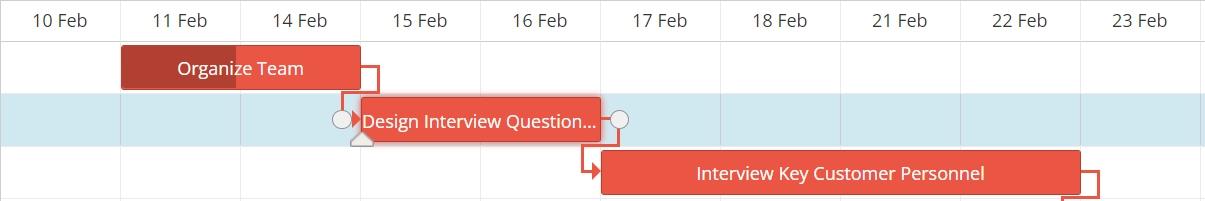
When the Critical Path is turned on then the chart will highlight in red the tasks the follow the critical path as seen here:
Calculation of the Critical Path
The Critical Path is calculated by looking at the last item of the project and working backward through the dependencies connected to that item. This final item can be a Task or a Milestone. If there are ANY gaps in that Critical Path, the tasks will not be highlighted, since there is some wiggle room for those tasks to be be completed later.
Without a gap:

With a gap:

Also note that while Projects themselves are not included as part of the critical path, the tasks within a connected project will be highlighted to reflect the critical path.
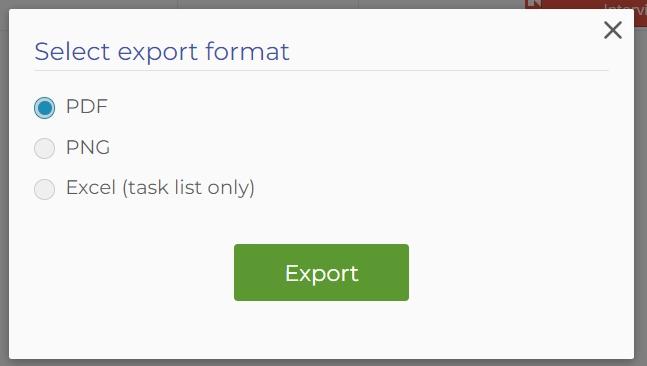
Exporting (and How to Print)
EngineRoom offers three different ways to export your Gantt Chart.
- PNG: A standard image
- PDF: A PDF document that fits on one page
- Excel: A list of the tasks, start dates, durations, and assignee. This does not include the bars for the Gantt Chart.
In order to print your Gantt Chart, we recommend exporting to a PNG or PDF and using your computer's print functionality.
A simple Gantt Chart example is shown below:
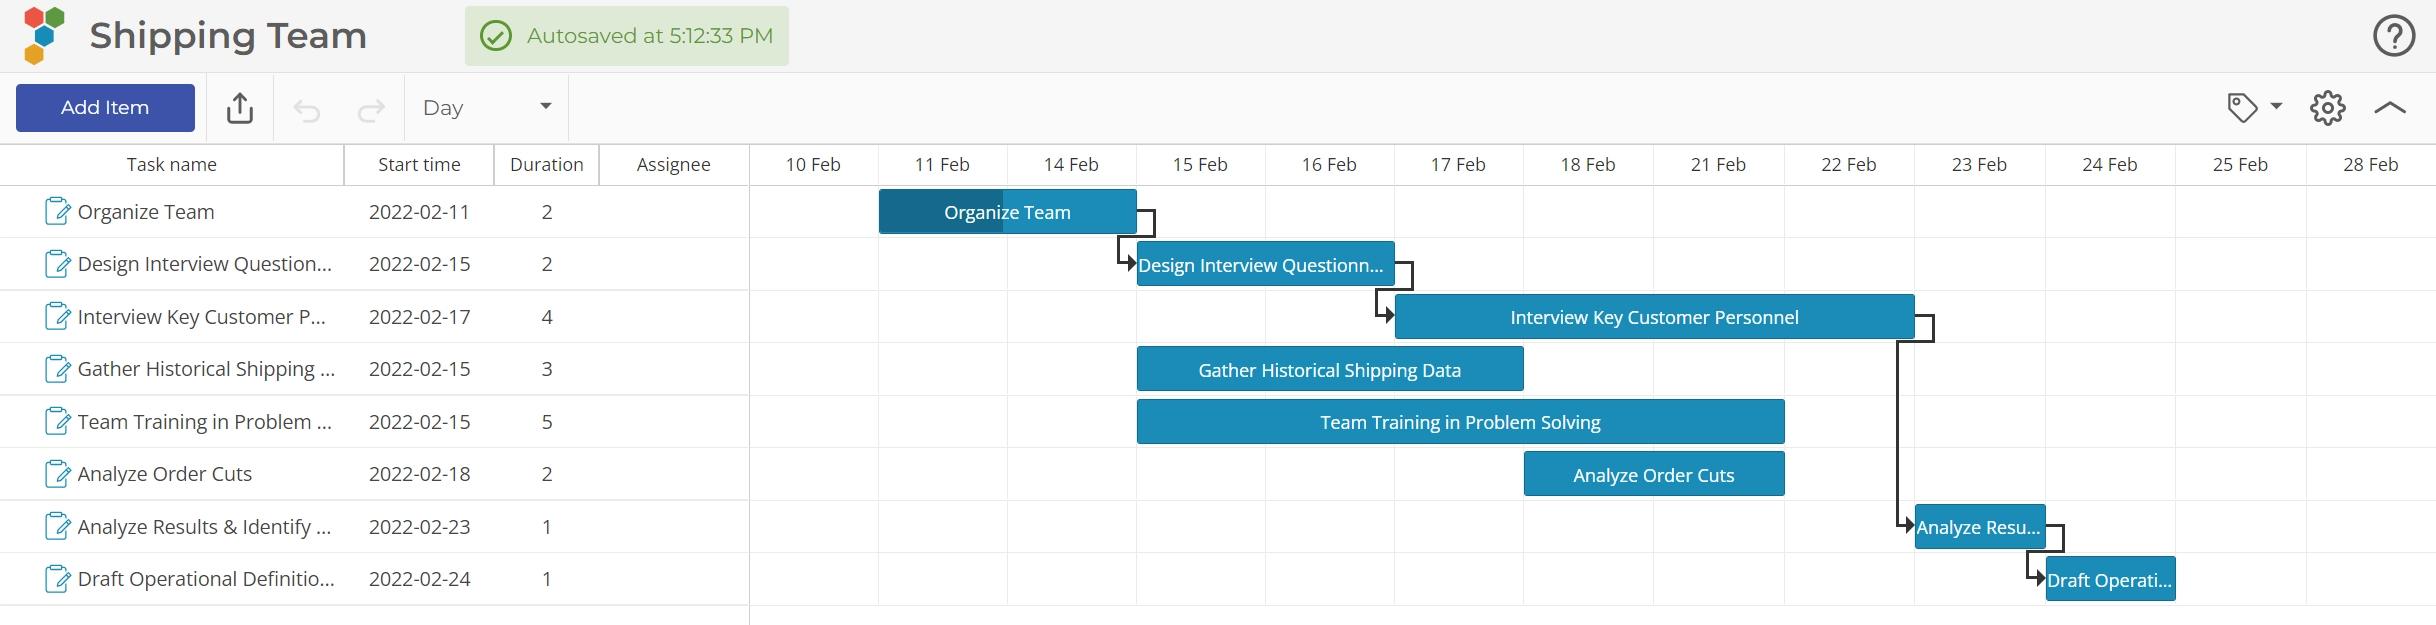
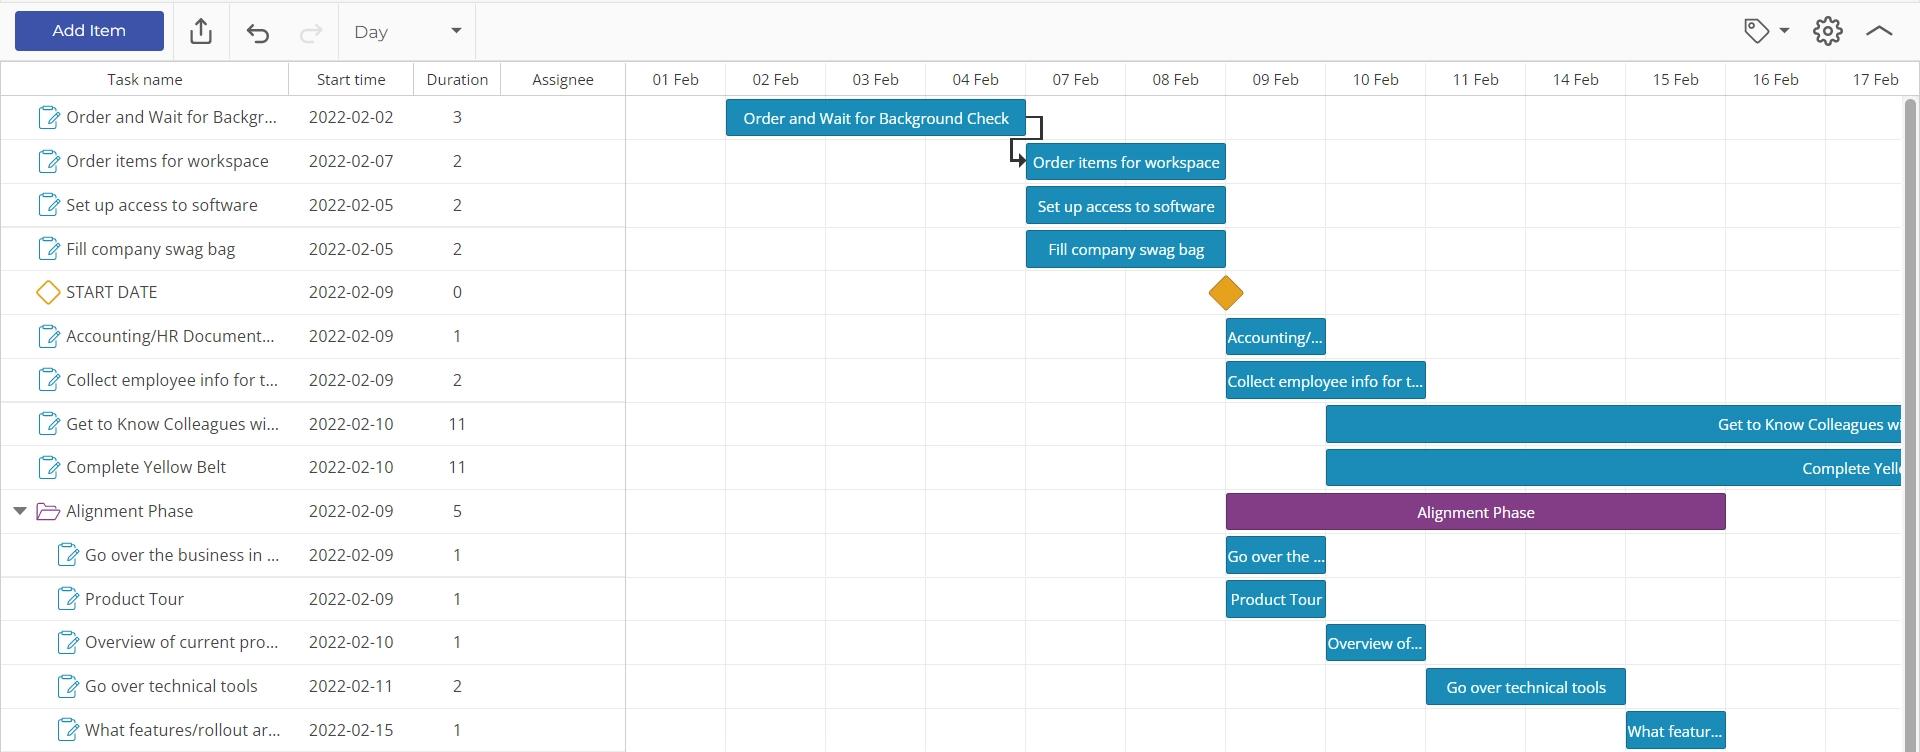
A more complex Gantt Chart is shown below:
Was this helpful?