
DOE Data Source
The DOE Data Source is a special type of data source, in that it houses the DOE design matrix (columns containing the Standard run order, Randomized run order, Blocks, Replicates and the various design factors), as well as the response variable column(s), in a table format.
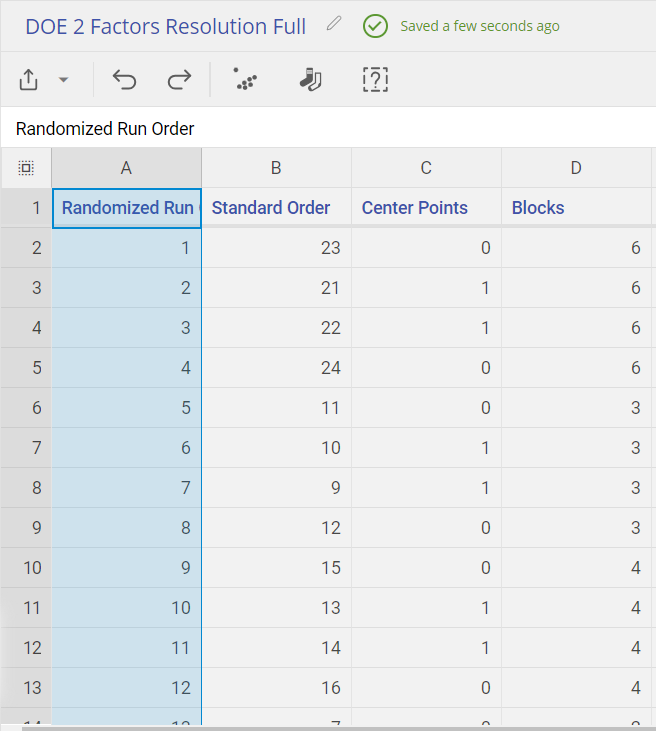
A default Design Matrix is sorted in Randomized Order, which prescribes the order of level settings you would use for each run of your experiment if you were running it real-life.
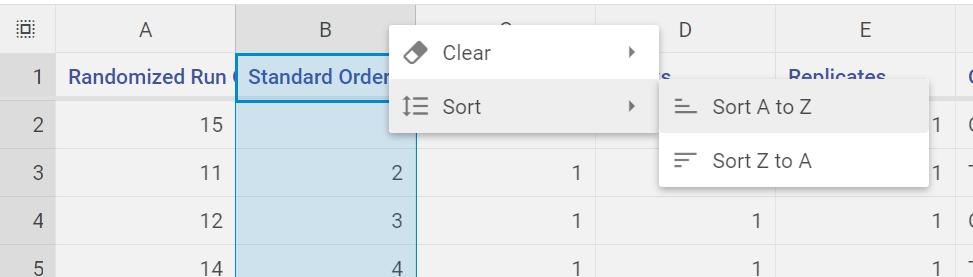
You can sort the Data Matrix by Standard Order as well, which is an order that creates a pattern with the level settings for each factor that is standard for Design of Experiments. This order allows you to copy and paste previously created data from another source (such as a course or instructor) easily.
In addition, by creating multiple columns, you can record multiple output variable from a single run.
Note: EngineRoom analyzes a single response variable at a time. You will have to create a second DOE tool and select "I have a Design Matrix" in order to analyze multiple outputs.
How to use the data source with eLearning Data
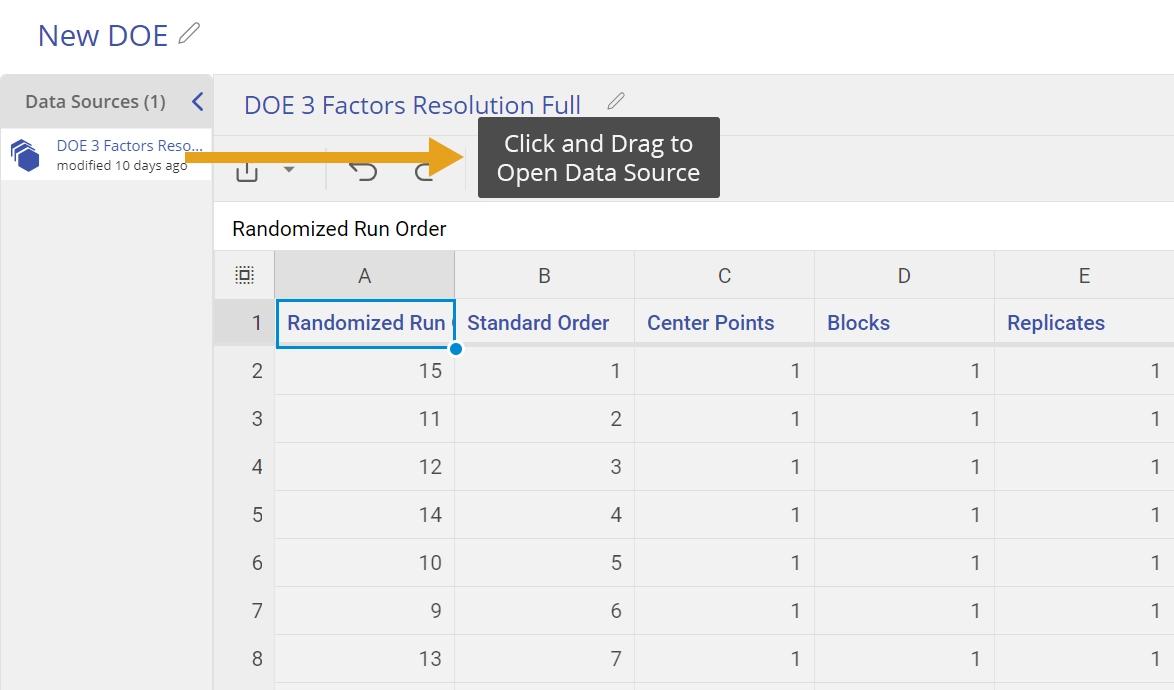
1. Drag the data source onto the workspace to see it in worksheet format:
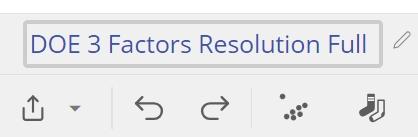
2. Rename the data source by clicking on the title and typing in a new name:
3. Sort the entire DOE data source by Standard Order. This is necessary to ensure that the values from your other source line up properly with the correct runs.
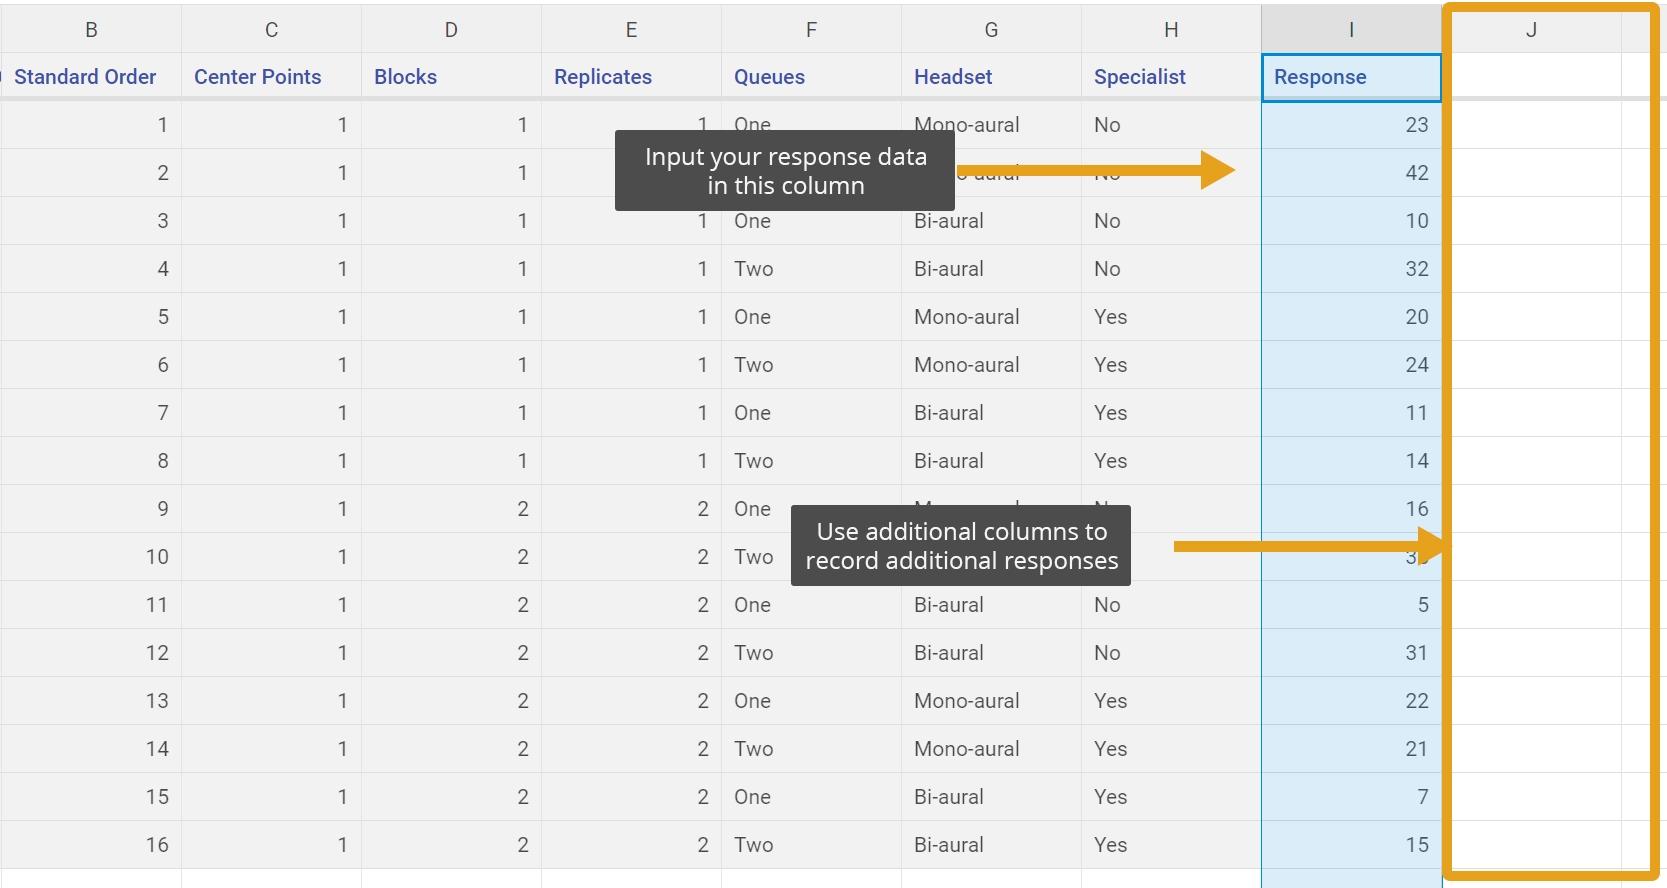
4. Enter the response variable name and data values (in Standard Order) in the blank column to the immediate right of the last column in the design matrix:
5. Click "save & close" to close the Data Editor.
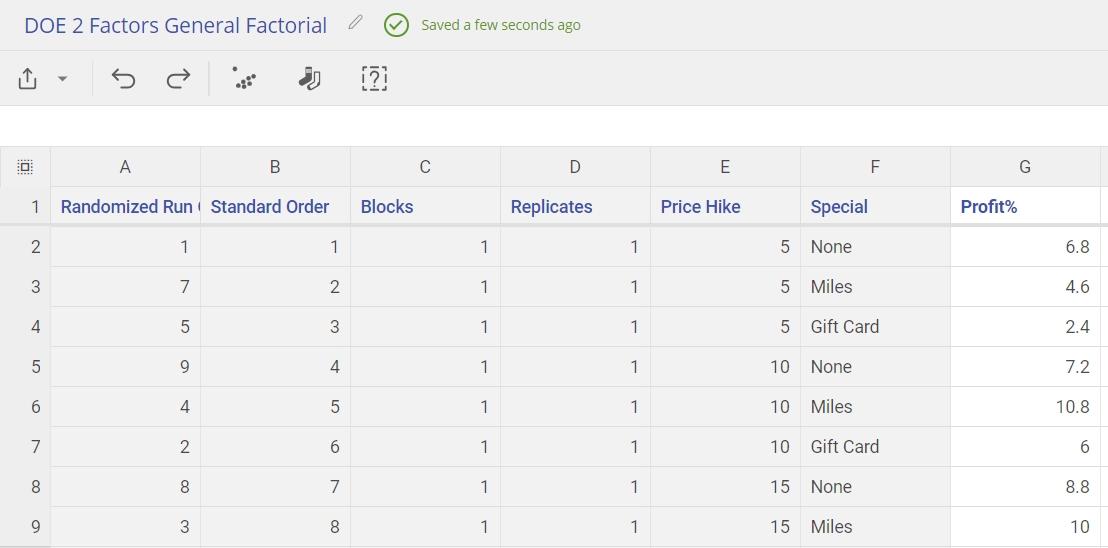
An example of a completed DOE Data Source is shown below:
How to use the data source with a real experiment
1. Drag the data source onto the workspace to see it in worksheet format:
2. Rename the data source by clicking on the title and typing in a new name:
3. Ensure your data source is sorted in order by the Randomized Order column. This is the default. This will give you the properly randomized order that is required by good statistical practices.
4. Run your experiment trials. Each line of the Data Source constitutes a run. Set your factors to the appropriate level as described by the table and record the outcome. If you have multiple outcomes, you can create additional columns to record those results.
5. When you have completed running your trials, you can then use this Data Source in the DOE tool.
Was this helpful?