
1 Mean t-Test Tutorial
When to use this tool
Use the 1 Mean t-Test to compare the mean (average) of a continuous process characteristic to a specified value, when the population variance is unknown.
The 1 mean t-test makes the following assumptions:
- The data are continuous numeric.
- The units are randomly sampled.
- The data are normally distributed.
This test uses the sample standard deviation to estimate the population standard deviation. It can be used even if your data are not normally distributed, as long as you have a large sample (n > 30).
Using EngineRoom
This test can be used on raw data (i.e., the actual sample measurements) or sample summary data in the form of the sample mean and standard deviation.
Example:
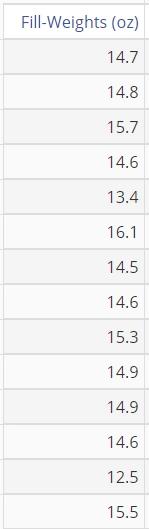
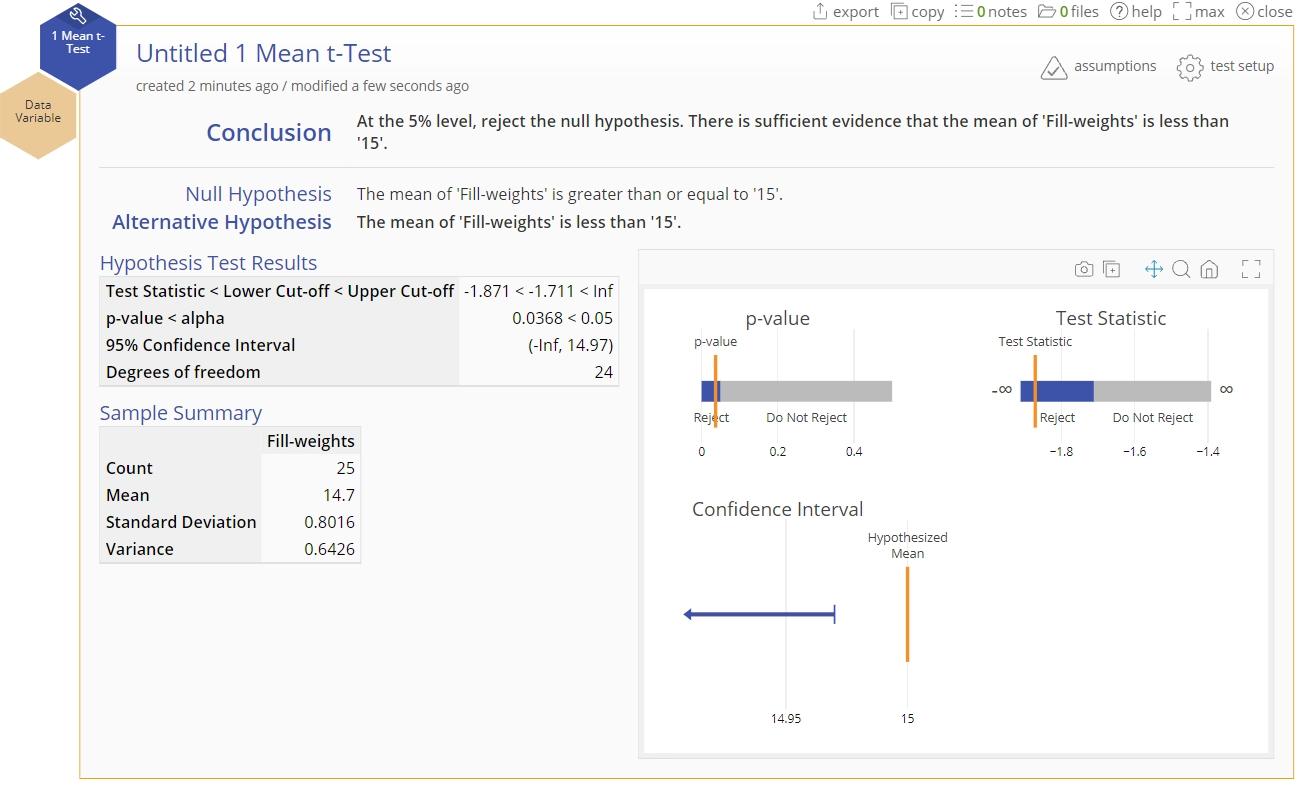
In our example, a manager at a breakfast cereal company wants to test whether the average fillweight of cereal boxes is less than the printed weight of 15 ounces, at the 5% level.
Raw data
For raw data all you need is a single column of measurements:
Select the 1 Mean t-Test from the Parametric menu OR use the Hypothesis Testing Wizard. We will use the test directly from the Parametric menu:
Steps:
- Load the data file into EngineRoom
- Select the Analyze menu > Parametric > Click on the 1 Mean t-Test
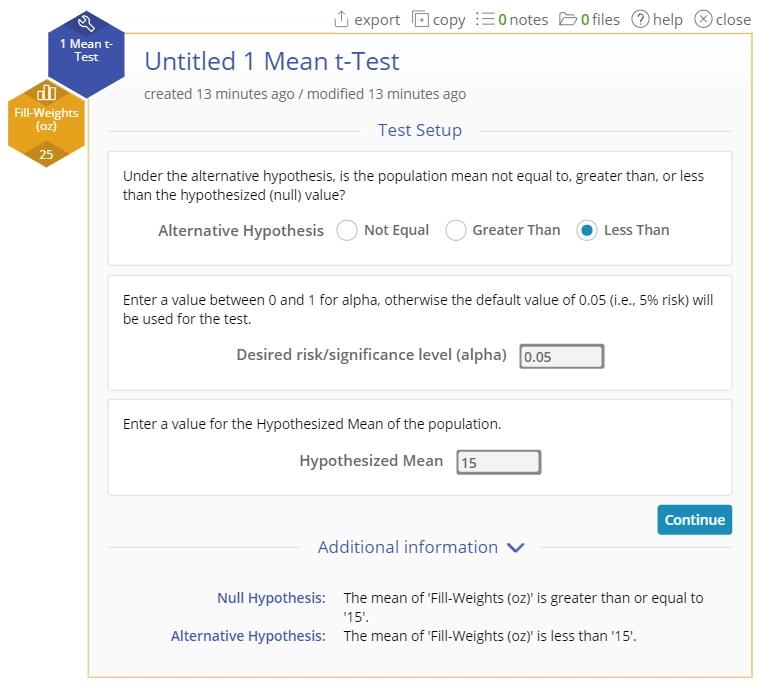
- Click on the data file in the data sources panel and drag the Fill-Weights (oz) variable onto the Data variable drop zone on the study.
- Set up the test as shown, and click Continue:
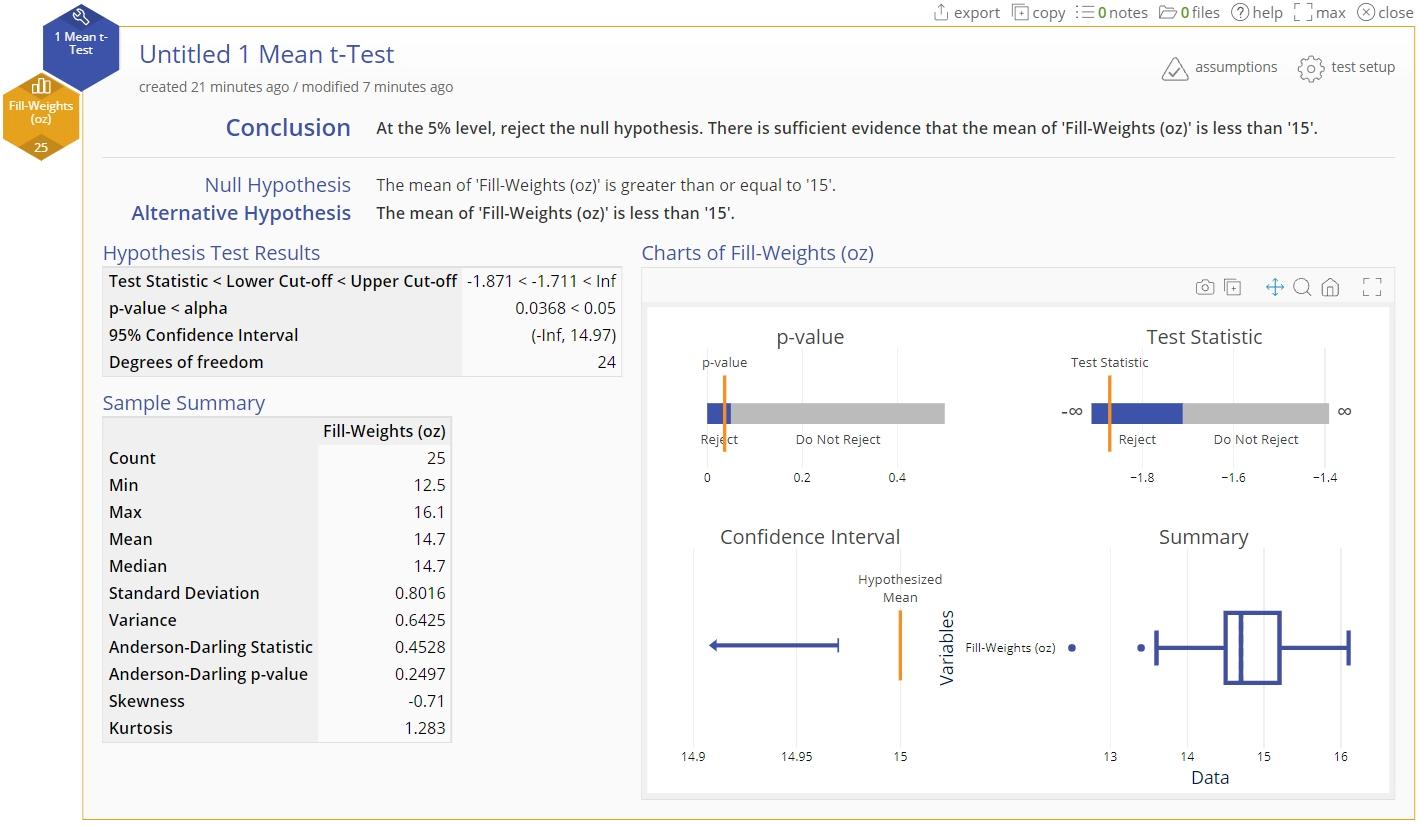
- The 1 Mean t-Test output using raw data is shown:
Sample summary statistics
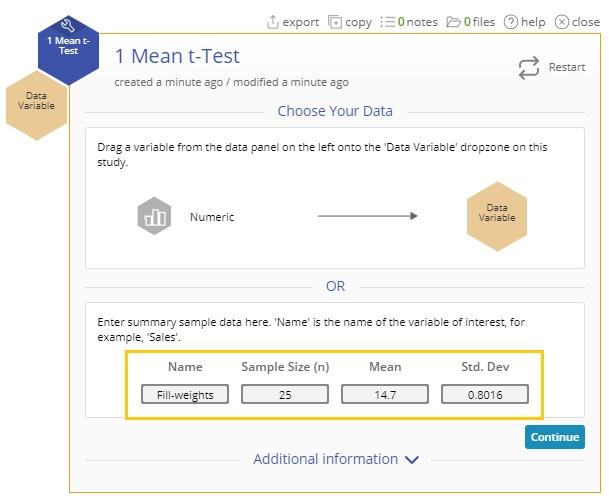
Now let's run the same test using the summary statistics from the data: Given Sample size = 25 Mean fill-weight = 14.7 ounces Standard deviation = 0.8016 ounces
Steps:
- Select the Analyze menu > Parametric > Click on the 1 Mean t-Test
- Enter the summary statistics for the fill-weights data as shown and click Continue:
- Fill out the Test Setup screen as before and Click Continue.
- The 1 Mean t-Test output using sample summary data is shown:
1 Mean t-Test Video Tutorial
Instructor Resources
Was this helpful?