
Mann Whitney Wilcoxon Test Tutorial
When to use this tool
Use the Mann Whitney Wilcoxon (MWW) Test to compare the medians of two independent, continuous populations. As an example, the manager of a clinical facility conducted a study to test whether occupational stress among nurses working in emergency care (EC) is higher than that among nurses working in long term (LT) care using median scores on a stress test.
The test makes the following assumptions:
- The data are continuous numeric.
- The units are randomly sampled.
- The two groups are independent of each other.
- The two groups have equal variances.
Using EngineRoom
Note: You must have raw data to run this test. Non-parametric tests cannot be run with sample summary data.
Example:
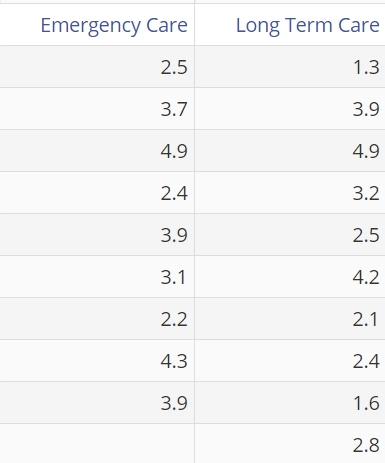
The data for this example consists of stress-test scores from 9 nurses from the Emergency Care (EC) unit and 10 nurses from the Long Term (LT) care unit who were randomly selected for the study. We want to test, at the 15% level, whether the scores in the EC group higher than those of the LT group.
Steps:
- Select the Analyze menu > Non-parametric > Click on the Mann Whitney Wilcoxon Test.
- Click on the data file in the data sources panel and drag the Emergency Care and Long Term Care variables onto the Data variable drop zones on the study.
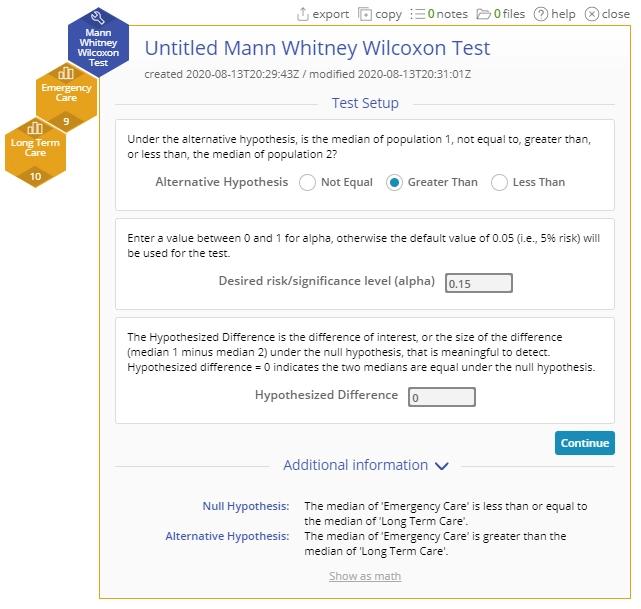
- Set up the test as shown, and click Continue:
- The Mann Whitney Wilcoxon Test output is shown:
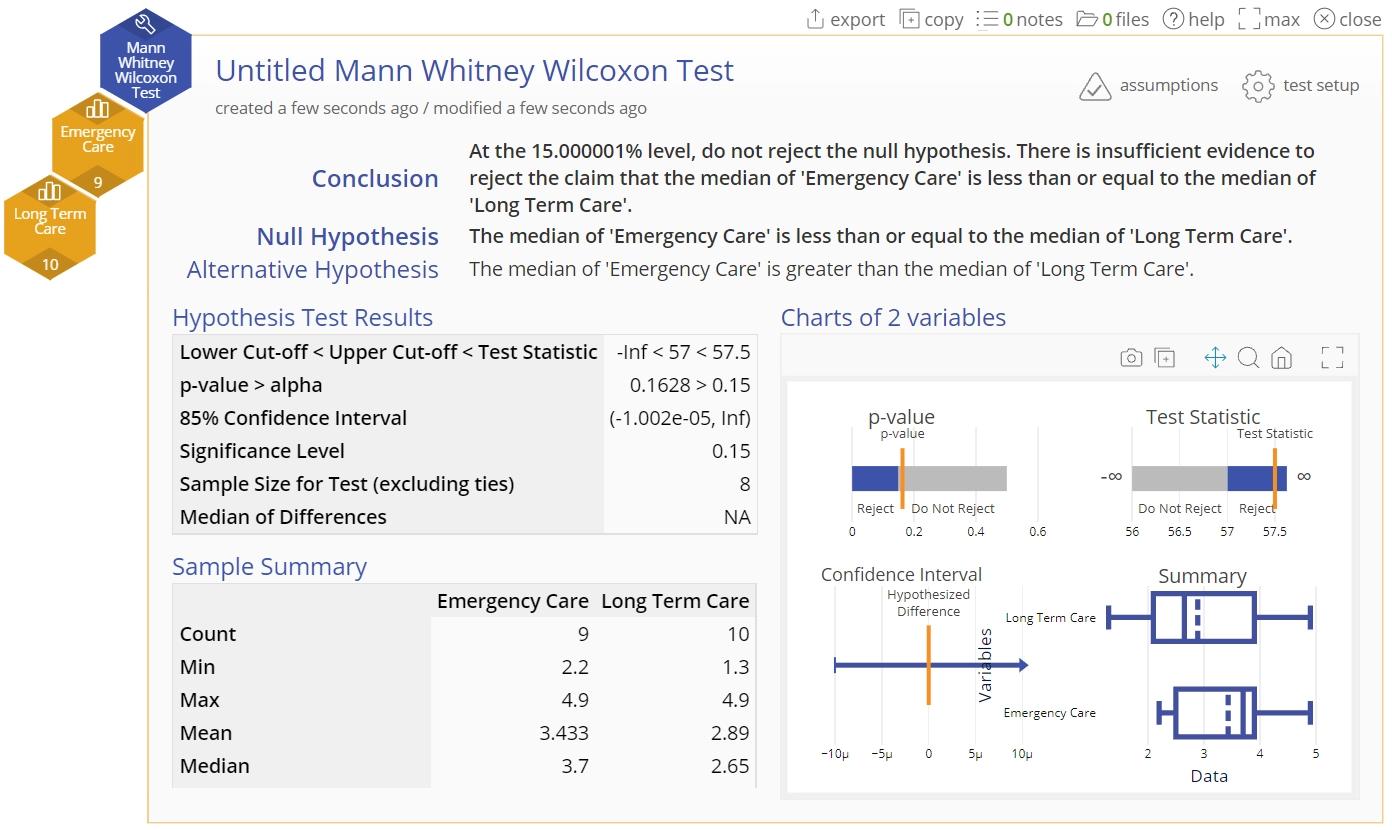
The p-value is greater than the chosen significance level of 15%, so we fail to reject the null hypothesis that the stress score are the same for the two groups of nurses.
Mann Whitney Wilcoxon Test Tutorial
Instructor Resources
Was this helpful?