
Block Results
Results from your simulation run are available by double-clicking any block, then selecting the "Results" tab at the top of the Parameters and Results tab. The result types you see will vary by block, but most are shared among all blocks.
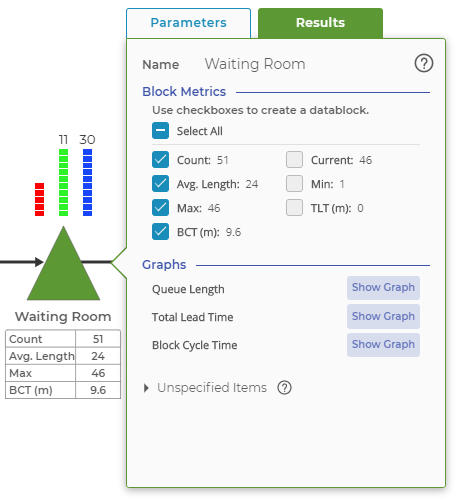
Checking off different results will create a datablock below the shape.
Note that each of the results listed in the top section of the Results Tab has an accompanying checkbox. If you check these boxes, the result also will show under the block in the model space, as seen in the image. This is a particularly handy feature when you are running experiments with your model because you can select key results to display under the block without having to double-click to open the Results Tab.
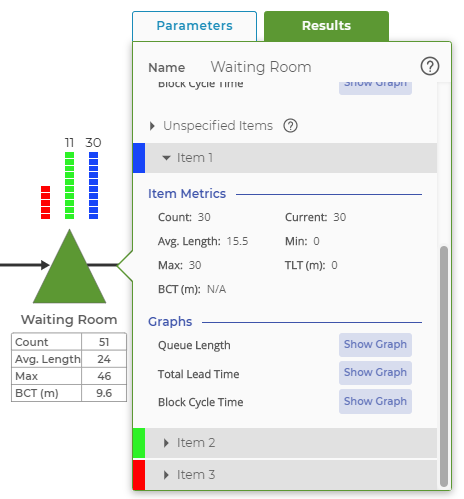
In addition to the general block results you'll see at the top of the window, there is a section for the results of Unspecified Items. If you did not add items to your block, these results will be equal to those at the top. However, if you have added items to your block, there will be statistics to each specific item type. All other items that flowed through the block will have statistics shown in Unspecified Items. The image below shows results for the item type "Item 1" that was added to the block.
Below is a list of all possible types of results – but remember, not all types will be displayed in all blocks.
- Current: This is the current count of items in the block at the end of the run. The queue length chart shows a trend chart of the number of items in a block over the simulation run.
- Min: This is the lowest item count observed in the block during the simulation run.
- Max: This is the highest item count observed in the simulation run.
- Count: This is the count of items that arrived at the block during the simulation run.
- TLT: This is the average total lead time (TLT) of the items arriving at the block. TLT represents the time the items spent in the simulation run before entering the block where you observe this TLT statistic. The TLT chart shows a histogram of TLTs for all items that entered a block during the simulation run. Remember, TLT represents amount of time the item spent in the simulation run before reaching the block where you check this statistic.
- BCT: Block cycle time (BCT) is the average time an item spends in the block, making it a complementary - but very different - measure to TLT. BCT typically is correlated to the processing time distribution you have selected but also may reflect setup and/or wait time if an item cannot leave a block when it has completed its task. The BCT chart shows a histogram of BCT for all items than have entered the block.
- Avg. Length: The average length or count of items in the block across the simulation run.
- Setup Time: Only seen in the Activity Block, this represents the portion of time the block was engaged in setup activity.
- Run Time: Only seen in the Activity Block, this represents the portion of time the block was engaged in run, or processing, time.
- Idle Time: Only seen in the Activity Block, this represents the portion of time the block was sitting idle, waiting for work to arrive.
In addition to the numerical statistical results shown in the block, three charts are available in many of the blocks. These charts, shown in the images below, include:
- Queue Length: This chart shows the trend chart of queue length over the length of the simulation run. If specific items have been added to the Queue Block, this chart is available for the block as a whole or on an item-by-item basis.
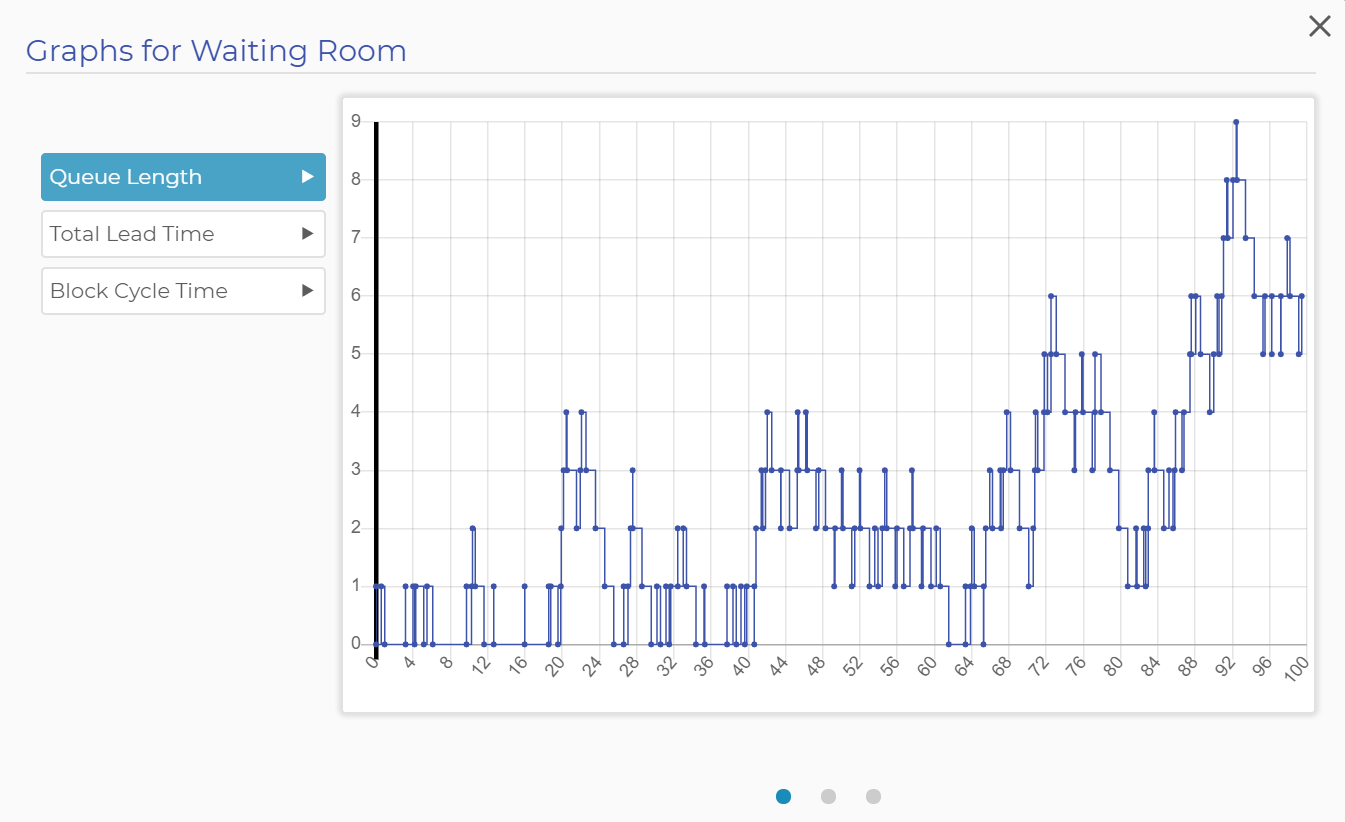
Graph of Queue Length over the simulation time
- Total Lead Time: This chart shows a histogram of the total lead time (TLT) for every item that has arrived at the block. Recall that TLT measures the entire lead time of an item from the point it was created until it enters a particular block.
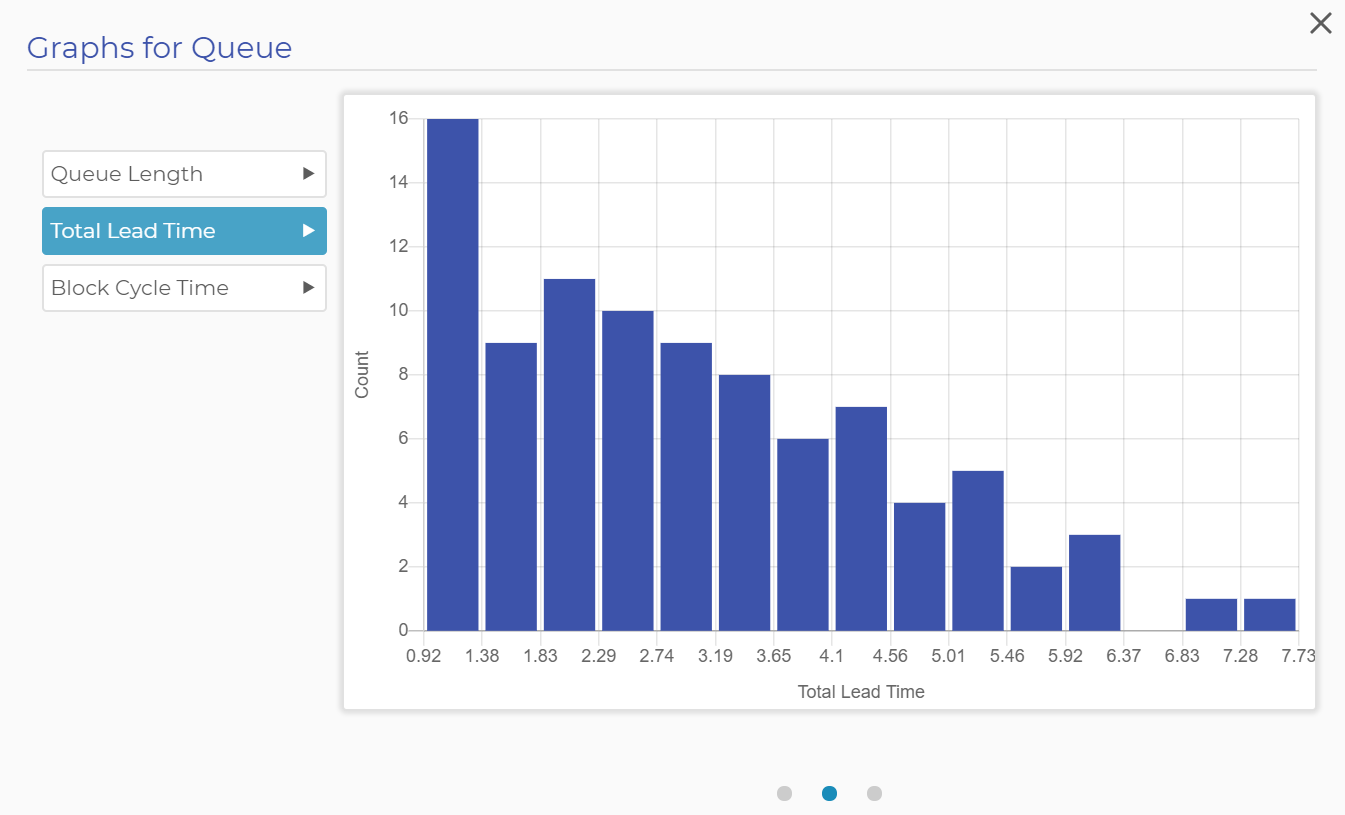
Histogram of Total Lead Times
- Block Cycle Time: This chart shows a histogram of the block cycle time (BCT) for every item that leaves the block. Recall that this measure spans the time the item spends in the block, including setup, processing, and any wait time.
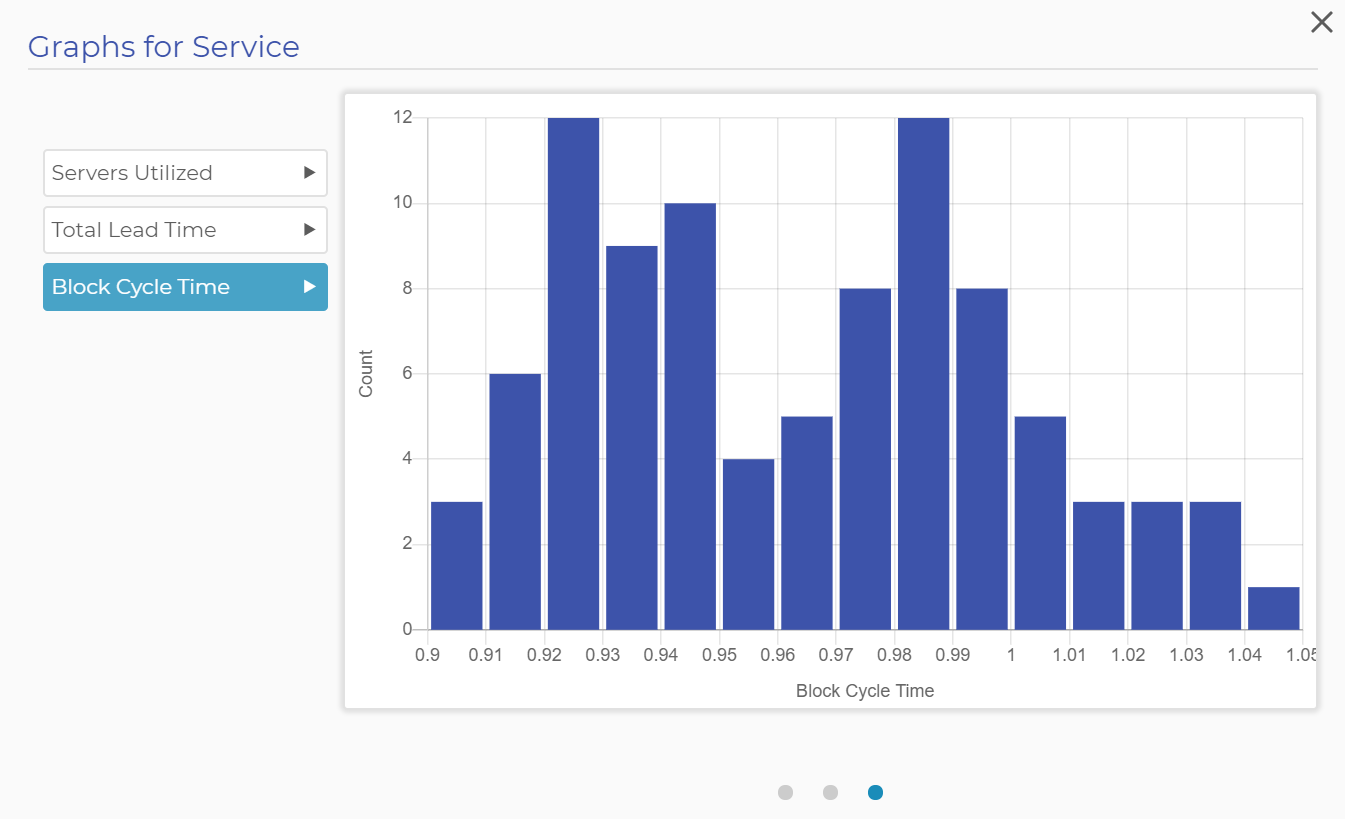
Histogram of Block Cycle Times
Was this helpful?