
Interpreting Results
Follow Along
Viewing the Results Window
After you have run the simulation model, results of the run will be available to display and interpret.
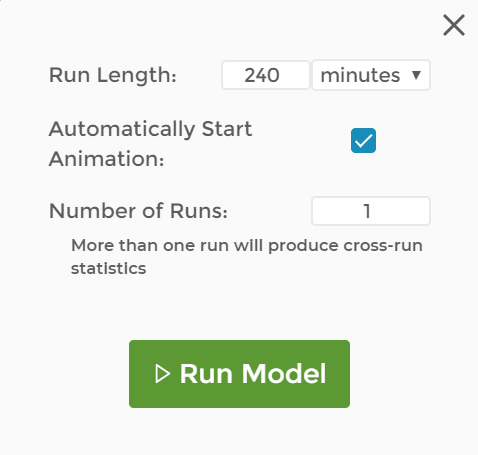
We'll continue working with Kathy's Best Wursts by running the model using the following parameters:
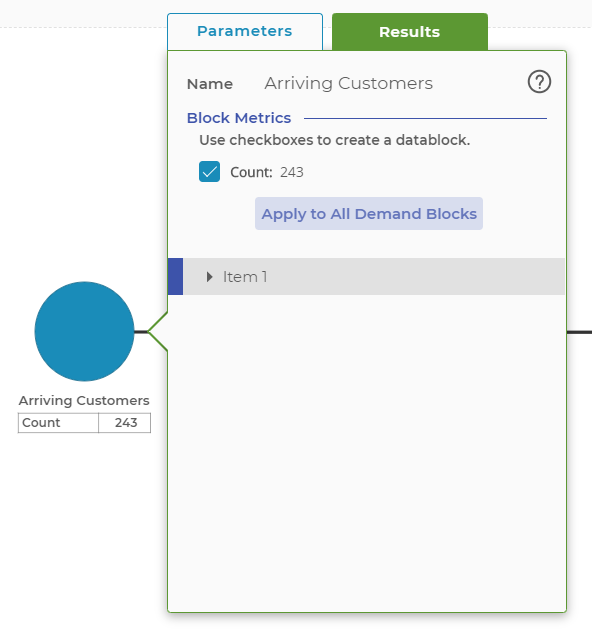
After the run is complete, you can double-click on any block to open the Parameters/Results window. Click on the "Results" tab to show the results of the run. Note the checkboxes available next to each of the result statistics. If you check one, the statistic will now show in a table underneath the block on the model, eliminating the need to double-click the block after each run to see your results.
For the Demand block, "Count" is the only result available. Count is simply the number of items the Demand block generated during the run. Note: Your exact numbers will most likely be different from the ones in these examples due to the variation in the model. This is normal and expected behavior. We will cover accounting for the variation in another lesson.
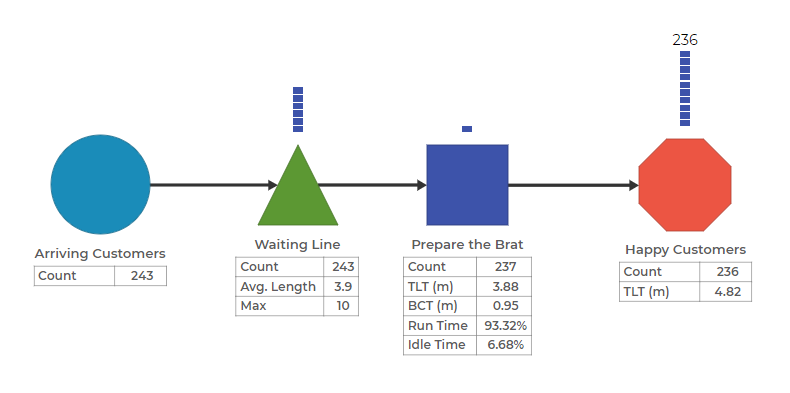
In the next image, you'll see a variety of results that have been set to display for each of the blocks in Kathy's Best Wursts. In general, some statistics may not be relevant for your particular model, so only turn on the display if the statistics are meaningful to you.
Numeric Results in Blocks
Below is a list of all possible results you might see – but remember, not all results will be displayed in all blocks.
- Current: The current count of items in the block at the end of the simulation run. The queue length chart shows a trend chart of the number of items in a block over the simulation run.
- Min: The lowest number of items observed in the block during the simulation run.
- Max: The highest number of items observed in the simulation run.
- Count: The number of items that arrived at the block during the simulation run.
- TLT: The average Total Lead Time of the items arriving at the block. TLT represents the entire time the item accumulates during the simulation run, up to entering the block where you are observing the TLT statistic. The TLT chart shows a histogram of the TLTs of all items that entered a block during the simulation run. Remember, TLT represents the accumulated time against the item throughout the entire life of the item.
- BCT: Block Cycle Time is the average time an item spent in the block. BCT typically is correlated to the processing time distribution you have selected but also may reflect setup and/or wait time if an item cannot leave a block when it has completed its task. The BCT chart shows a histogram of the BCT times for all items that have entered the block. Remember, BCT represents just the time the item spends in the block, so it is a very different measure than TLT.
- Avg. Length: This is the average length, or count, of items in the block.
- Setup Time: This result, only seen in the Activity block, represents the portion of time the block was engaged in setup activity.
- Run Time: This result, only seen in the Activity block, represents the portion of time the block was engaged in run, or processing, time.
- Idle Time: This result, only seen in the Activity block, represents the portion of time the block was sitting idle, waiting for work to arrive.
Chart Results in Blocks
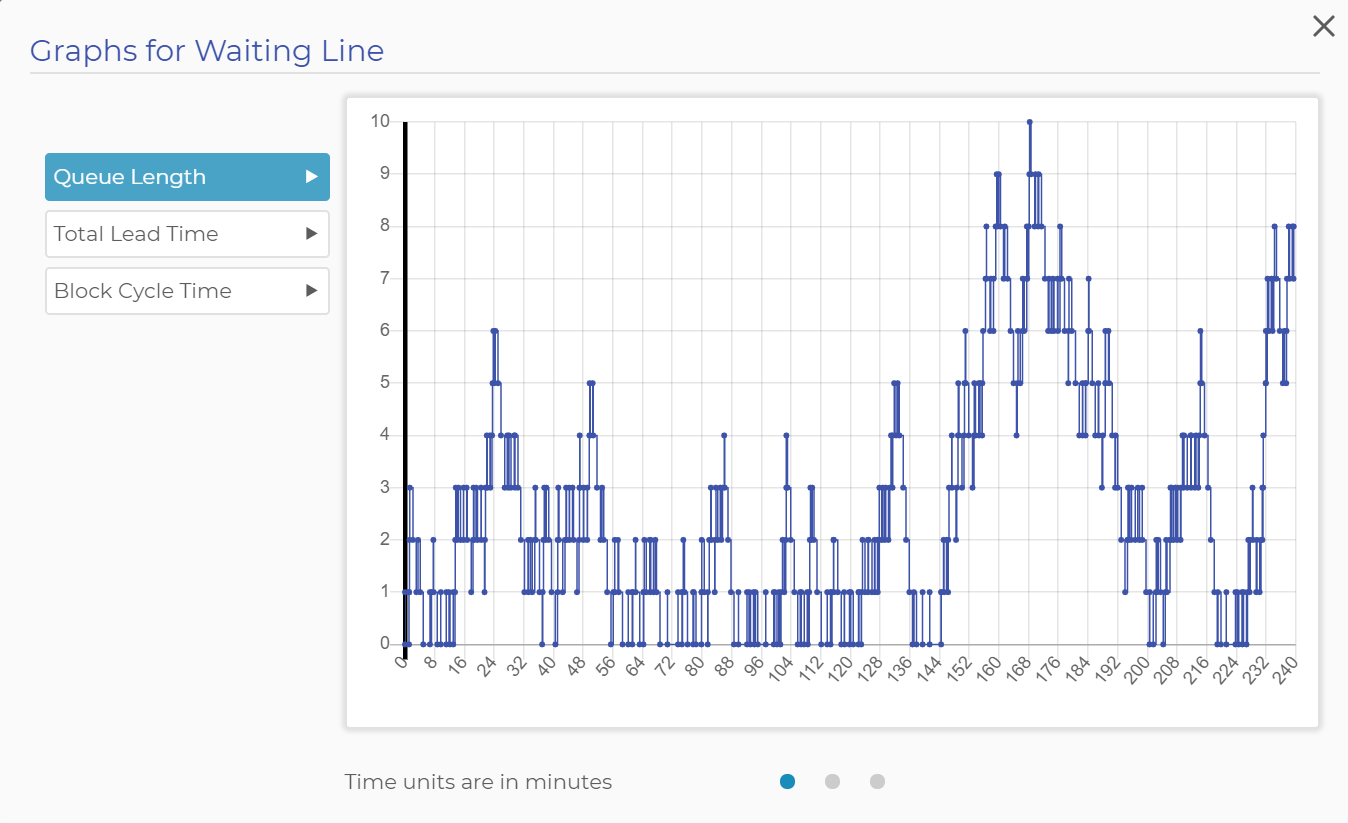
In addition to the numerical statistical results shown in the block, three charts are available in many of the blocks. These charts are shown in the images below and include:
- Queue Length: This chart shows the trend chart of queue length over the course of the simulation run. If specific items have been added to the queue block, this chart is available for the block as a whole or on an item-by-item basis.
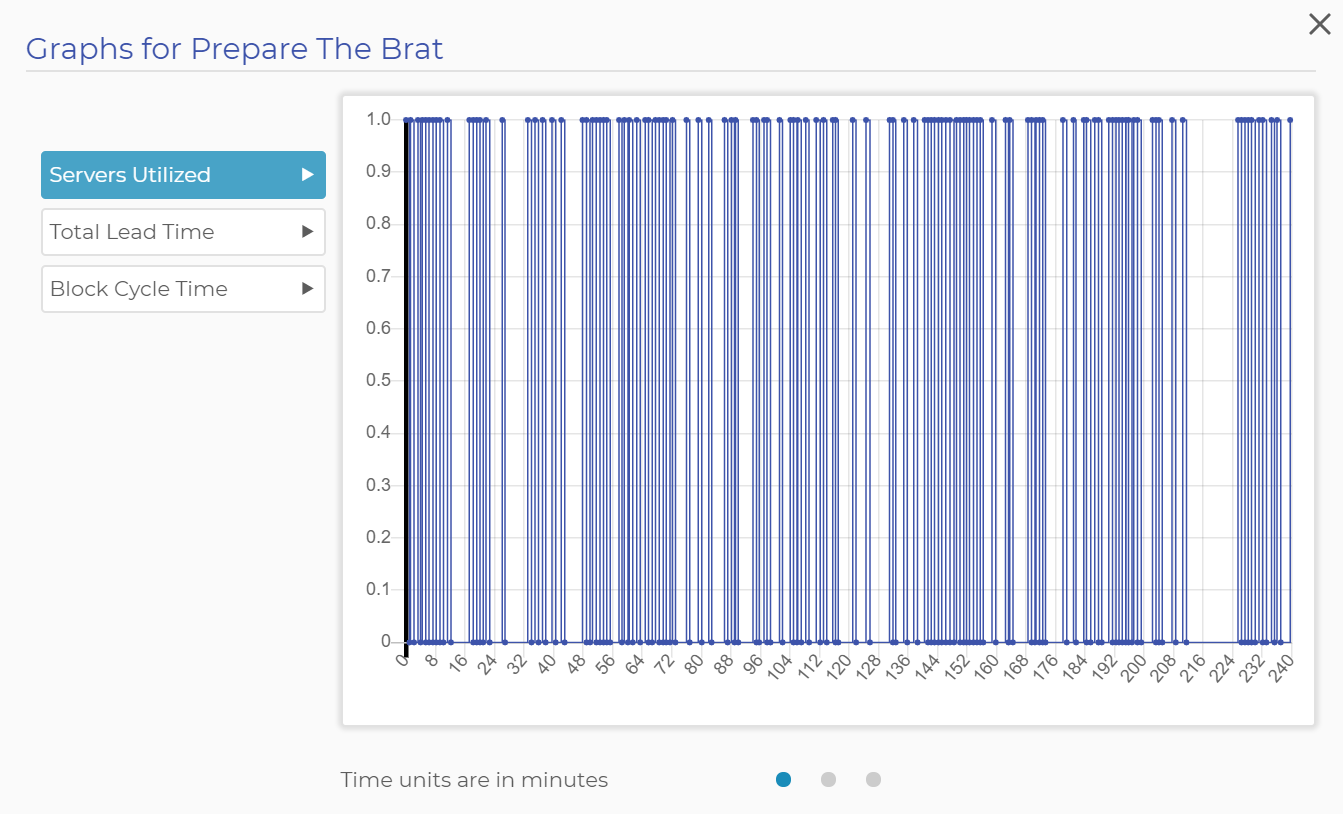
- Servers Utilized: This chart shows the usage of the servers in an Activity block. For a single server, the chart will just show vertical lines going up and back down between one and zero. Adding more servers to a block allows you to see how many are being utilized at any given time. In the chart, the width between the line going up and back down represents the random processing time you enter in the Activity block. The total amount of time the line is at the top versus the bottom represents the utilization percentage of the server(s).
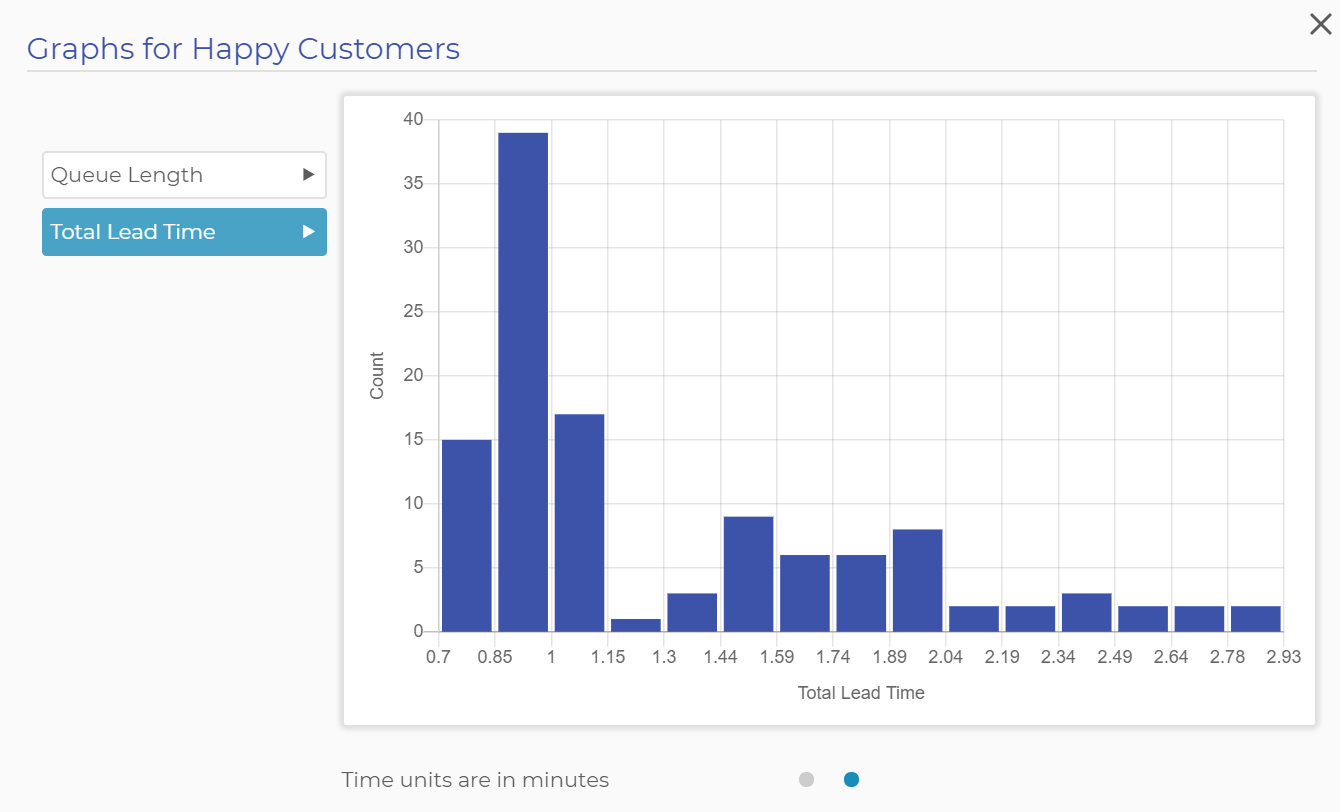
- Total Lead Time: This chart shows a histogram of the TLT of every item that has arrived at the block. Recall that TLT measures the entire lead time of an item from the point at which it was created until it enters a particular block.
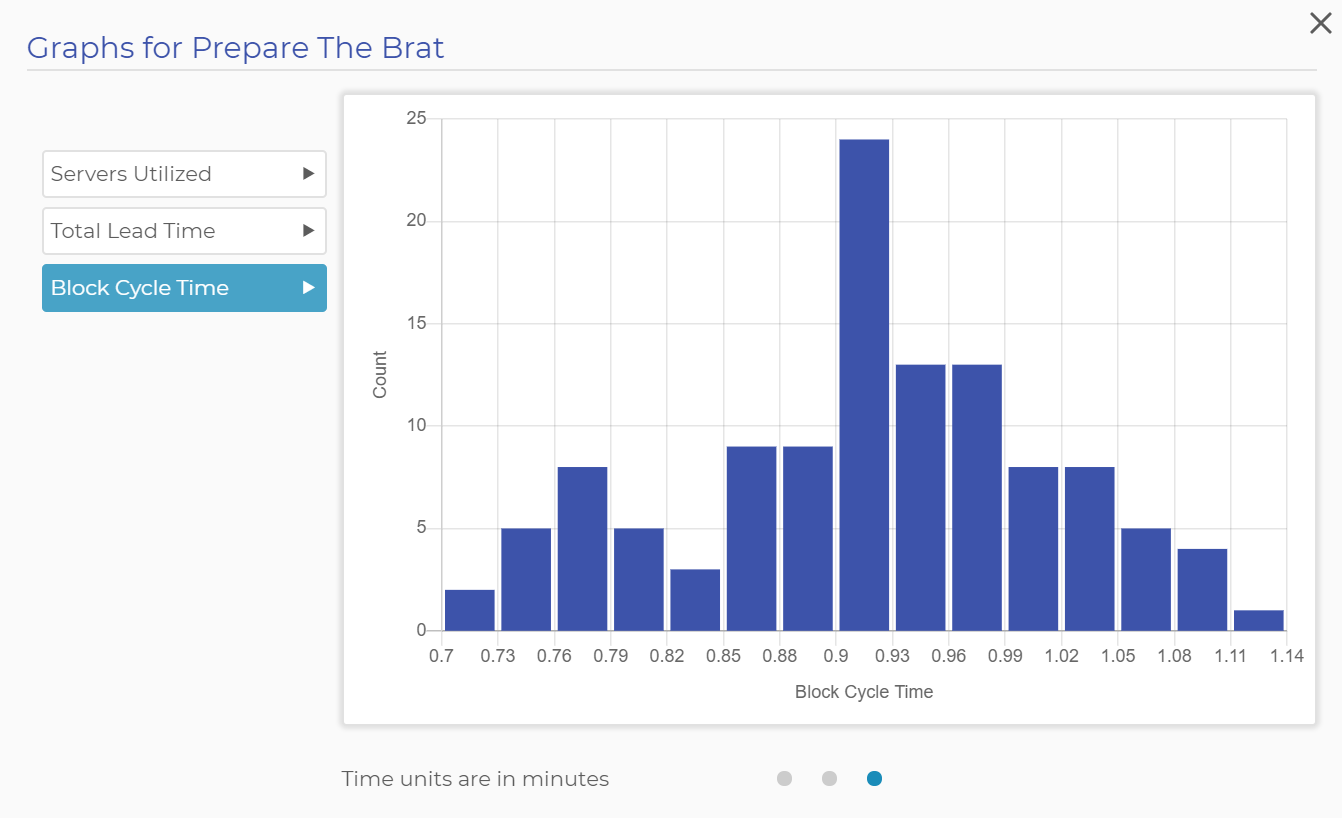
- Block Cycle Time: This chart shows a histogram of the BCT of every item that leaves the block. Recall that BCT measures the time the item spends in the block, including setup, processing, and wait time.
Was this helpful?