
Doubling Down
Follow Along
Choosing the Shortest Line
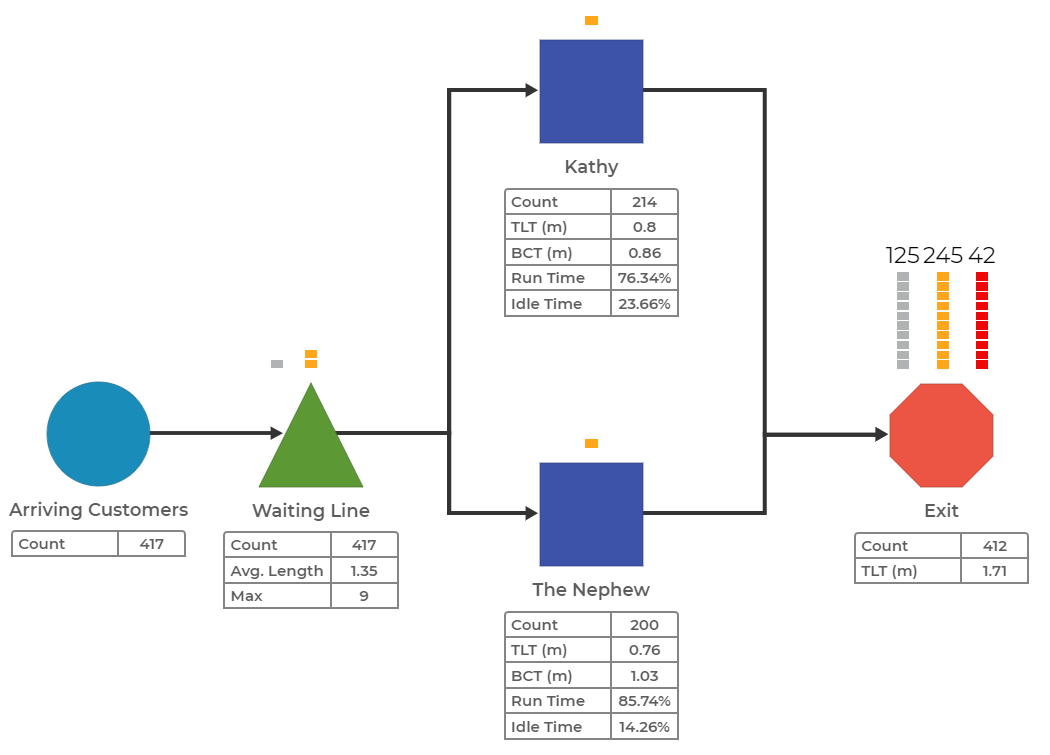
The last lesson ended with Kathy's Best Wursts selling three types of brats with the help of her occasionally motivated nephew. A model of her business currently looks like this:
Sales have been great, and Kathy has decided to add a second cart for the next event. The carts will be placed side by side and require two separate waiting lines from which customers will choose. Kathy assumes customers will always choose the shortest line.
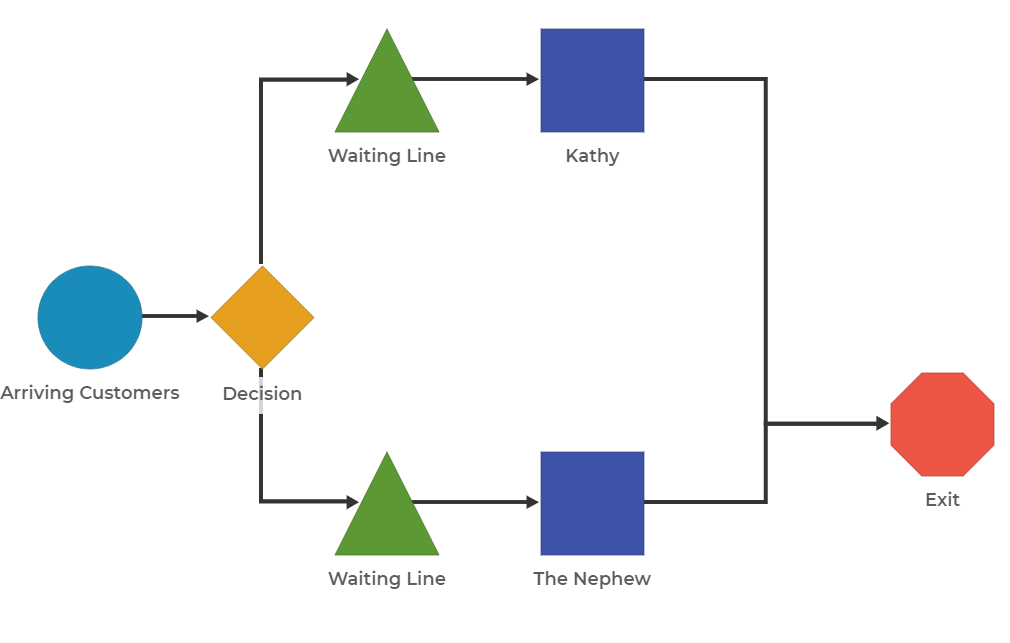
To model these changes, create a new iteration from the model you built in the last lesson and name it "Doubling Down." To build the new process, click on the connector line from the Arriving Customers block to the Waiting Line block, then press "Delete." Delete the connector going from the Waiting Line to Kathy as well, then copy the Waiting Line block and connect it in front of Kathy. Next, add a Decision block after the Arriving Customer block and in front of the Waiting Line blocks (there are two now). Your model should look like the image below.
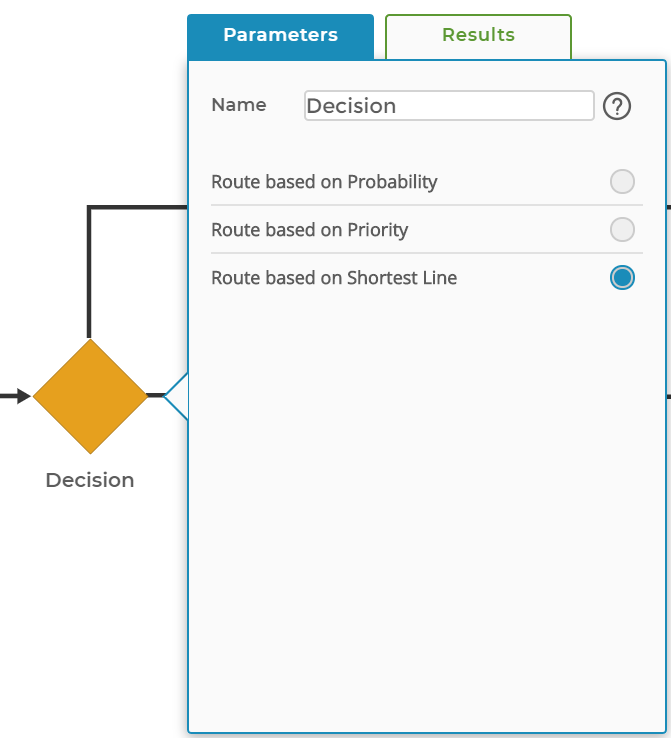
Next, open the Decision block and change the mode from "Assigned Probabilities" for each outbound path to the shortest line selection.
Modeling and Analyzing the Festival
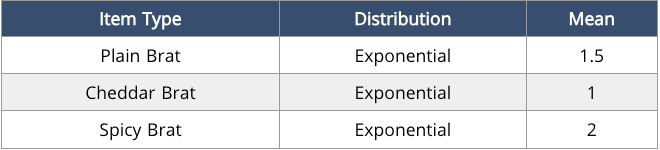
Since this is a large music festival, demand will be higher than in the past. Open the Demand block (Arriving Customers) and change the demand arrival time parameters to those listed in the table below.
Running Multiple Runs at Once
We'll continue working with Kathy's Best Wursts but we want to rerun the model multiple times. This allows us to examine both single-run and cross-run statistics. We’ll use the following parameters:

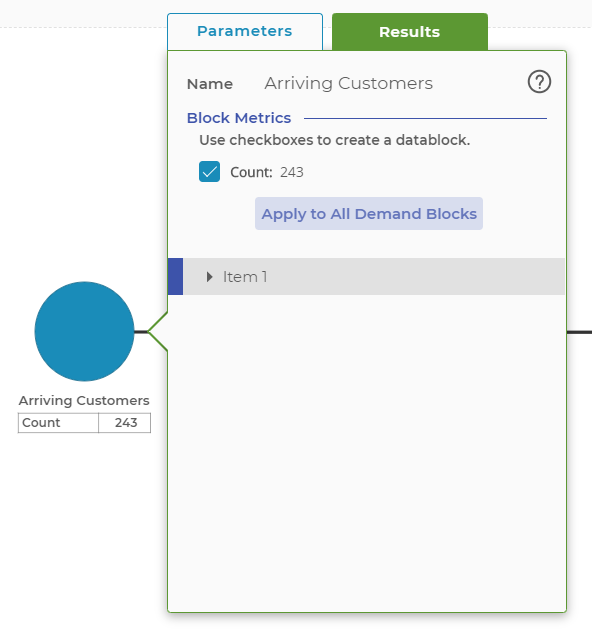
After the runs are complete, you can open the Results window as before by double-clicking on a block and clicking on the "Results" tab. Now, at the top of the window, you'll see the First Run / Cross-run switch. You can use this switch to toggle between the results of a single run (the first run of the series) or the results calculated across all of your runs – ten, in this example. Cross-run statistics will tend to be more stable and show the grand mean (mean of the means of each individual run) and standard deviation of the means (standard error of the mean).
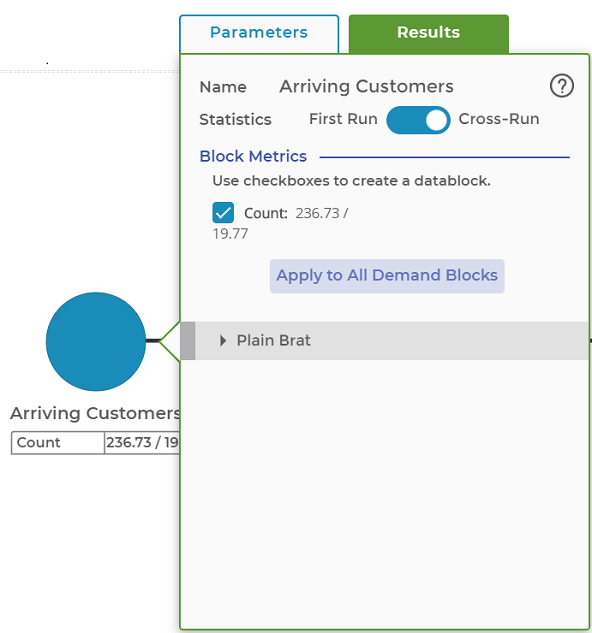
Let's look at the Demand block as an example. In the two images below, you can see the difference between the single-run (top) and cross-run (bottom) statistics. Note that the cross-run statistics show both the grand mean and the standard deviation of the means in Mean / Std. Dev. format.
Analyzing Festival Data
If you haven't already, run 10 runs of the new process model for 240 minutes. What do the results show?
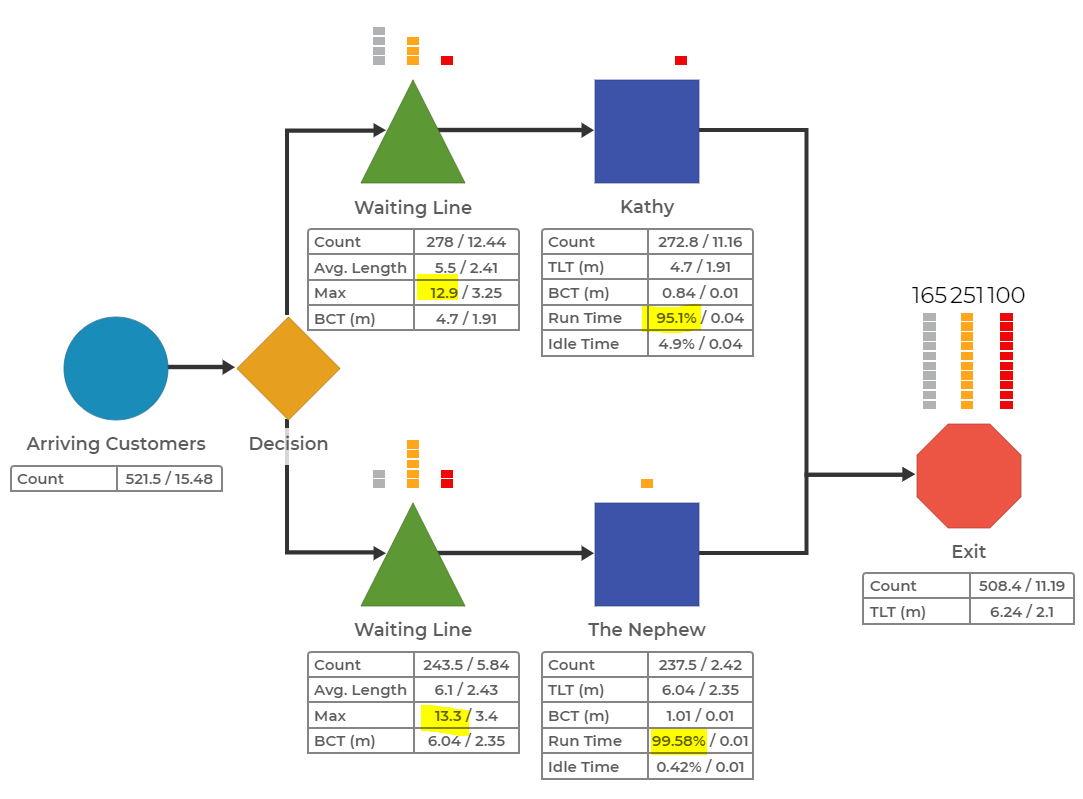
The festival was a great success! Over 500 brats were sold but a few concerns arose. Kathy and her nephew were busy (over 95% utilized) and the lines grew very long at times. Kathy is concerned that she may have lost customers. Below are the queue length charts for Kathy and her nephew (the Waiting Line blocks were renamed "Waiting Line — Kathy" and "Waiting Line — Nephew").
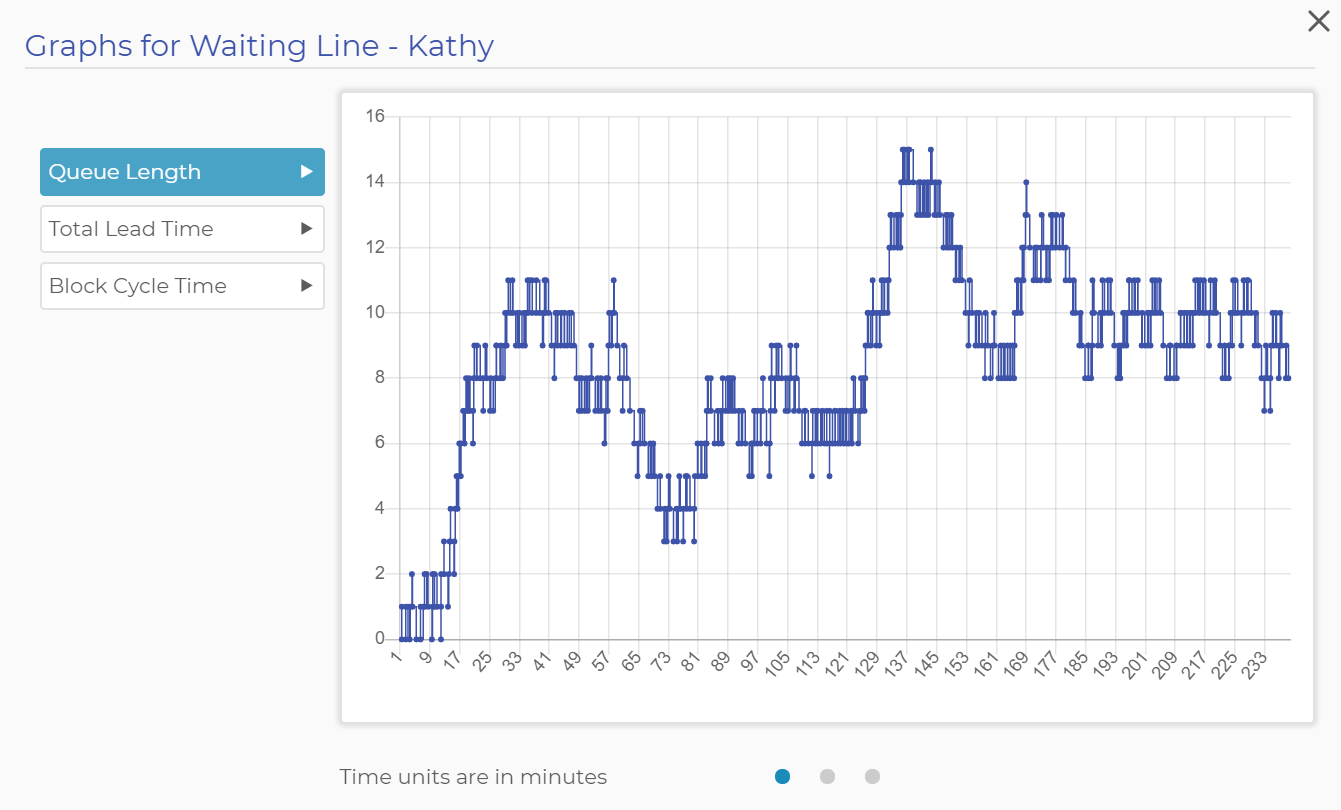
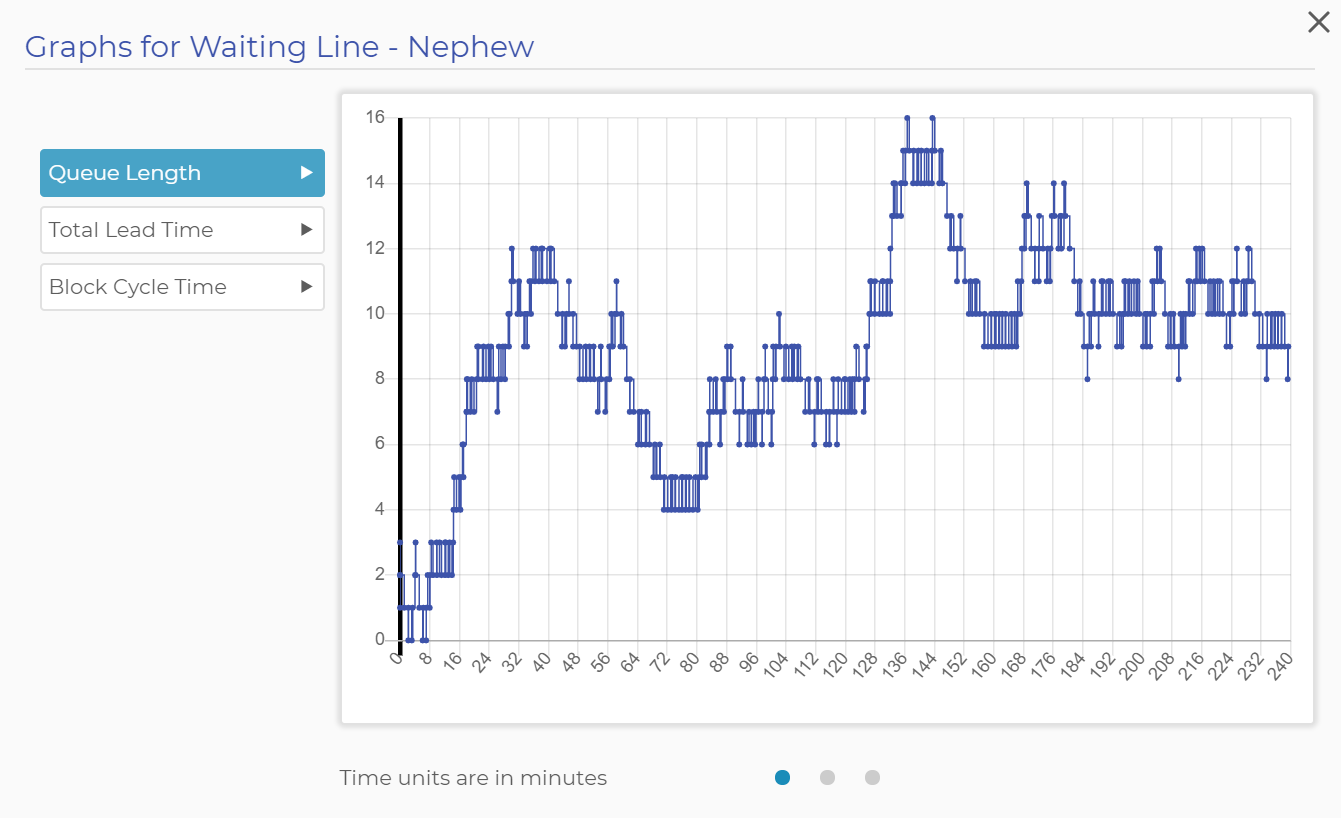
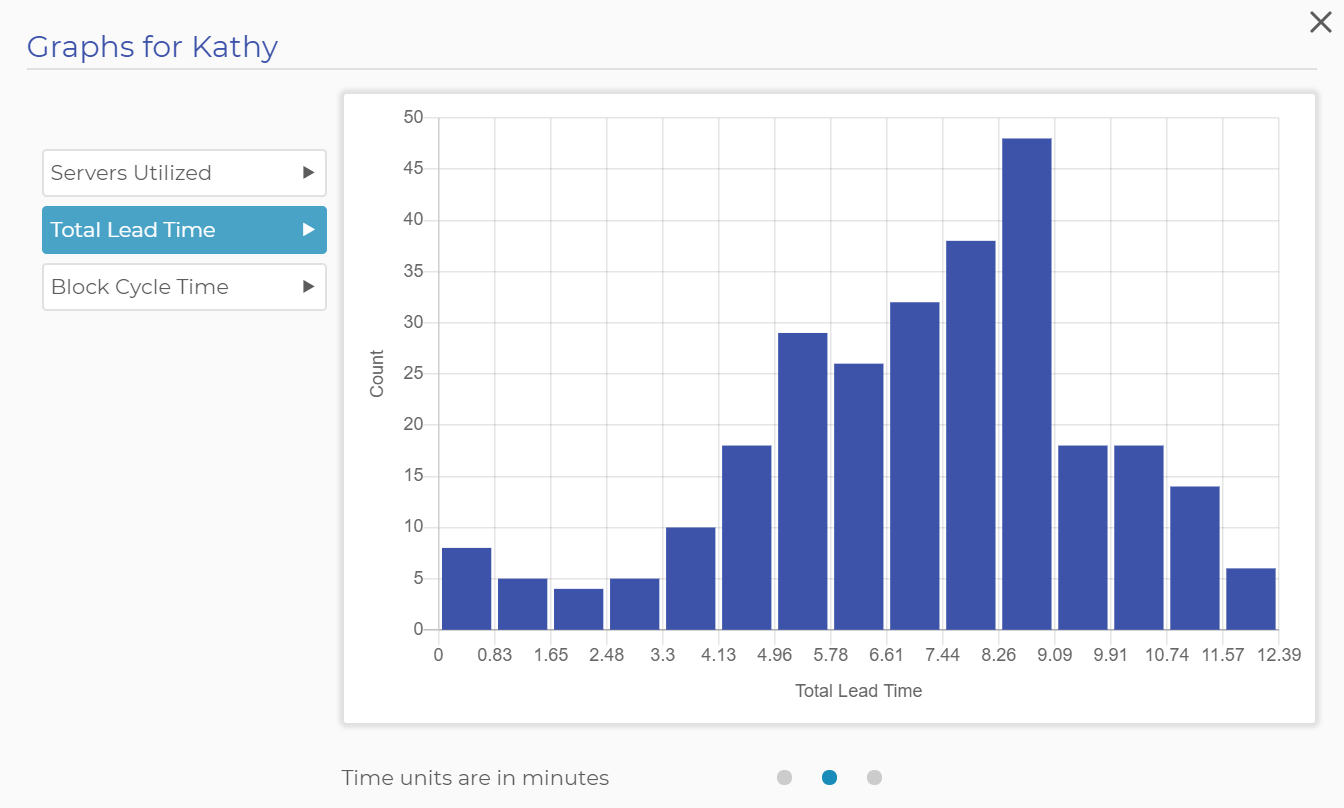
The waiting line queues appear to be stable and in control, but with as many as 16 people in line at one time, Kathy is sure she lost some customers. Looking at the histogram for TLT in each of the Activity blocks helps her understand the distribution of wait times in the line. TLT measures the entire accumulated time in the process up to entering the block where you view the TLT chart. In this model, the only block prior to the Activity block is the waiting line, so the TLT chart is a chart showing the distribution of time waiting in line.
Modeling Customers Lost (Balking)
Looking at the chart, Kathy is concerned. The time between band changes at the festival is only 15 minutes. Kathy is concerned that anyone who waits longer than 10 minutes in line will leave the line (balk) and go find food at another cart.
To model the action of customers balking from the waiting line, start by adding two additional Exit blocks on the right side of your model, above and below the current Exit block. Name the blocks "Kathy - Balked" and "Nephew - Balked". Next, open the Parameter windows for Kathy’s waiting line queue. In the Parameters window, enter 10 for the "Balk at time" parameter, BCT for the "Balk based on" parameter, and select the new "Kathy - Balked" Exit block as the balk target. Repeat the operation for the nephew's waiting line using the appropriate block in the balk target.

Next, run 10 runs for 240 minutes. Your model should end up looking like this:
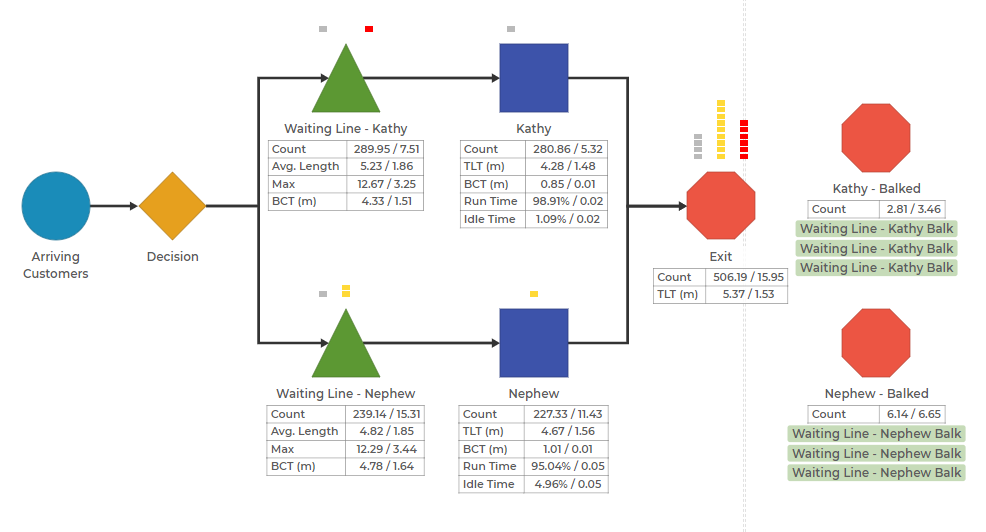
Was Kathy right to be worried about losing customers? On average, Kathy lost two or three customers and her nephew only lost six or seven (your random results will vary). Kathy is happy, despite the variation, but also a bit tired. Sales are strong but she is concerned with how busy she and her nephew are. Neither of them had time to restock toppings during the festival and Kathy is concerned that she may not be stocking the right amount. In the next lesson, we will build a new model to model the inventory management of Kathy's Best Wursts.
This ends our free course. Want more lessons? Contact us for additional Process Modeling training.
Was this helpful?