
Distributions
The distributions dropdown is used in multiple blocks to define the mathematical distribution that generates random numbers. Those random numbers may represent the time between arrivals for the Demand Block or the processing or setup time in an Activity Block.
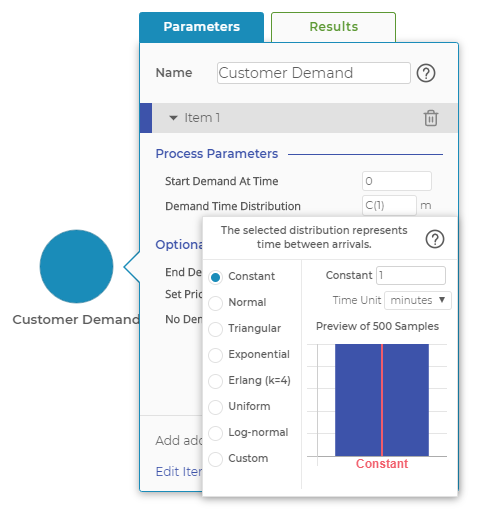
Select from a series of different distribution options and input your own parameters.
The following distributions are available in the distribution pop-up window:
- Constant is a single, constant, non-random number. You can enter any positive real number.
- Normal represents the normal distribution. You need to enter the mean and standard deviation values you would like to use. Again, any positive real numbers are allowed. Because the normal distribution is a continuous distribution, it can generate negative random numbers if the standard deviation is sufficiently large and the mean is sufficiently close to zero. If a negative random number is generated, it will be truncated to zero. In general. Use caution with this distribution to ensure truncation does not become a problem.
- Triangular represents the triangular distribution and is the most common distribution used to model setup and processing times in simulation modeling. The triangular distribution requires the mode, minimum, and maximum parameters, which compose its shape. This distribution is popular as it defines a specific minimum value, which often corresponds to the pure value-added time of the task. The maximum value defines the maximum time for the task, which often corresponds to the point where the process changes and management intervention is required for task completion. The mode represents the most frequently occurring value, while the mean of the distribution can be calculated as (min + mode + max), divided by 3. The triangular distribution is a reasonable approximation of near-normal processes, with the benefit of fixed endpoints and a little extra kurtosis, the latter of which generates more random numbers near the mean than a true normal distribution would.
- Exponential represents the exponential distribution. In Process Playground, the parameter entered is the mean time between arrivals, rather than the more conventional rate parameter often used for the exponential distribution. Mean time between arrivals is used because it also is the time used to schedule the future demand events in the simulation. Mean time between arrivals is represented by the Greek character μ (mu), while the rate of arrivals is the Greek character λ (lambda). μ is equal to 1 / λ. With the exponential distribution, the standard deviation is equal to the mean, a unique distinction. This distribution is highly variable and often used to model arrivals in a high-speed transactional environment, such as a call center or stock-trading floor. No negative values are generated, negating concerns about truncating negative values.
- Erlang represents the Erlang distribution with the shape parameter k = 4. The Erlang distribution is useful for modeling cycle-time data as it is skewed right but does not generate any values below zero. The Erlang distribution is generated by summing a number of Exponential random numbers - in our case 4, the value of the shape parameter. The only parameter required is the mean.
- Uniform represents the real-number, uniform distribution. The minimum and maximum values are entered, and all values between the minimum and maximum are equally likely.
- Log Normal represents the log-normal distribution. This distribution is similar to the Erlang distribution in that it is skewed right and produces no negative values. Both the Erlang and log-normal distributions often are used to generate service times.
- Custom allows you to generate a list of numbers to upload a series of numbers that represent whatever random distribution you select. You can use multiple distributions or actual process data to create your list of numbers. Process Playground will randomly draw from your list and use that result as its random number. Because the random numbers are being pulled from your list, any biases in your list of numbers will be reflected in the simulation run. Be sure to populate your list with many more numbers than will be required in the simulation run. For instance, if 100 random numbers will be used, several thousand should be included in the list. Process Playground can handle exponentially more numbers, but it’s likely that several thousand to 10,000 will be sufficient.
Was this helpful?