
Skill Check Scores Widget
Dashboard View
In the Dashboard View of the Skill Check Scores widget, box plots representing the distribution of student skill check scores for each session of the selected course are displayed, along with the "Median Average Score," which is the median value of all students’ average skill check scores.

Reading a Box Plot

The topmost line of each box plot represents the maximum score achieved.
The top line of the box itself represents the upper quartile (75th percentile).
The line in the middle of the box plot represents the median score.
The bottom line of the box itself represents the lower quartile (25th percentile).
The lowermost line represents the minimum score, excluding outliers.
Outliers are represented by red dots to make them easy to identify. Hovering your cursor over these outliers displays the students’ names, if there are three or fewer, and the number of outliers if they exceed three.
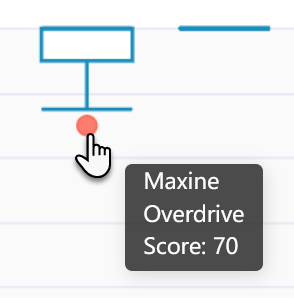
Hovering your cursor over a box plot will display the number of students, n, represented in the plot, along with the upper quartile, median, and lower quartile scores.

Expanded Dashboard View
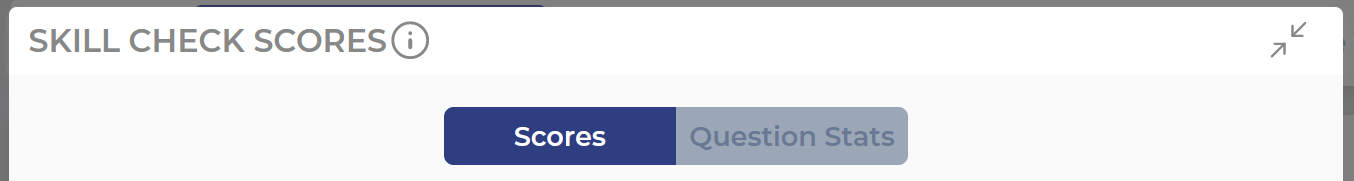
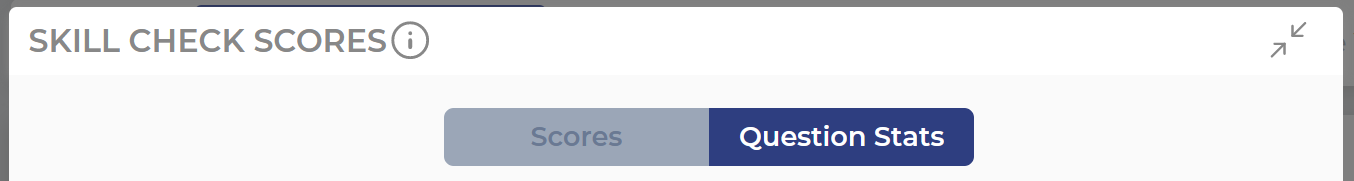
The expanded view of the Skill Check Scores widget is split into 2 sections: Scores and Question Stats.
Scores
The Scores page provides an in-depth look at students' accuracy answering the questions as well as a look at how many of the questions they have answered per session.
The bar chart at the top of the Expanded Dashboard View presents the distribution of students’ average skill check scores, along with the median score, high score, low score, and standard deviation. Hovering your cursor over a given bar provides the number of students who achieved that average score.

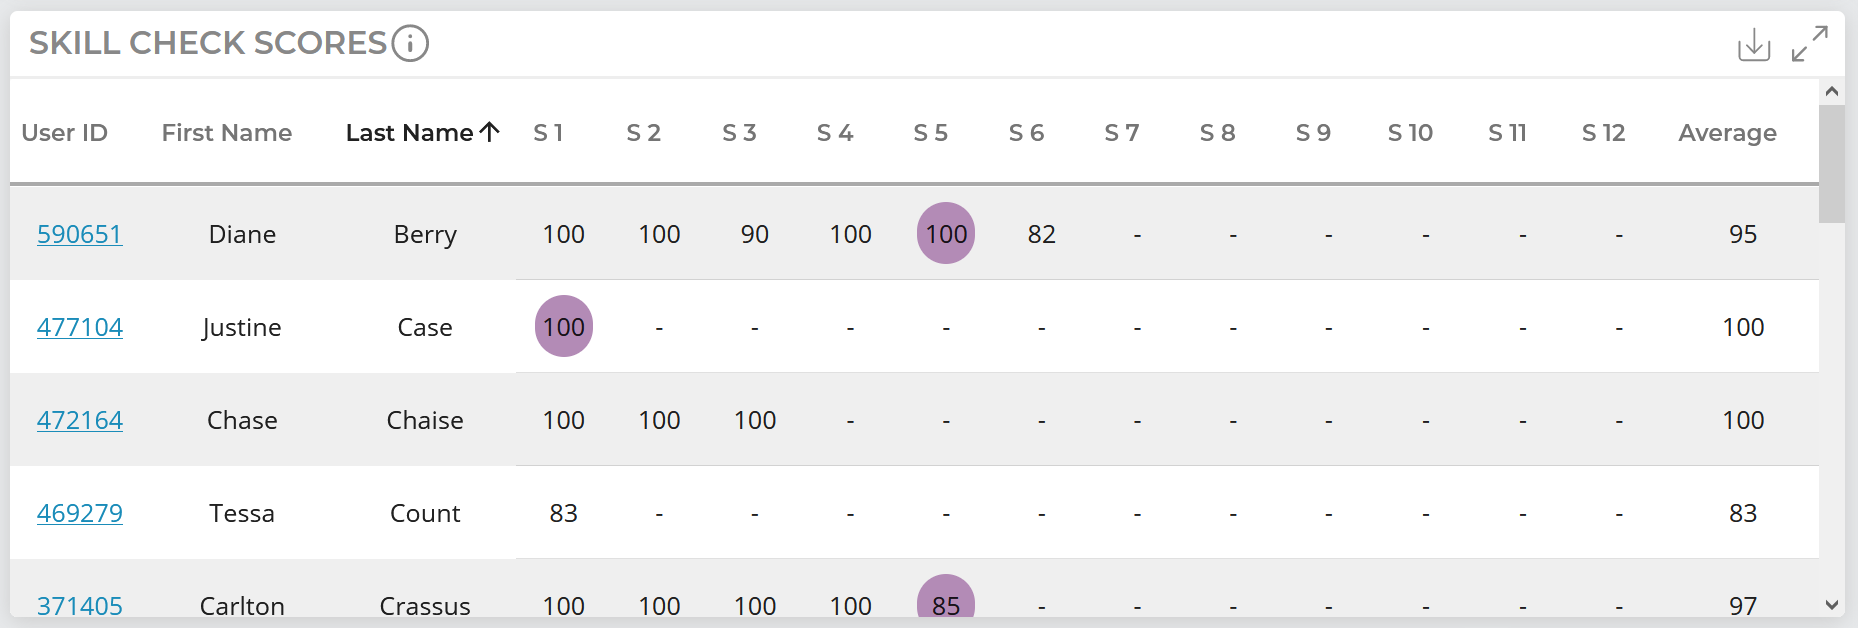
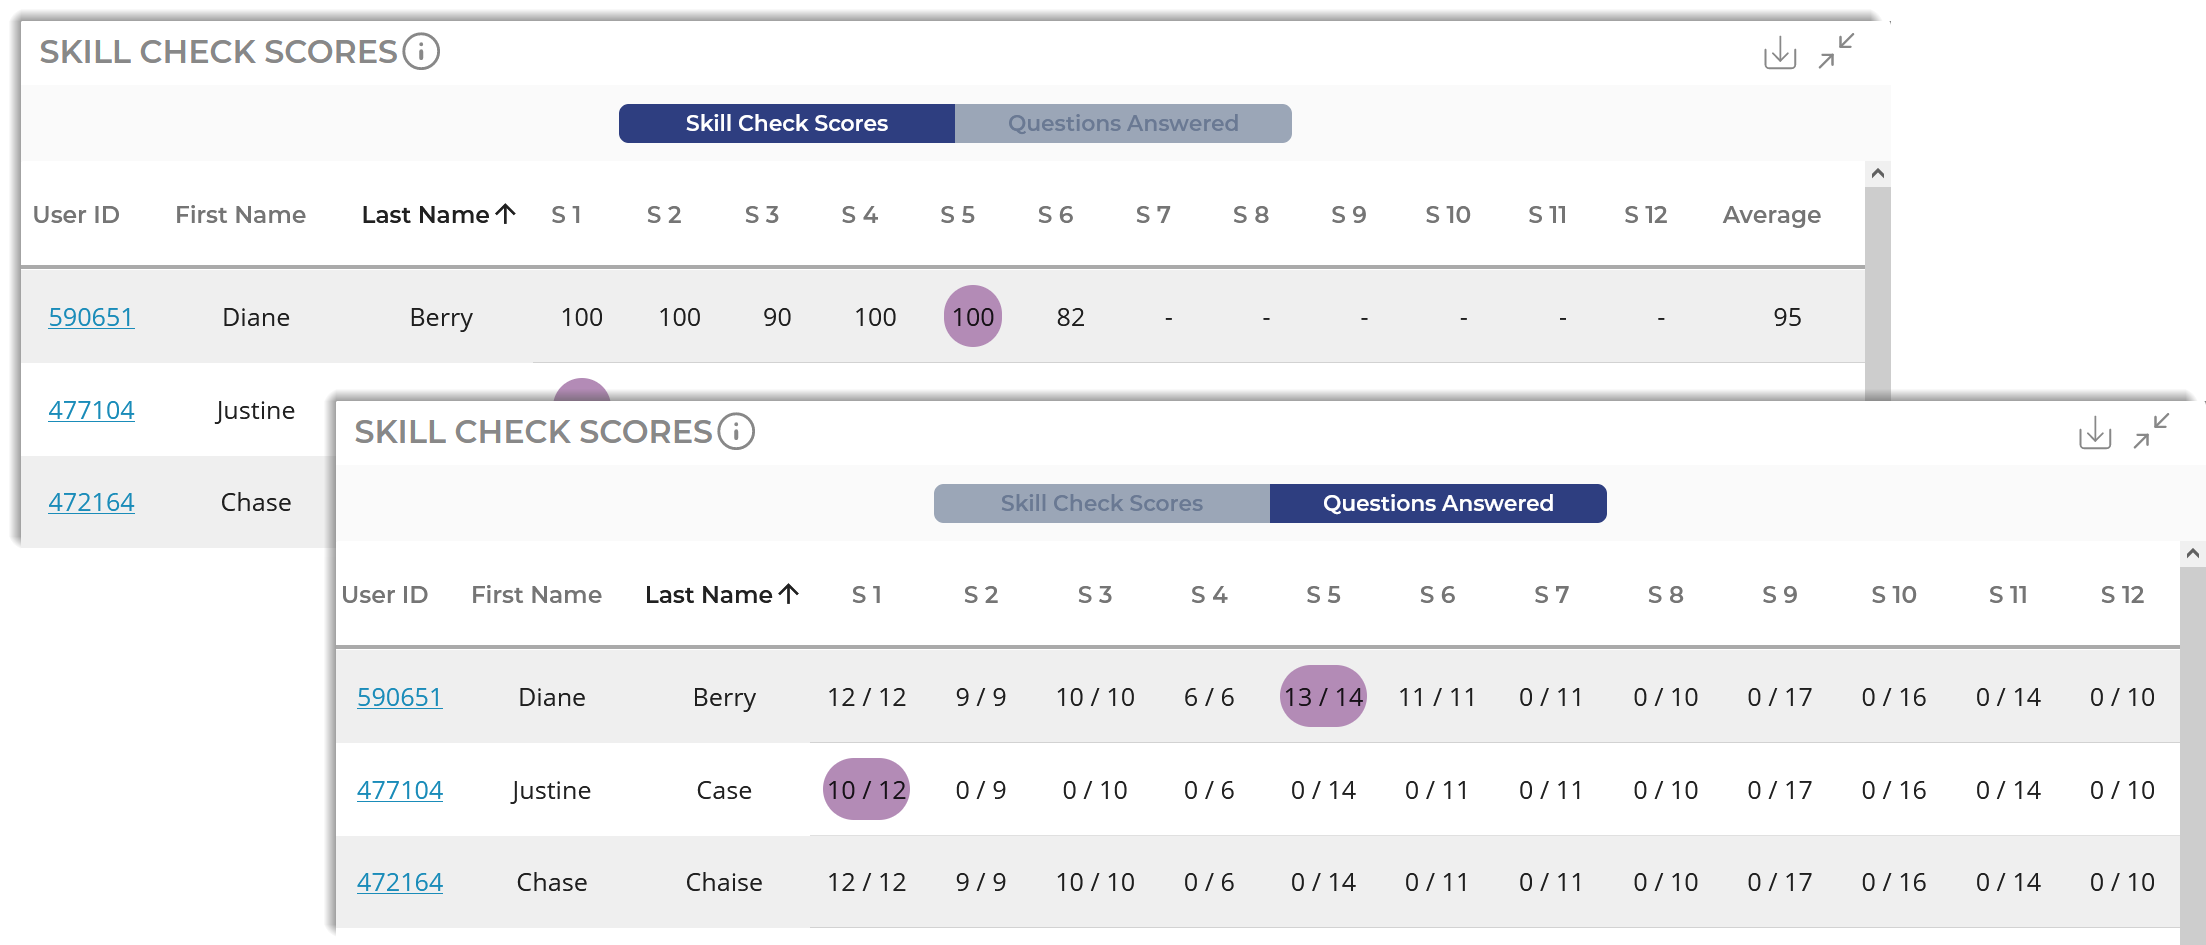
Skill Check Scores
This table presents every student’s skill check scores for each session of the selected course, along with their average skill check score in the rightmost column.
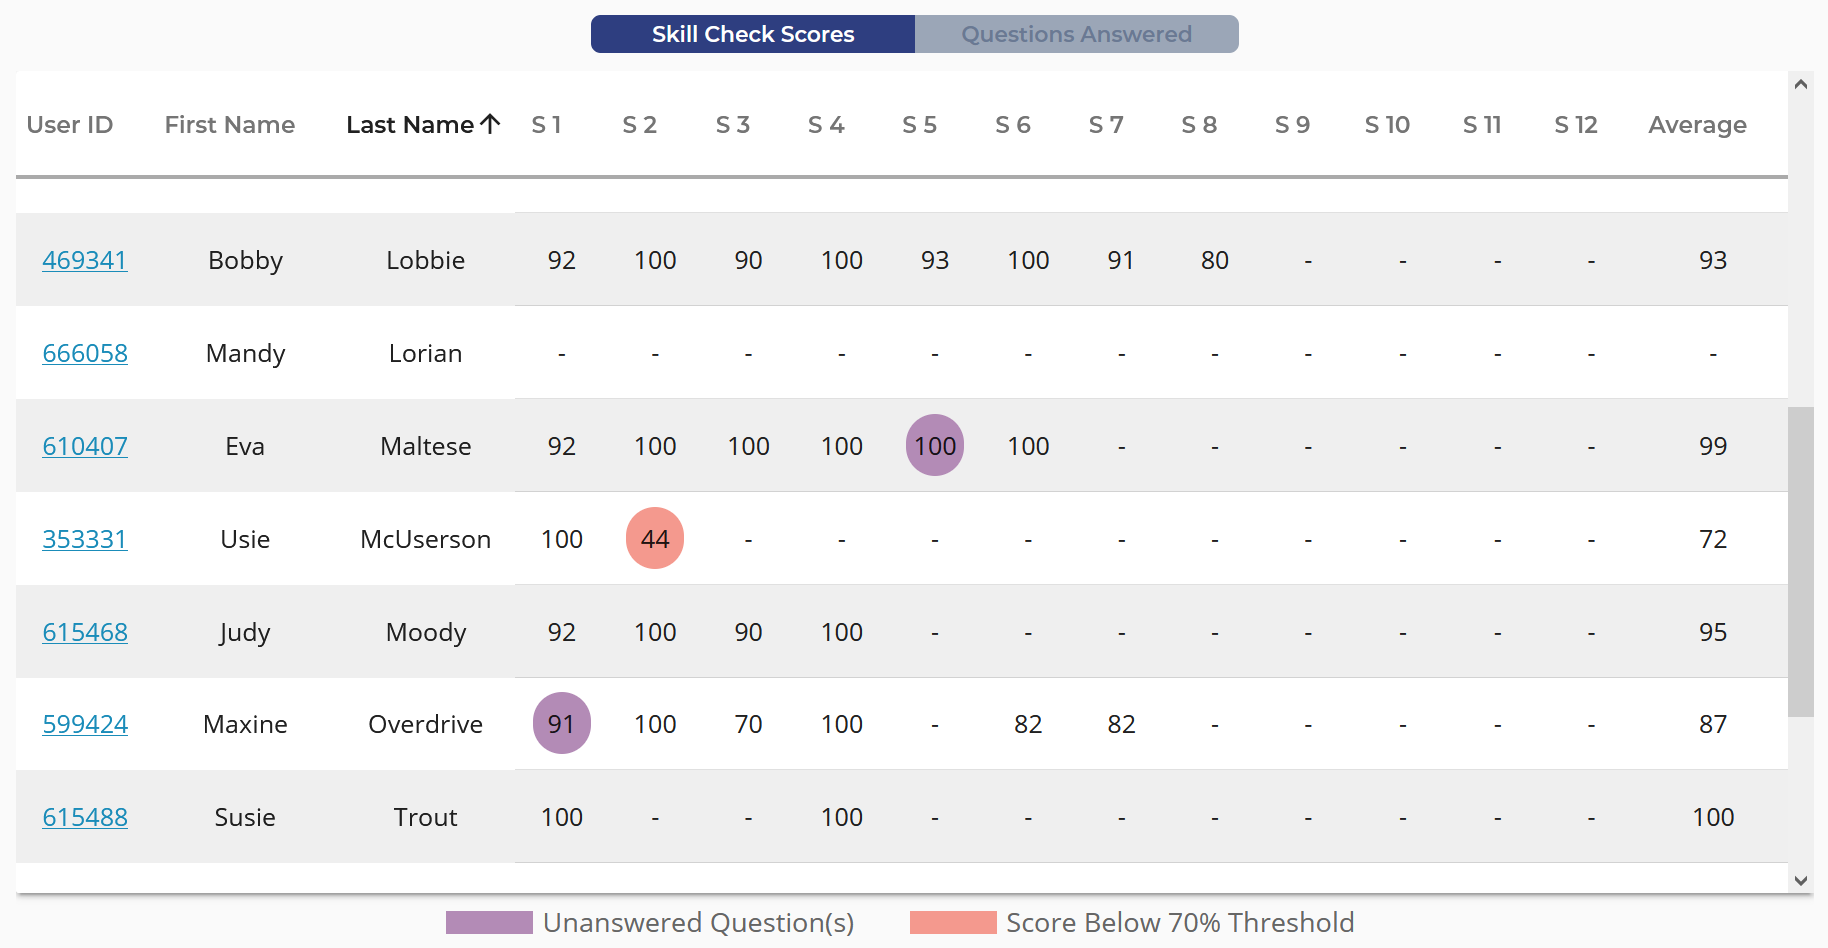
Purple circles indicate skill checks that have unanswered questions.
Red circles indicate completed skill check scores that are lower than 70%. Students whose scores are lower than 70% but who also have unanswered questions will be highlighted in purple, as their final results might change as more questions are answered.
Sort this table by any column - by first or last name alphabetically, by ascending or descending results from any given session, or by skill check average.
Questions Answered
Click "Questions Answered" to view this table which presents data on the number of skill check questions that a student has answered out of the total questions in that session. This table does not reflect accuracy in answering the questions, only completion.
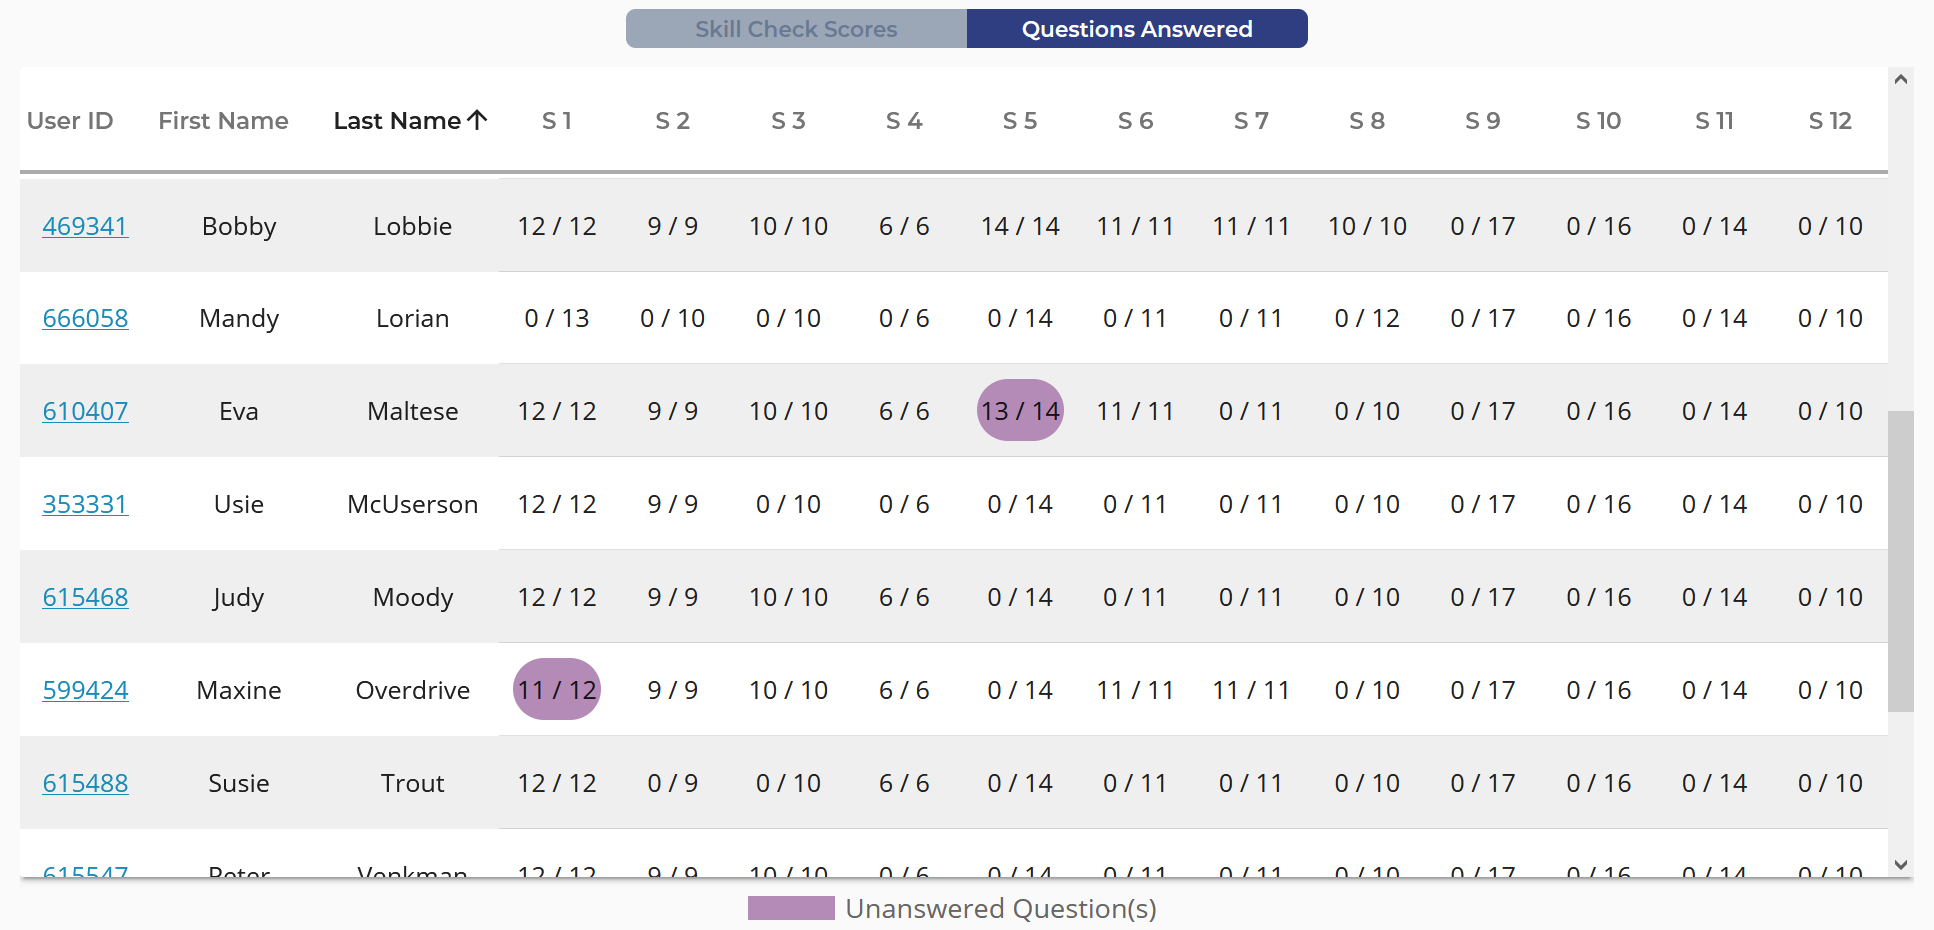
Purple circles indicate skill checks that have unanswered questions.
Question Stats
Clicking "Question Stats" at the top of the widget will open up extensive data on each question in each session.
The skill check questions for each session are represented by a card and laid out horizontally in this table. Click the "View Question Card Key" in the bottom-right corner to see how to interpret the data on the question cards. Click the same button to hide the card key. You can also filter the cards by session by using the drop-down above the table.
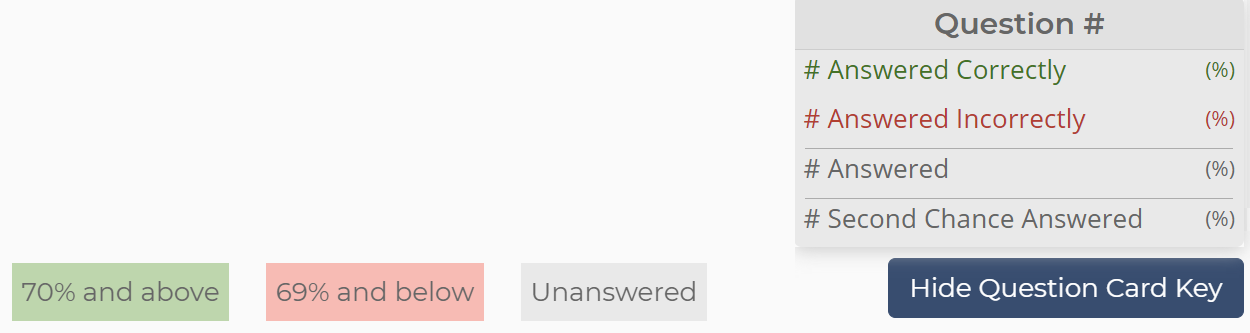
For the user population in this report, 70% or more of the users got this question right, as indicated by the color green.
Red indicates scores below 70%, and questions that have not yet been attempted will show up grey.
Underneath each question number, in order from top to bottom, view the number and percentage of students who answered correctly, answered incorrectly, attempted the question, and finally students who answered a second chance question.
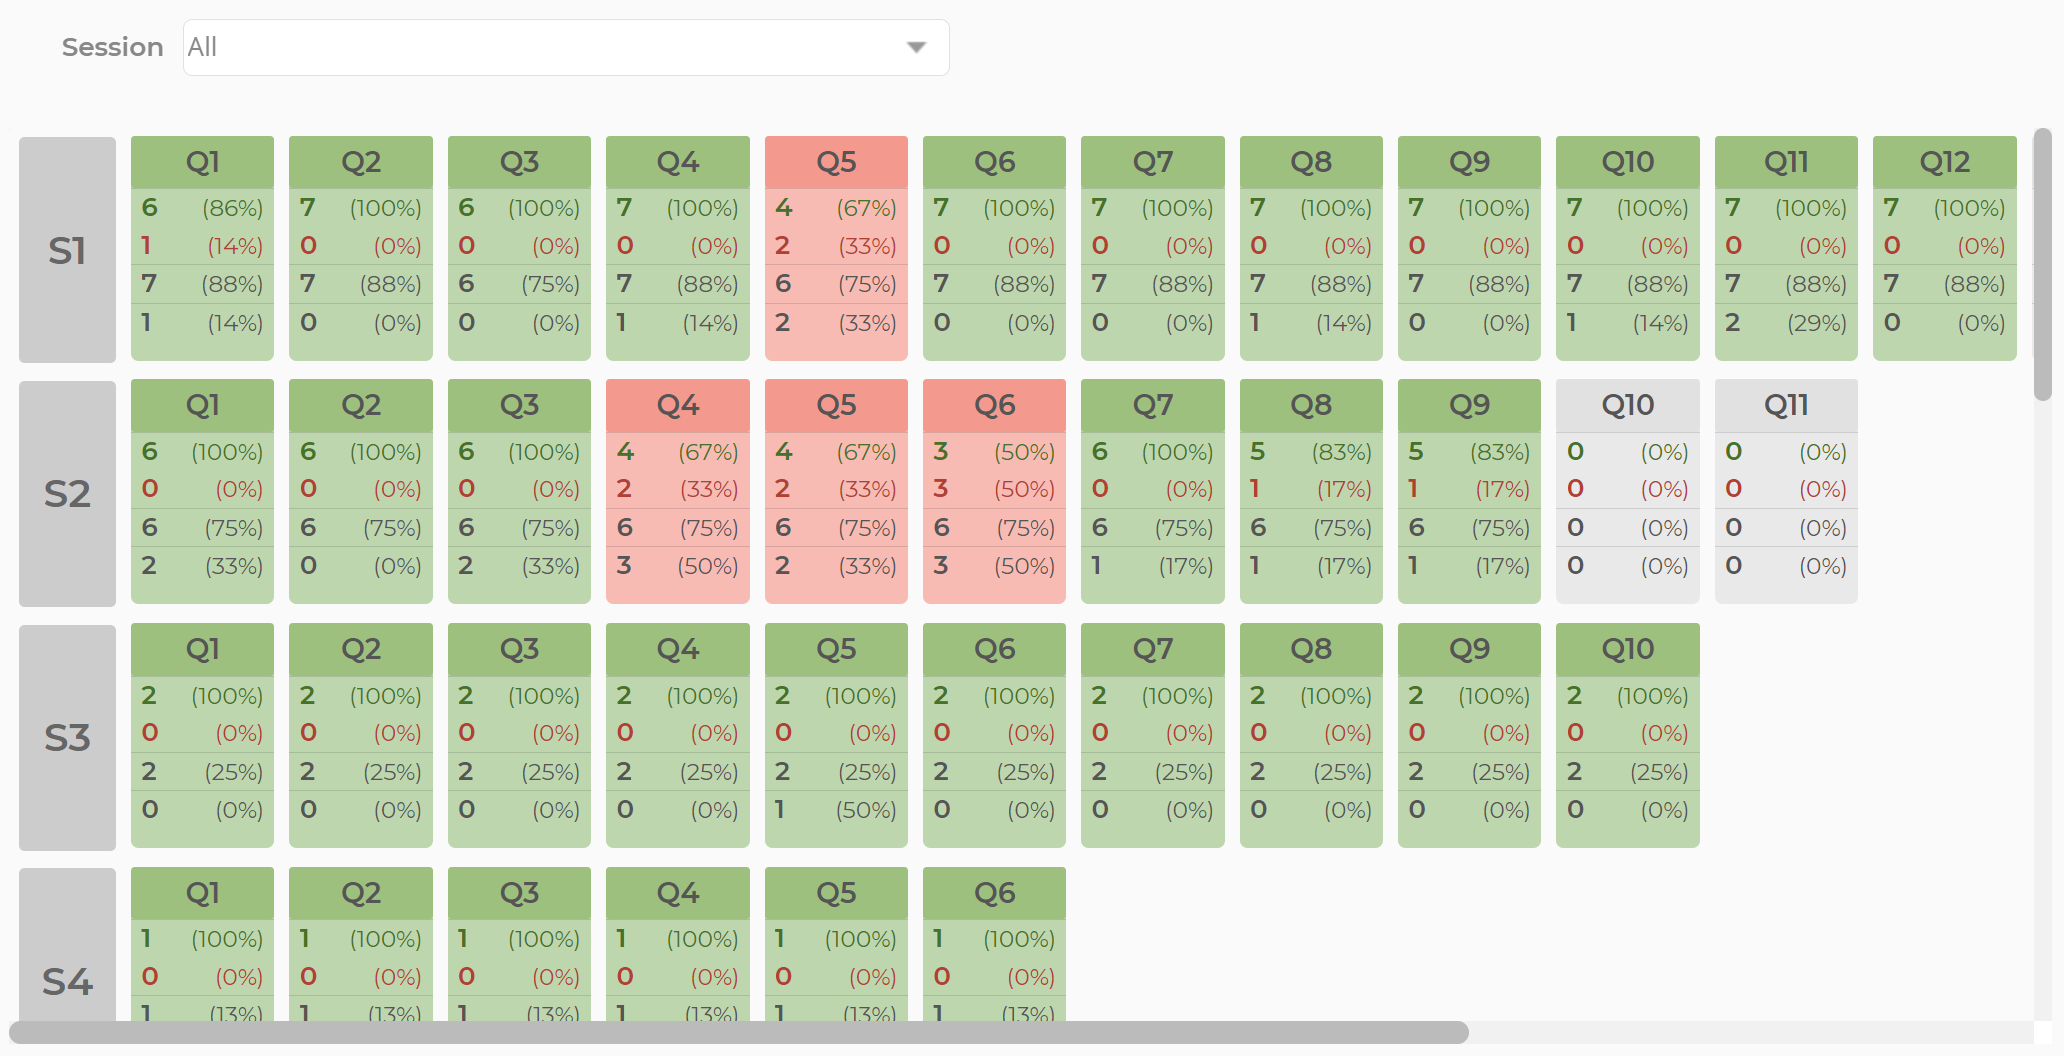
Click on any given question card to view the question details including the first and second chance questions, their answers, and how each student answered them.

Table View
This table presents the same information found in the Expanded Dashboard View: Skill Check Scores.
Download this data as a CSV using the download icon in the top right of this widget.
Expanded Table View
This view provides the same data as Table View but expanded to improve readability. It also includes the Scores vs. Questions Answered views.
Was this helpful?