
Course Progression Widget
Dashboard View
This bubble chart offers a visual overview of where students are in the course, organized by session. The bigger the bubble, the more students in the session. Hover over a bubble to view the exact number of students in a given session. Switch to Table View to see the students’ names.
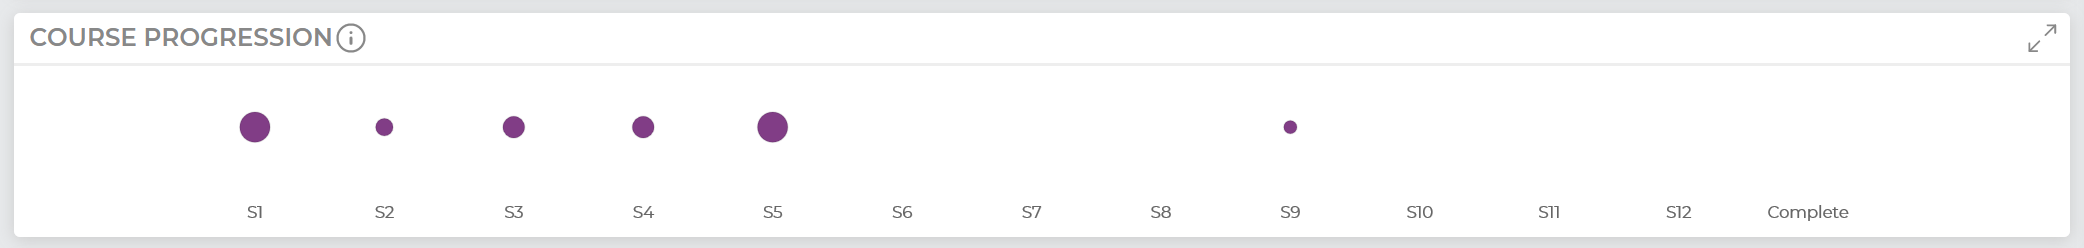
Dashboard view displays students' locations in the course based on the next incomplete session. That is to say, if a user completed the session 2 skill check, they will appear as being in session 3. If a user did not answer all the questions in session 2, they will continue to appear as being in session 2 despite completing later sessions.
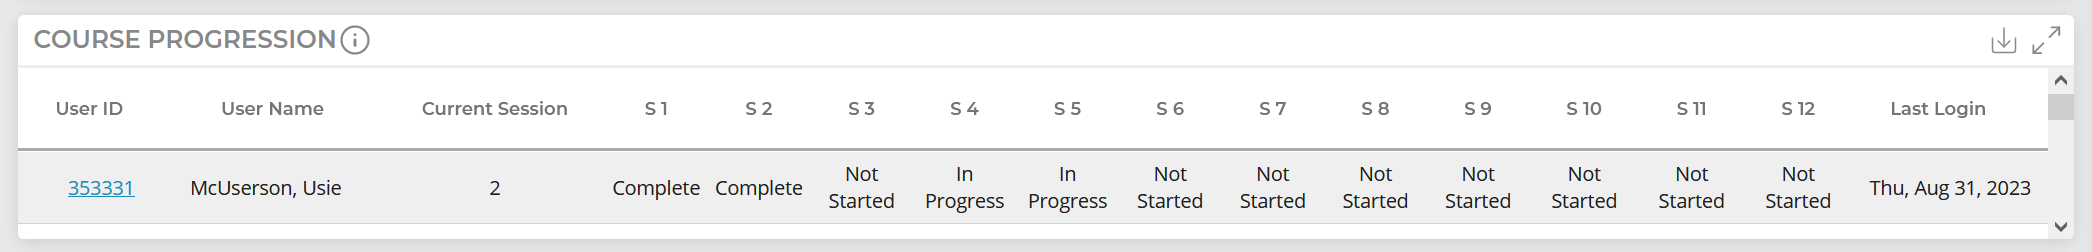
Expanded Dashboard View
This table displays the current session the students are on, what progress has been made on each session, and the date of their last login.

Refer to the key at the top of the widget to learn how to read the table. The map pin icon notes a student's current location in the course. A purple box denotes sessions where lesson pages have been viewed but the skill check for that session has not been completed. The green box with a check mark means the student has completed the skill check for that session while a gray box means no lesson pages have been viewed in that session.
Contrary to the Dashboard view, Expanded view displays students' locations in the course based on what lesson page they are currently viewing.
Table View
This table provides a quick look at each student’s location in the course based on what lesson page they are currently viewing, organized by session. Scroll down to view more students, and scroll right to view more sessions.
Download this data as a CSV using the download icon in the top right of this widget.
Expanded Table View
This view provides the same data as Table View; the only difference is that it is expanded to improve readability.
Was this helpful?