
Course Engagement Widget
Dashboard View
Each bar in this bar chart represents the average engagement percentage for the student population for a given side link or practice type.
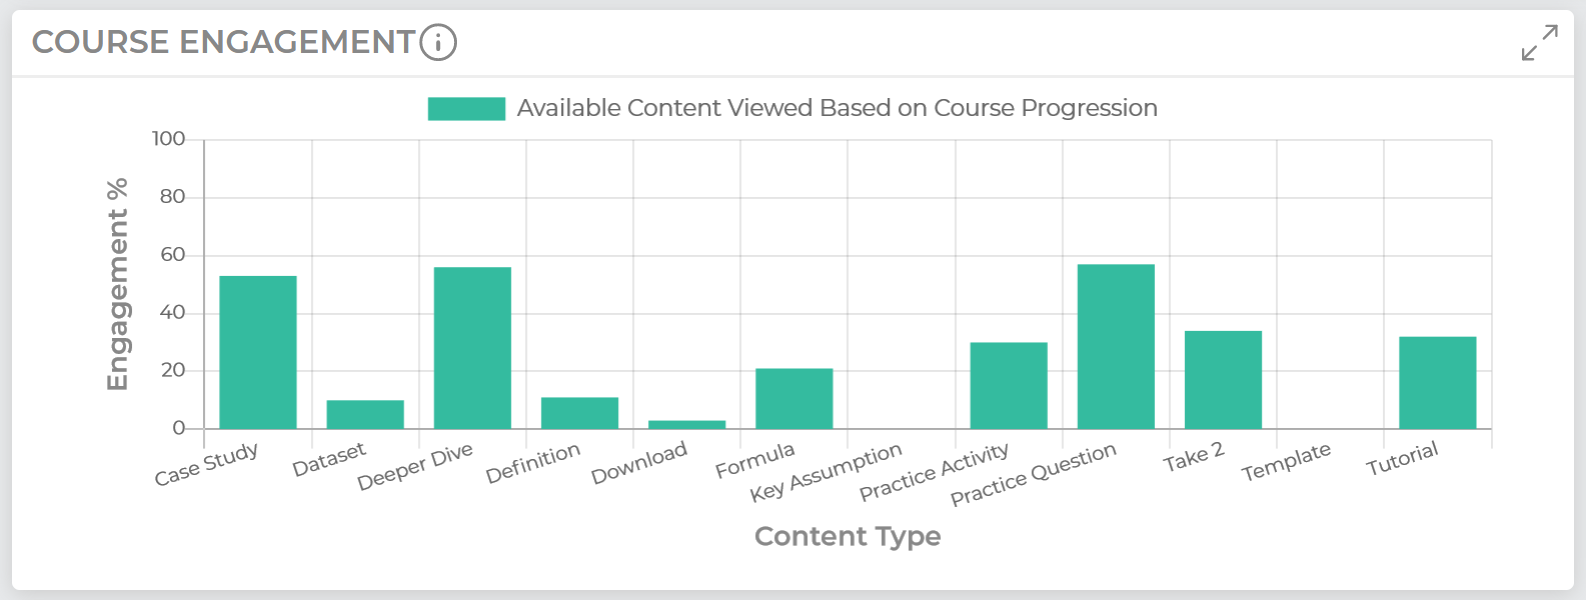
To calculate the students’ engagement percentage for a given side link or practice activity, we use the following formula: Number of side links clicked divided by the total number of side links available based on current progression through the course.
For example, if a student has viewed three lessons and was exposed to two case studies, but only viewed one, the numerator (number of side links viewed) will be one, and the denominator (number of side links available) will be two, resulting in a 50% engagement score for case studies for that student.
Expanded Dashboard View
This view presents average side link views and practice activity attempts compared to the total available throughout the course, rather than those available based on course progression (as is the case with the main dashboard view). Practice attempts are broken down into two types: multiple choice questions and activities (like drag-and-drop exercises).
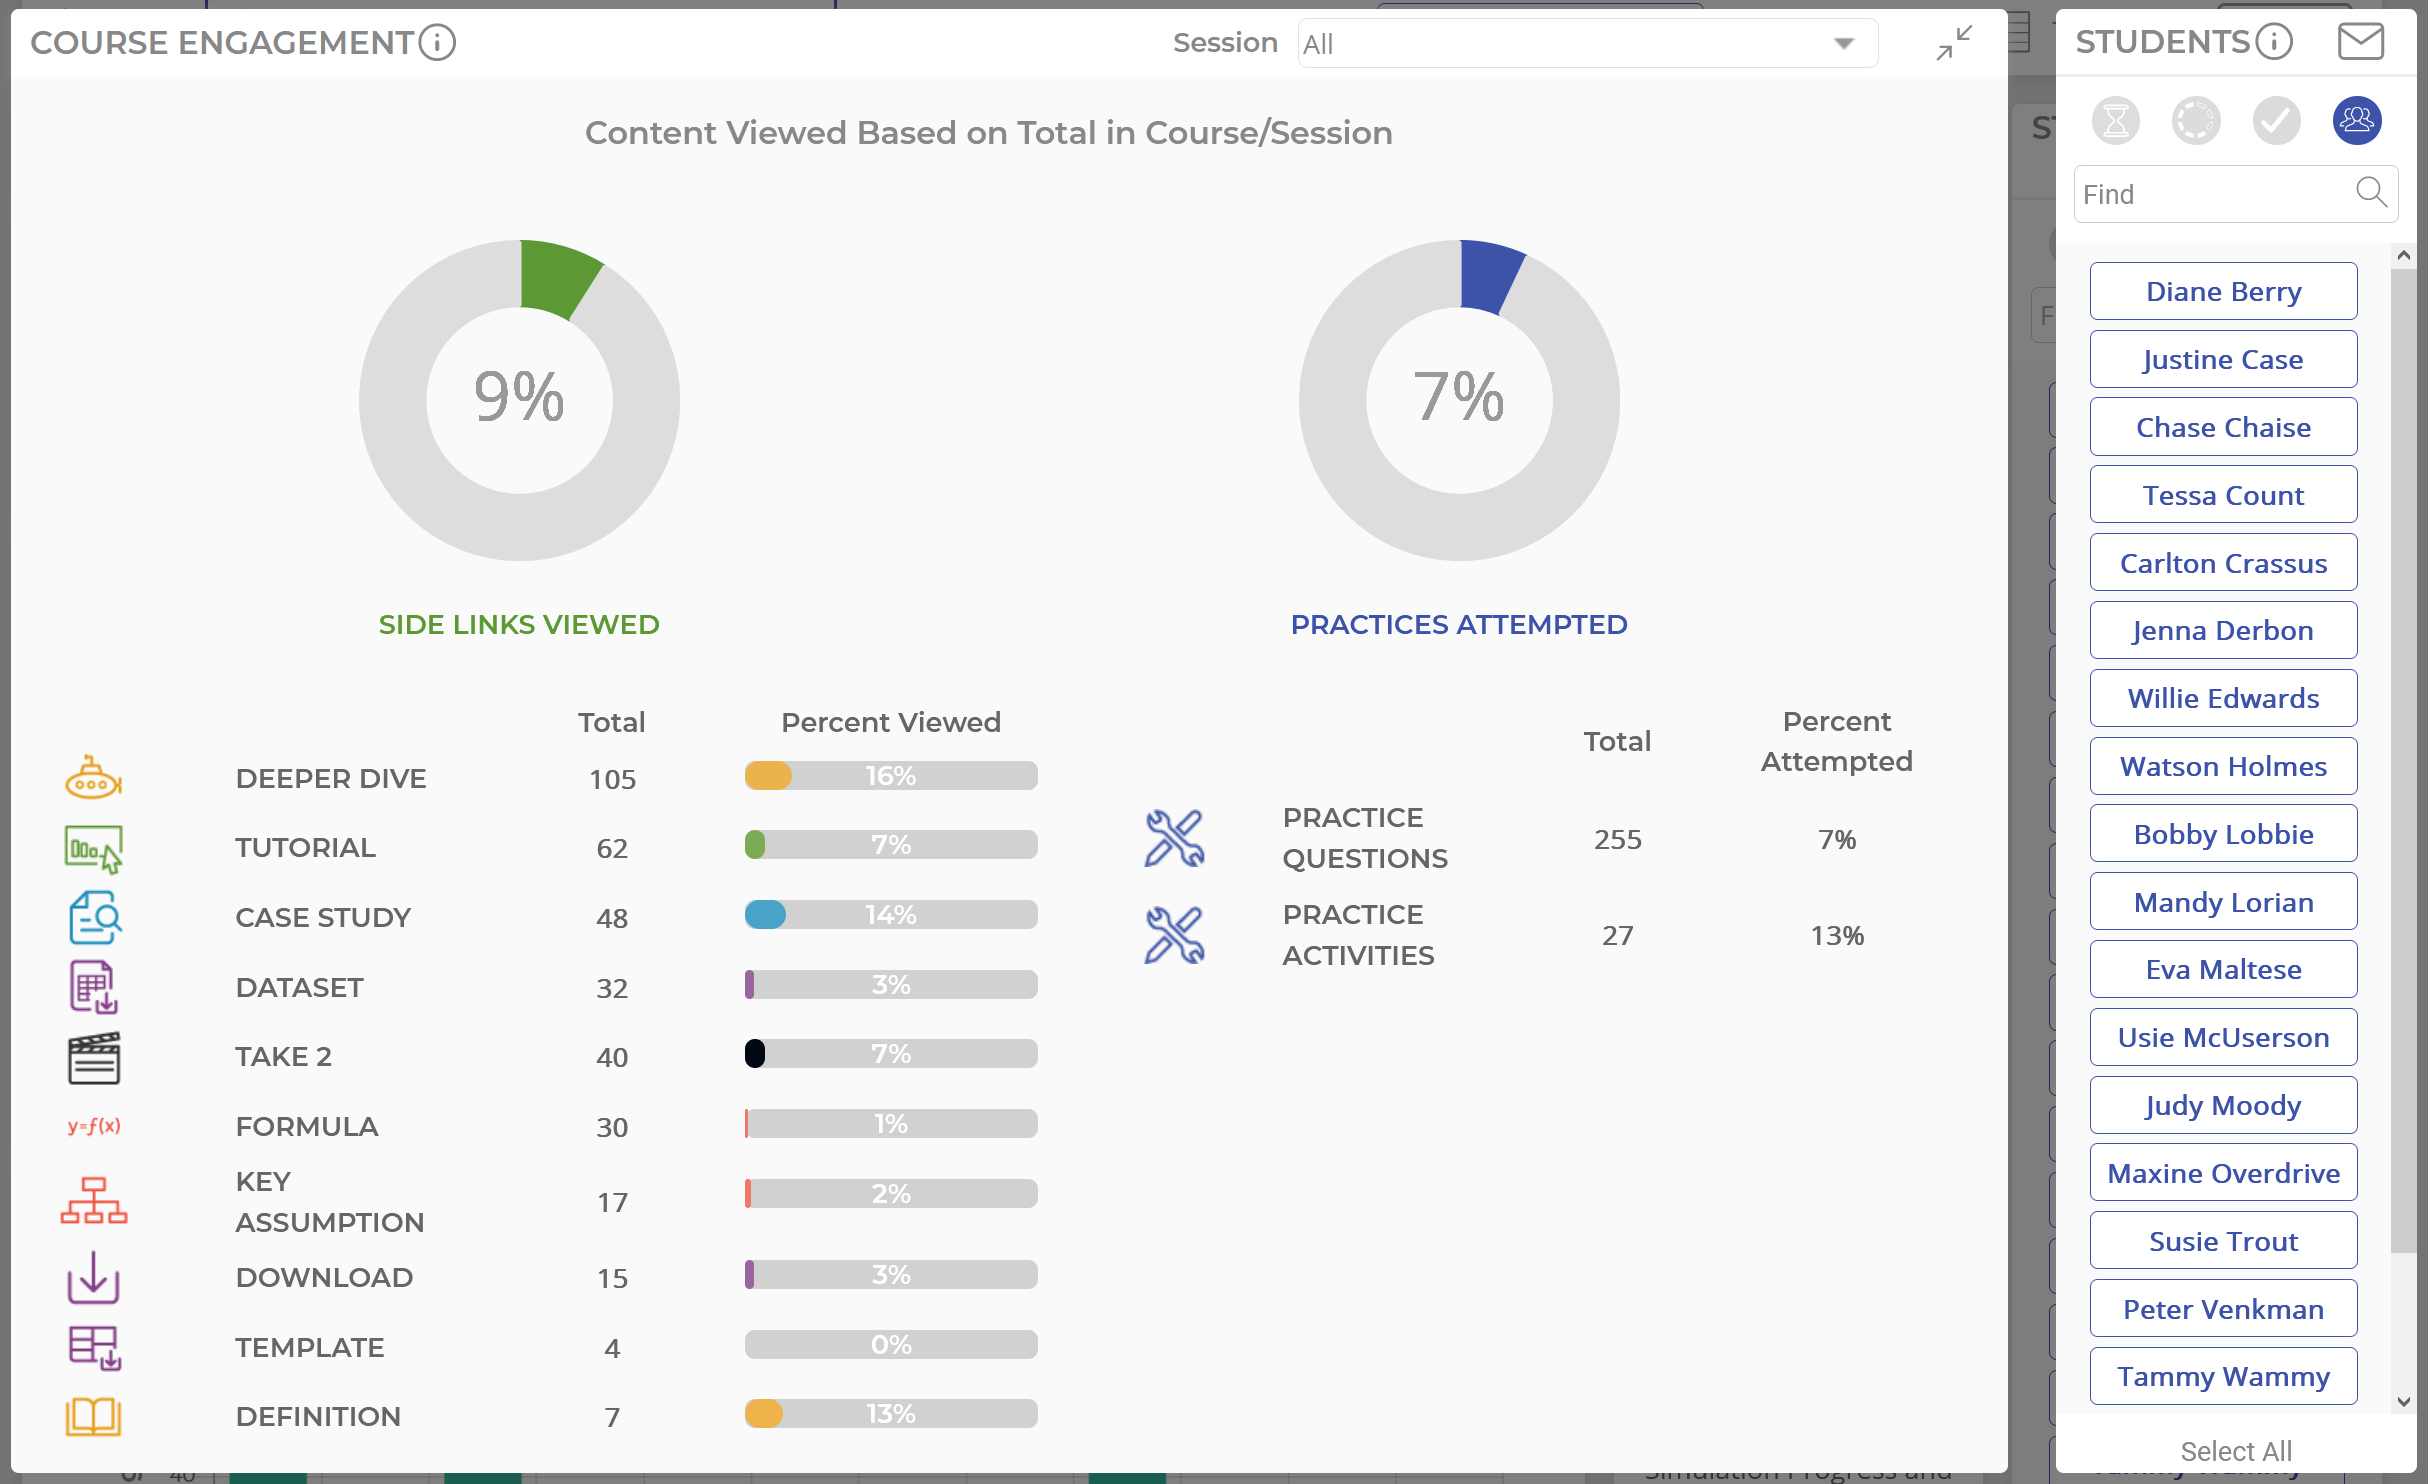
Table View
Here, you can view more granular data on each student’s side link views and practice activity attempts.
This view presents average side link views and practice activity attempts compared to the total available throughout the course*, rather than those available based on course progression (as is the case with the Dashboard View).
Scroll down to view more students, and scroll to the right to view data for each side link / practice activity.
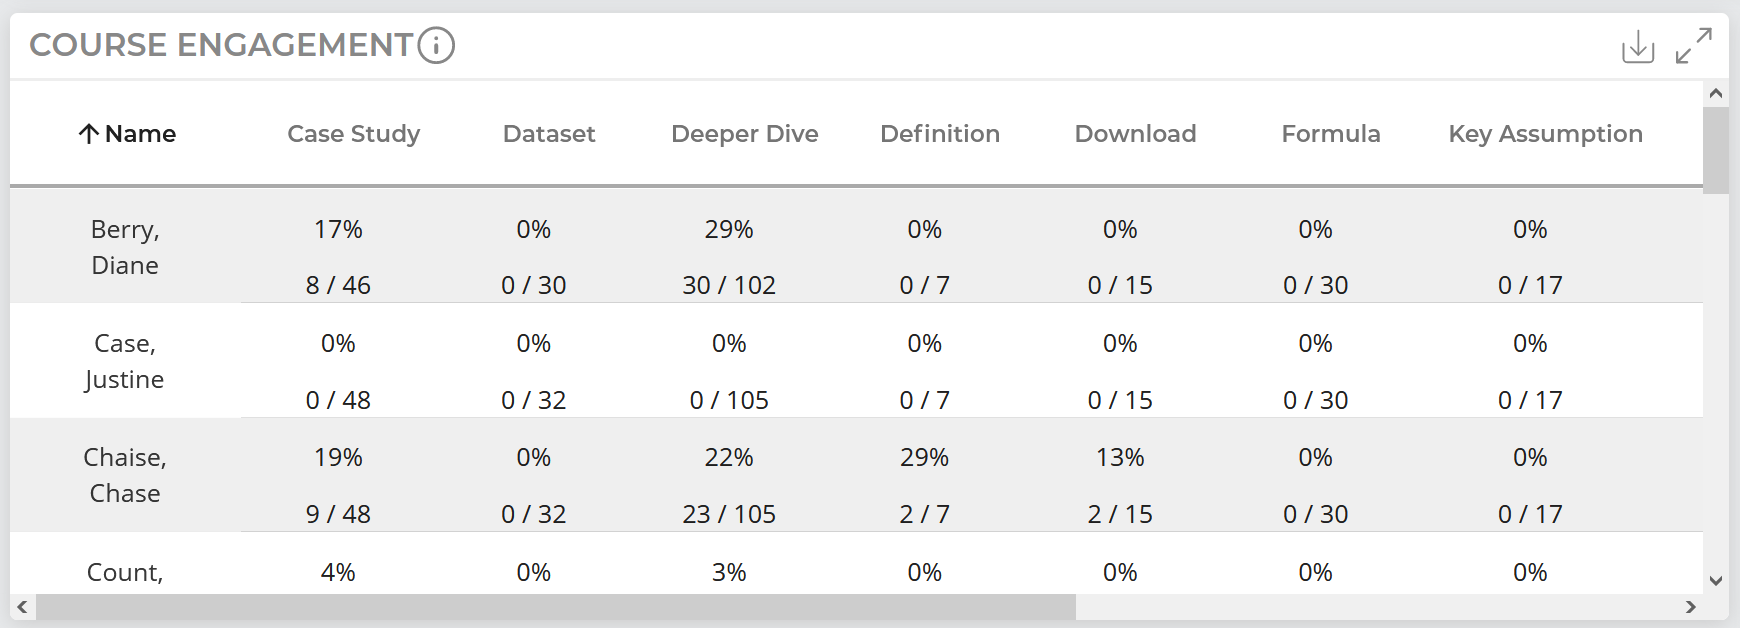
Download this data as a CSV using the download icon in the top right of this widget.
* Note: If a student has opted to view an alternate version of the course, such as Healthcare or Financial, the total amount of certain activities could differ, resulting in different denominators for that student.
Expanded Table View
This view provides the same data as Table View; the only difference is that it is expanded to improve readability.
Was this helpful?