
Simplify Lean Six Sigma Management with a Powerful Administration System
Managing a Lean Six Sigma training program doesn't have to be complex. MoreSteam's Lean Six Sigma management system gives you everything you need to run a successful deployment, from secure enrollment and data access to real-time dashboards and six sigma coaching support. Whether you're guiding a small group or managing hundreds of learners, our tools help you stay organized, proactive, and in control.

Easily Manage Lean Six Sigma Training Access
Deliver Lean Six Sigma training to your organization using flexible, scalable enrollment options. Integrate with your organization's LMS, offer credit card payment via branded portals, or send us your bulk enrollment list and we'll handle the rest.
Integration with Learning Management Systems (LMS)
Embed our courses into learning management systems like Workday, SuccessFactors, Plateau, and Cornerstone OnDemand.
Customized, Secure Enrollment Portals
Set up a customized portal with your organization's branding to allow individual users to purchase training securely with a credit card.
Bulk Enrollments via Spreadsheets
Use our standardized spreadsheet to quickly enroll groups of employees, perfect for large-scale deployments or multi-cohort programs.
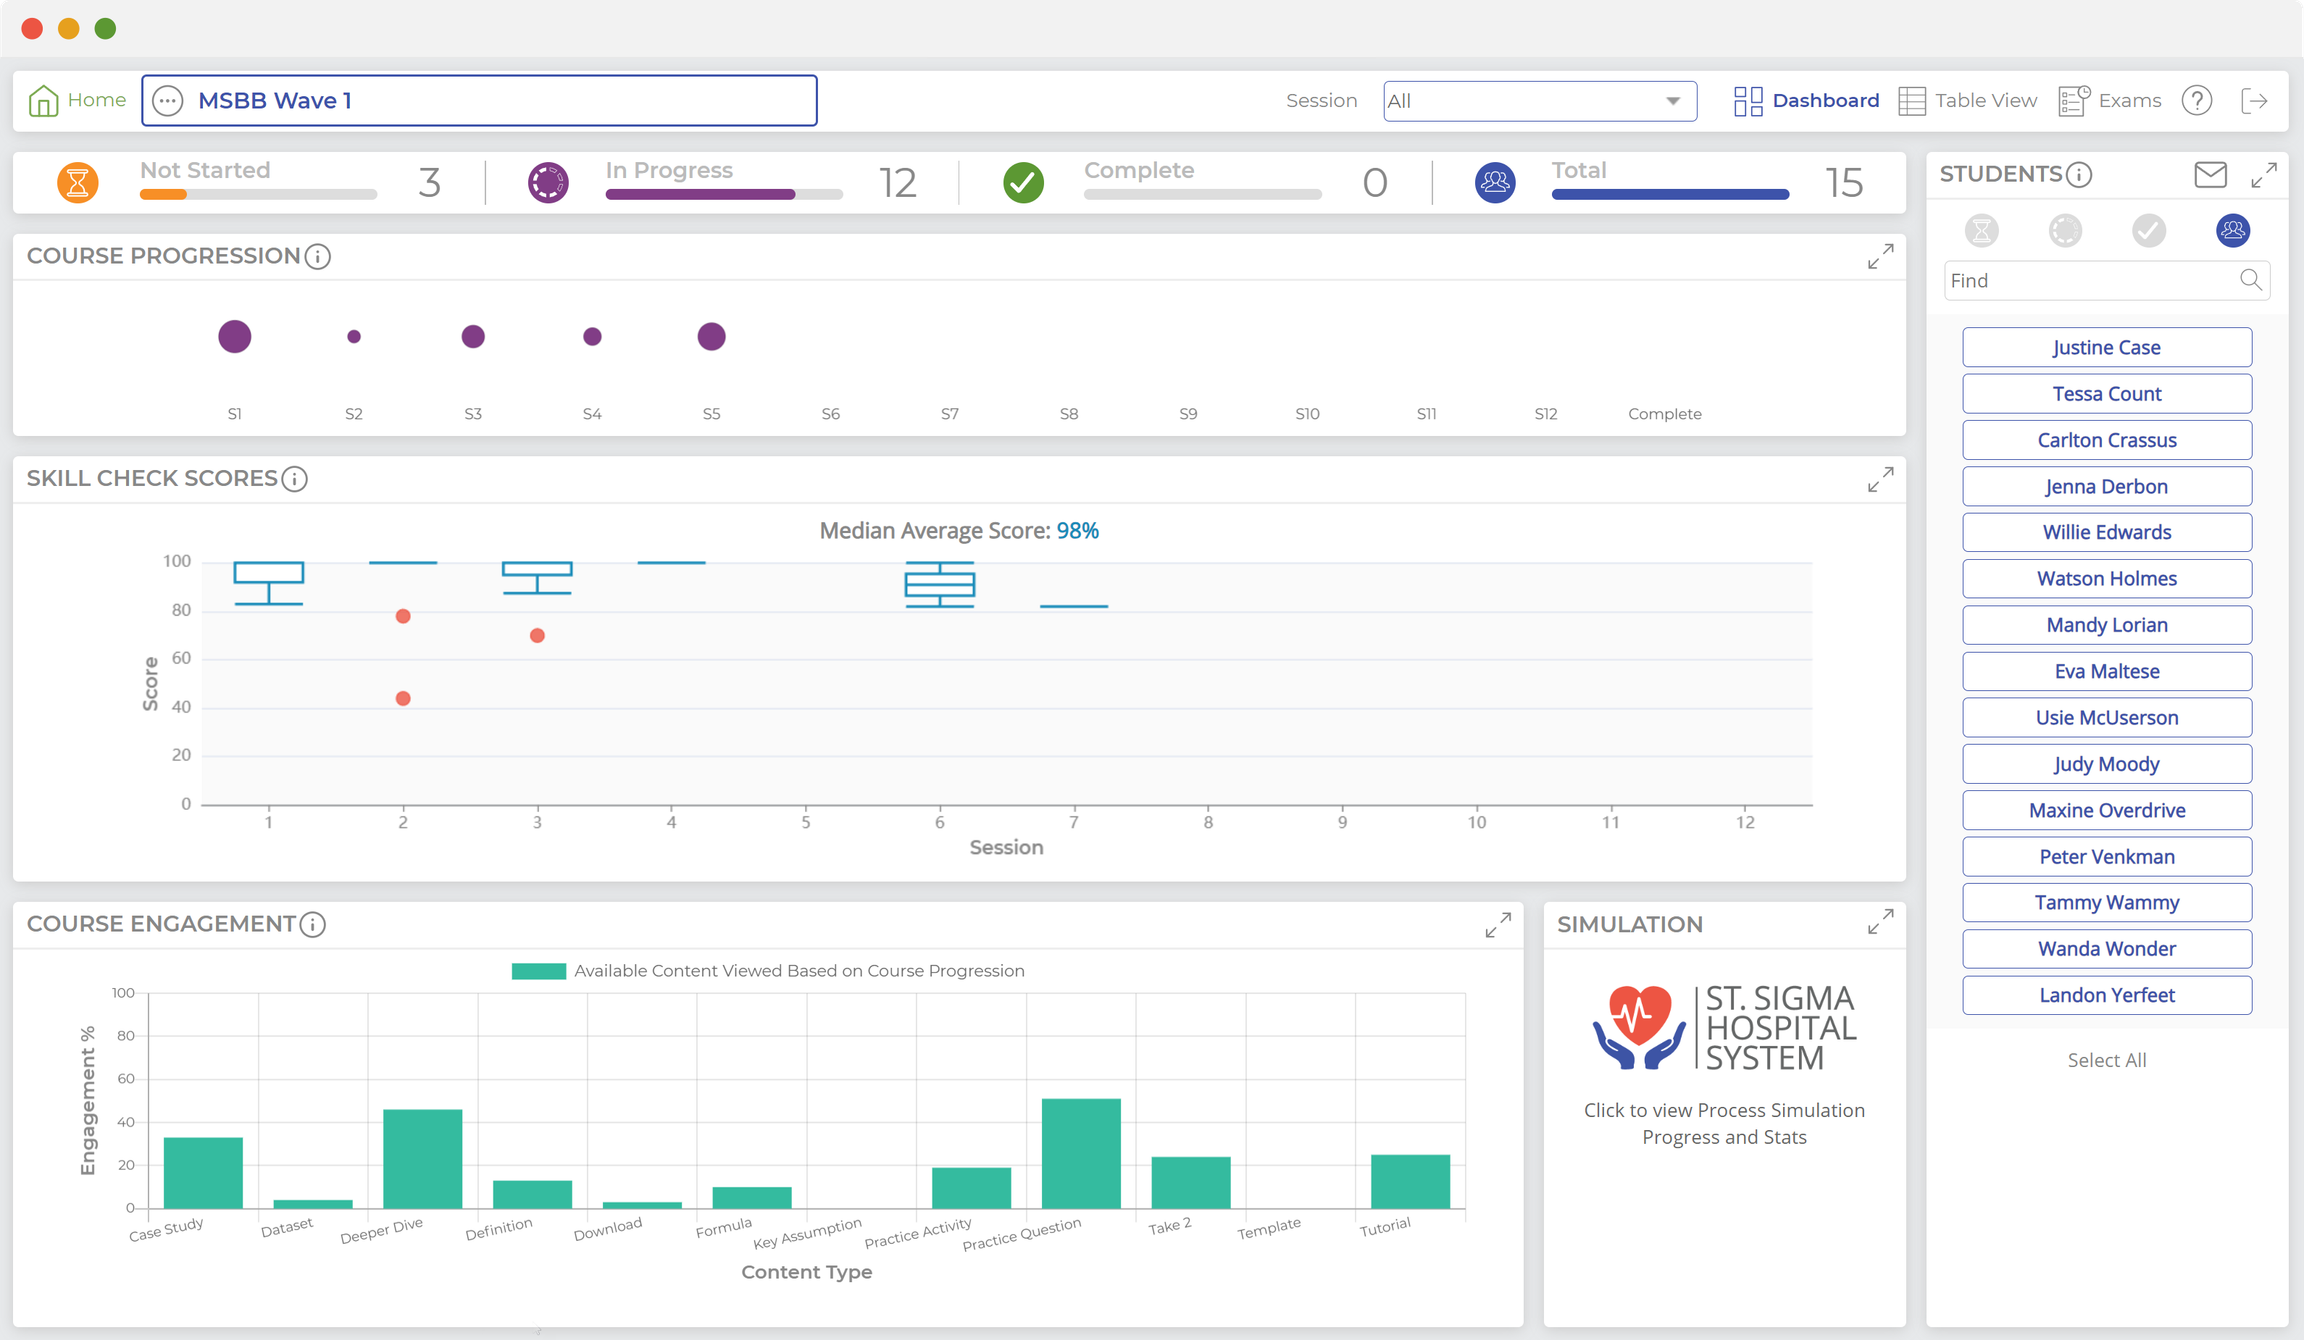
Actionable Coaching Insights with the Six Sigma Coaching Dashboard
Coach View is your command center for Lean Six Sigma coaching. This intuitive dashboard gives you a snapshot of your training cohort, visualizing key metrics like skill check scores (via box plots), learner progress (via bubble plots), and engagement levels with critical course components such as videos and practice exercises.
Quickly identify struggling students, spot knowledge gaps, and tailor your coaching approach based on real data. Whether you're guiding a handful of learners or managing a full deployment, the Six Sigma coaching dashboard empowers you to make smarter, more timely interventions that keep your learners—and your program—on track.
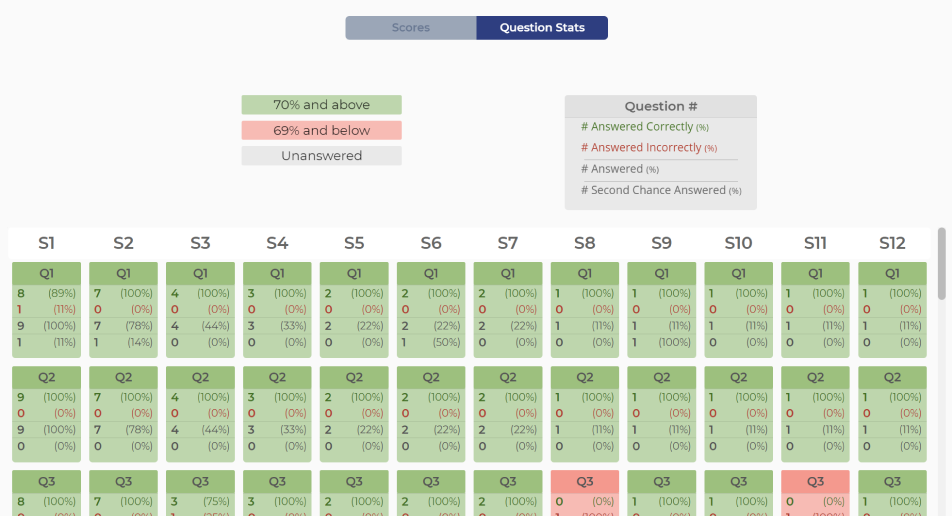
SPOT LEARNING GAPS
Visual signals display patterns in Lean Six Sigma concepts that students are struggling with.
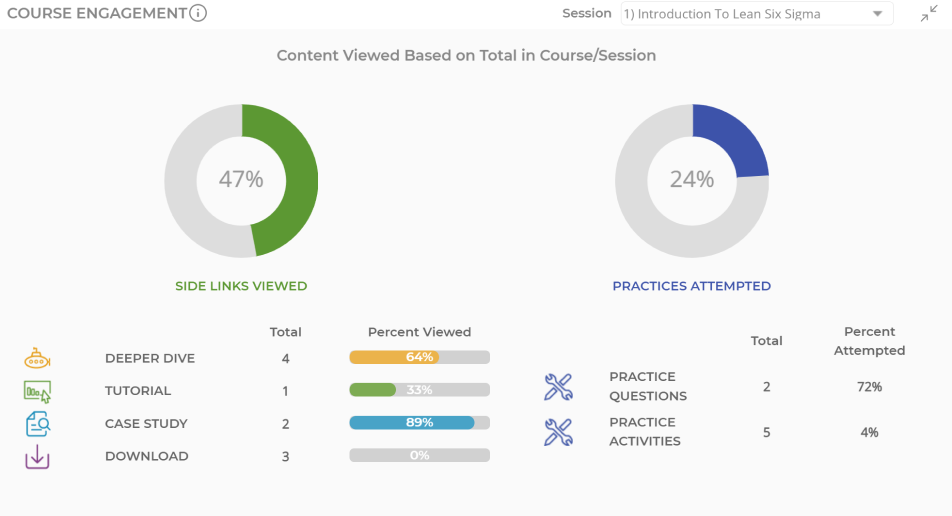
TRACK ENGAGEMENT
See if your students are engaging with training with statistics on what they've viewed and clicked.
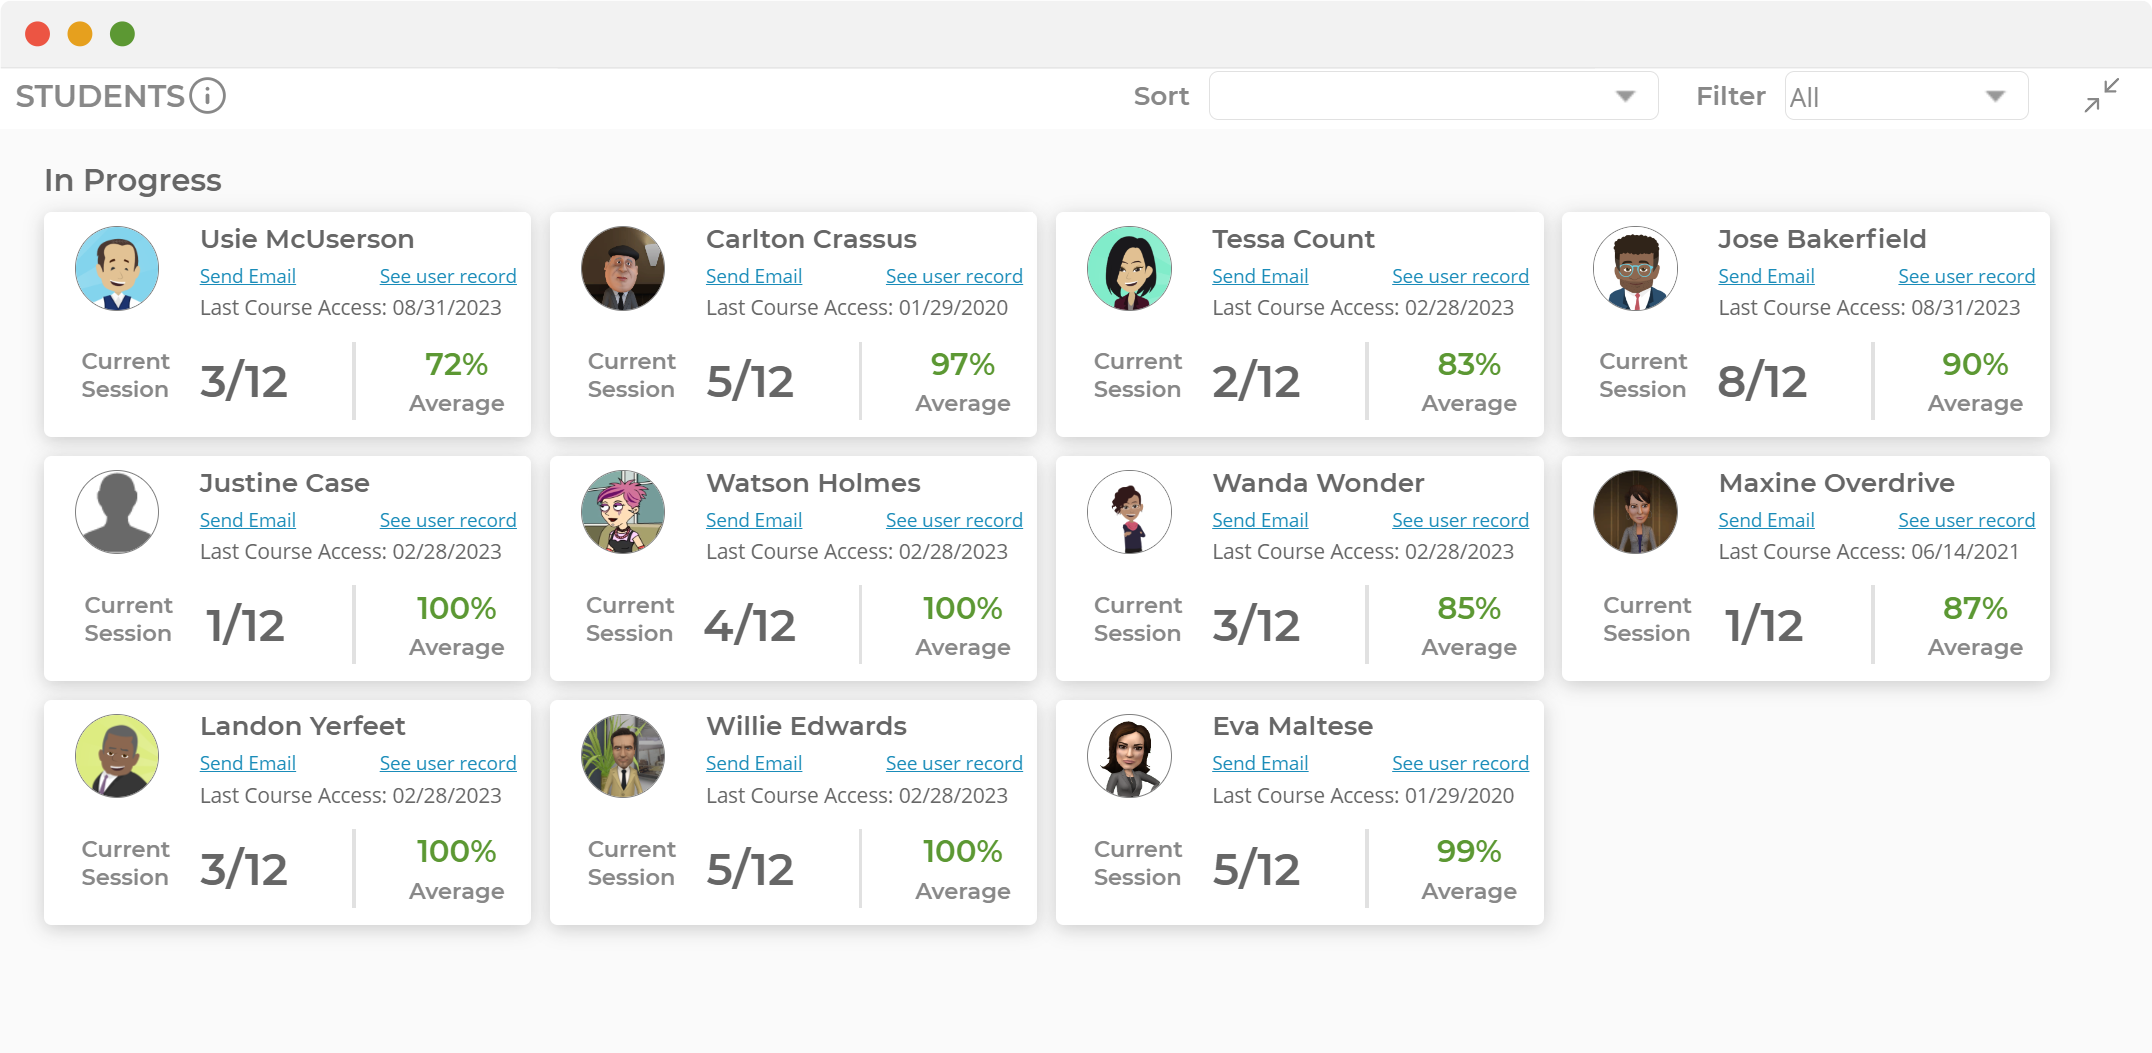
MONITOR PROGRESS
Quickly monitor progress across your cohort and drill down into students who need intervention.
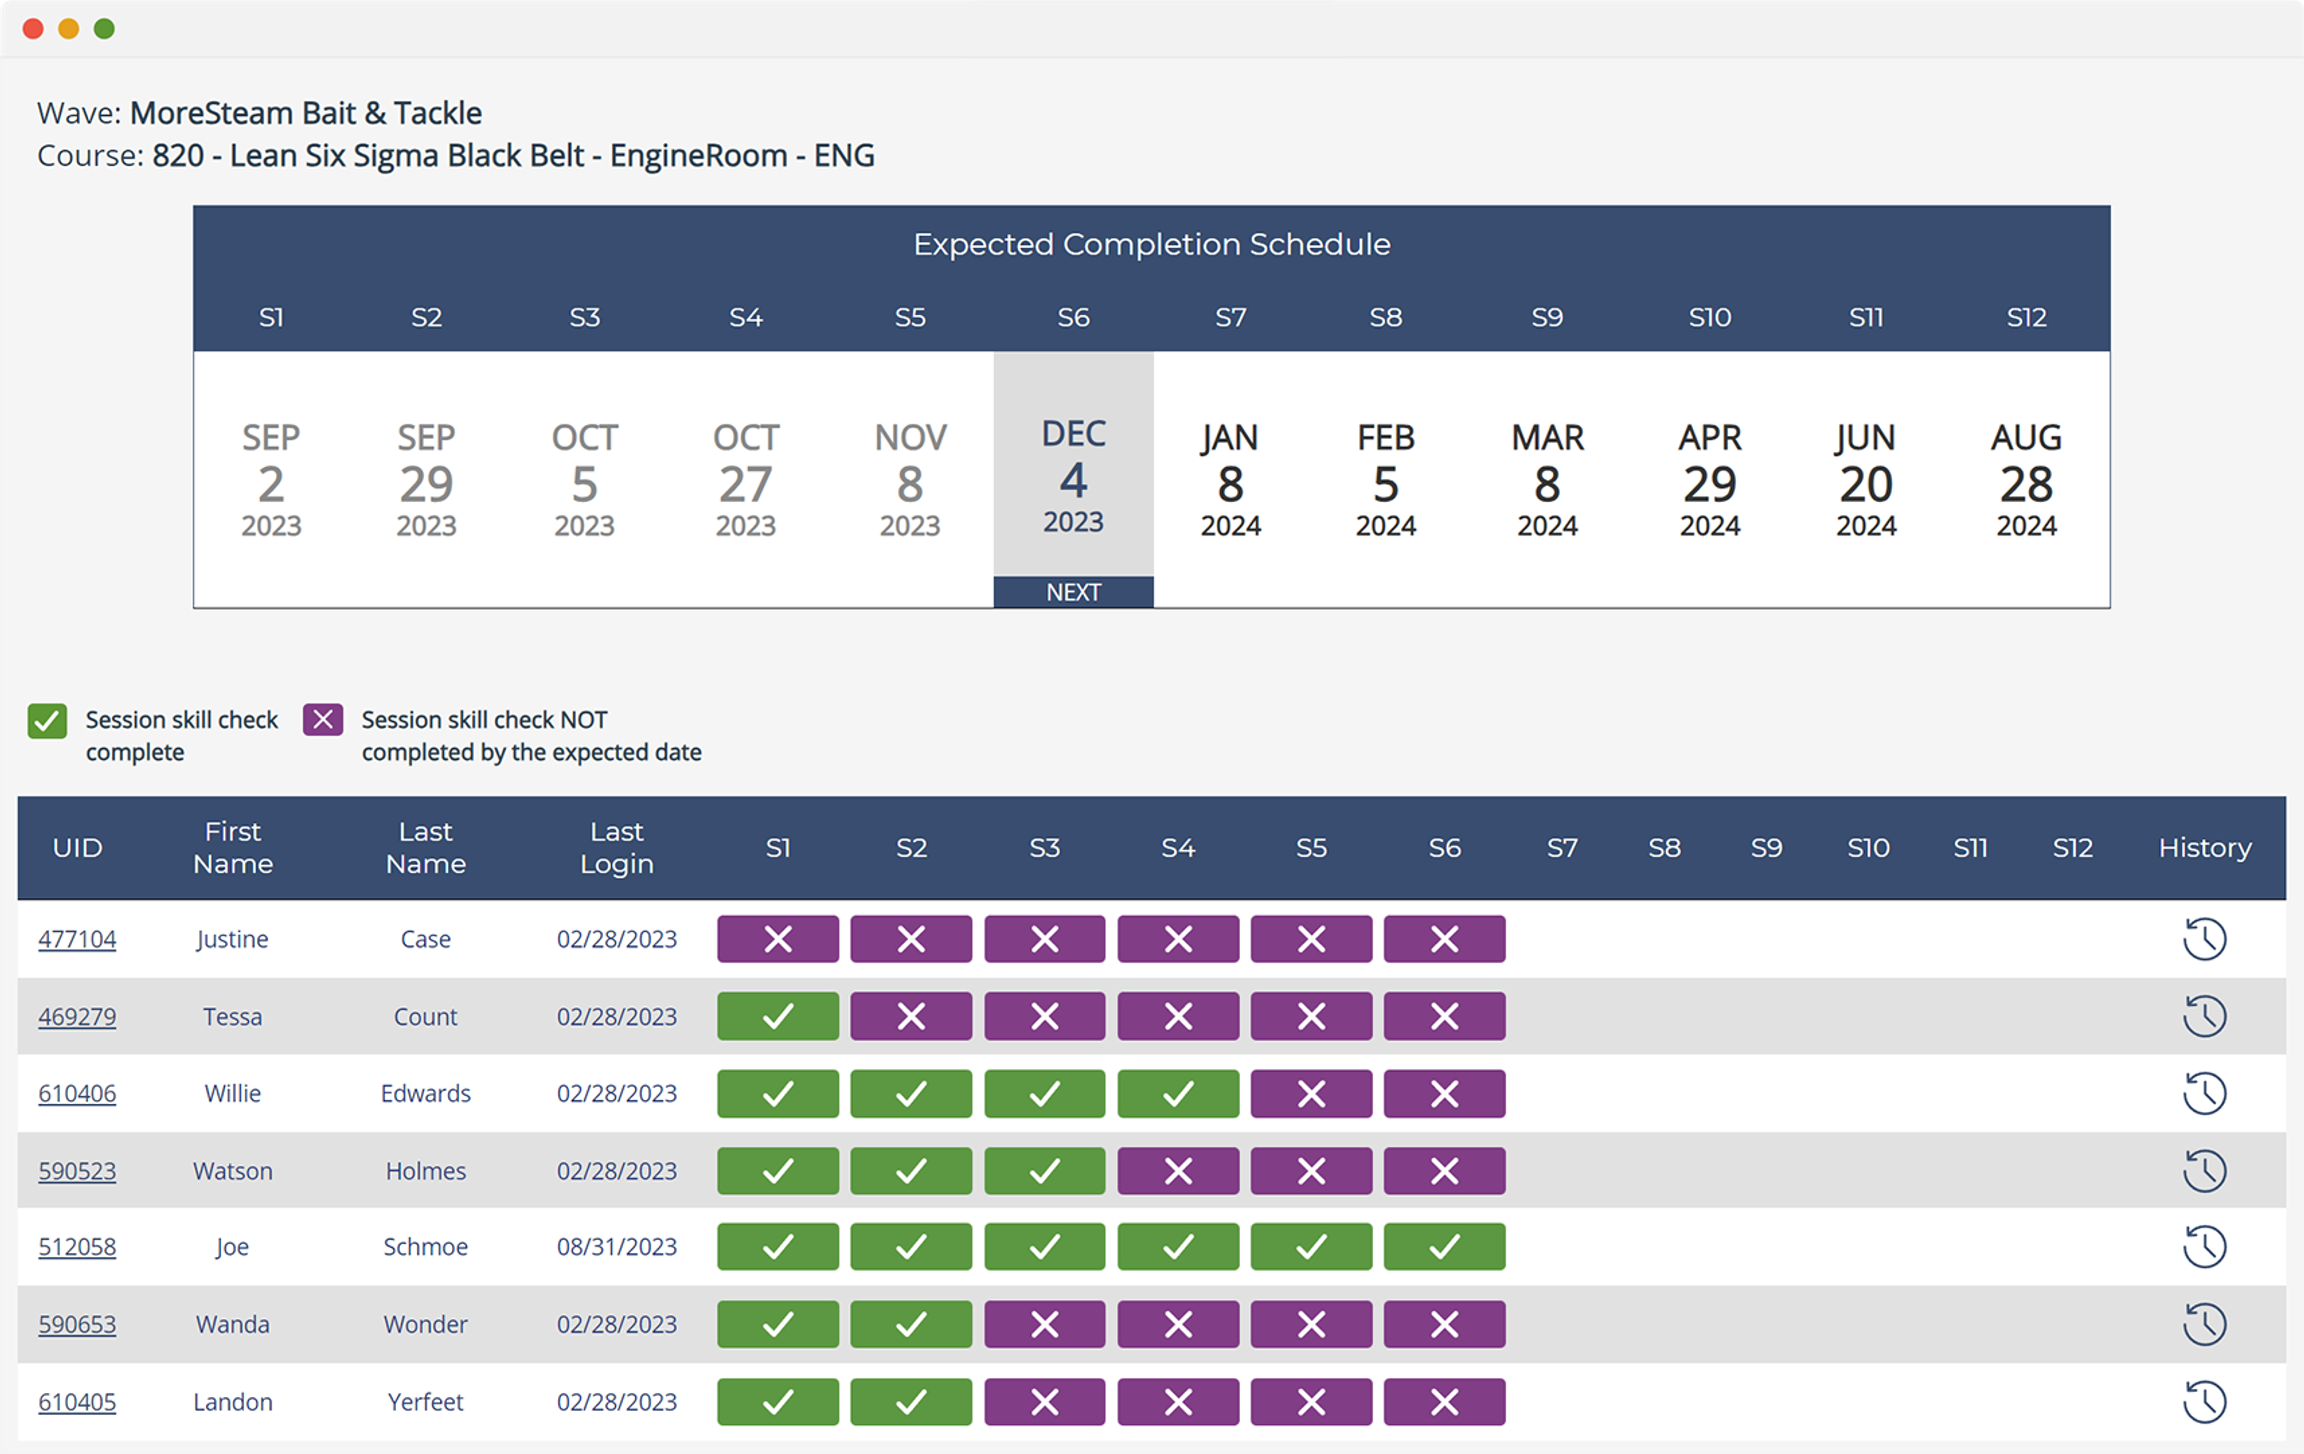
Automated Nudges Keep Students on Track for Training Deadlines
When you're overseeing a large training deployment, staying ahead of deadlines can feel like a full-time job. That's where Nag-o-matic, our built-in reminder tool, comes in. From your admin dashboard, you can create personalized course timelines and automate email nudges to prompt students before key milestones—like study halls, project submissions, or module deadlines.
Nag-o-matic helps you reduce delays, improve on-time completion, and support your learners without chasing them down. Whether you're managing a small cohort or hundreds of students across a global deployment, this tool scales with you—freeing up time for coaching, progress monitoring, and other high-impact activities.
Flexible Reporting Tools Built for Lean Six Sigma Deployments
Access the training data that matters most to your team, exactly how you need it. From the admin dashboard, you can filter learner activity by course, cohort, business unit, location, and more. Export the results as a clean CSV file or schedule recurring reports to be delivered automatically to your inbox. No more digging through spreadsheets or chasing down updates.
Need to pull data into your own systems? No problem. We'll work with you to build a custom API connection that integrates seamlessly with your existing dashboards or platforms so your reporting stays centralized, consistent, and aligned with the way you already work.
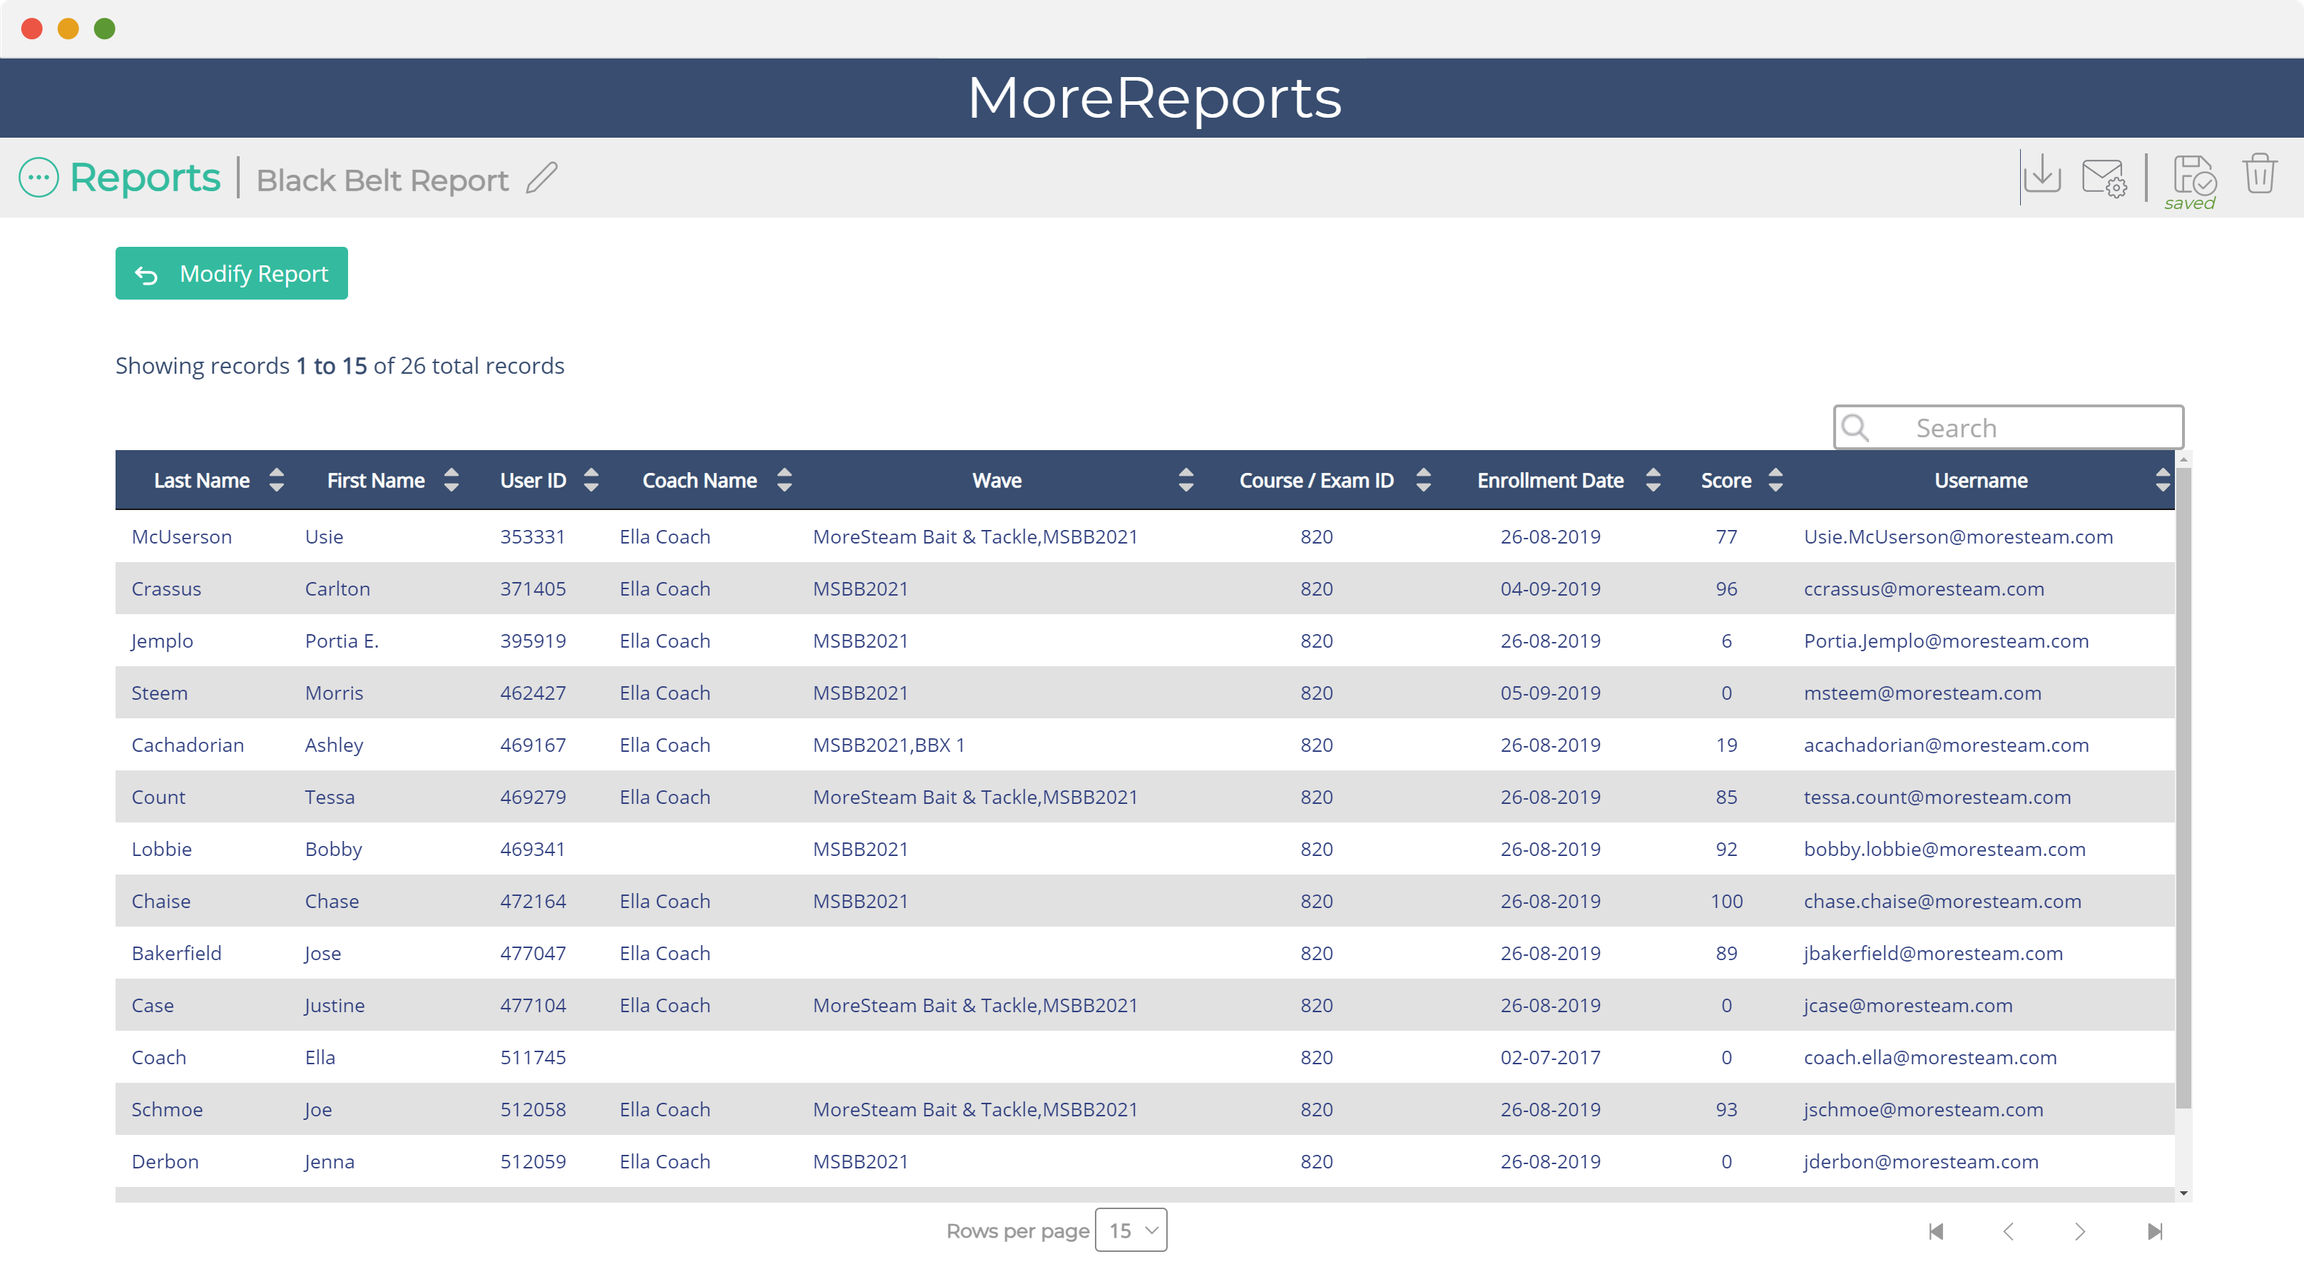
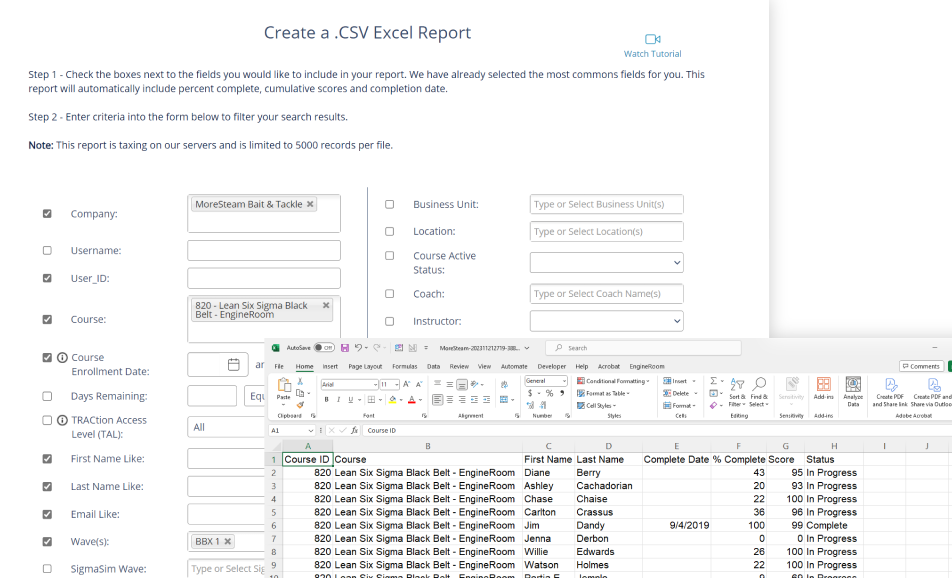
EXPORT CAPABILITIES
Get your data the way you need it. Export it out of our system by filtering on the conditions that matter to you. Easily see training stats by course, business unit, training cohort, locale, and more.
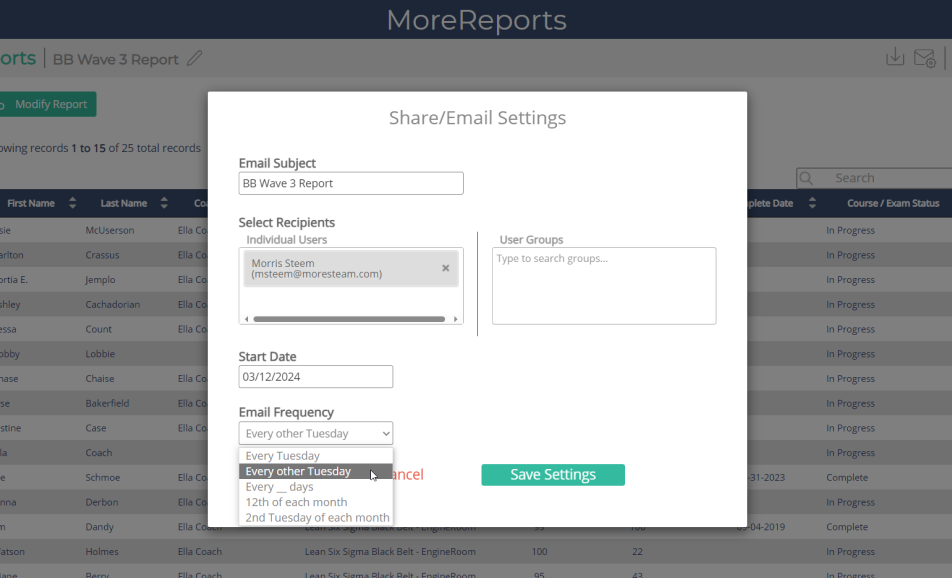
AUTOMATED REPORTS
Set it and forget it reporting with MoreReports. Customize your report the way you want it, and schedule it to be sent to yourself, other admins on your team, and stakeholders on the cadence that matters to you.

CONNECT TO EXISTING SYSTEMS
Work with us to develop a customized API to connect data from our system to an existing dashboard or system on your end. Keep your reporting centralized and eliminate the need for manual data transfers.
Our Priority is Keeping Your Data Secure
With nearly 20 years of experience developing and supporting software for some of the world's largest organizations, MoreSteam takes data protection seriously. Our platforms are built using advanced security technologies and industry best practices to safeguard your information at every step.
We maintain a secure, permission-based infrastructure that is continuously monitored and regularly updated to remain resilient against threats. From encrypted data transmission to access controls and system redundancy, we ensure your users' data stays protected and your training programs stay online and uninterrupted.

Resources to Support Lean Six Sigma Management
MoreSteam provides powerful tools for Lean Six Sigma management, blended learning, and coaching. From streamlined enrollment to real-time coaching insights, our platform helps you manage training programs efficiently and support learners at every stage. Explore more resources to strengthen your deployment and drive continuous improvement.


Achieve Success Beyond Lean Six Sigma Training with MoreSteam's Integrated Technology Platform
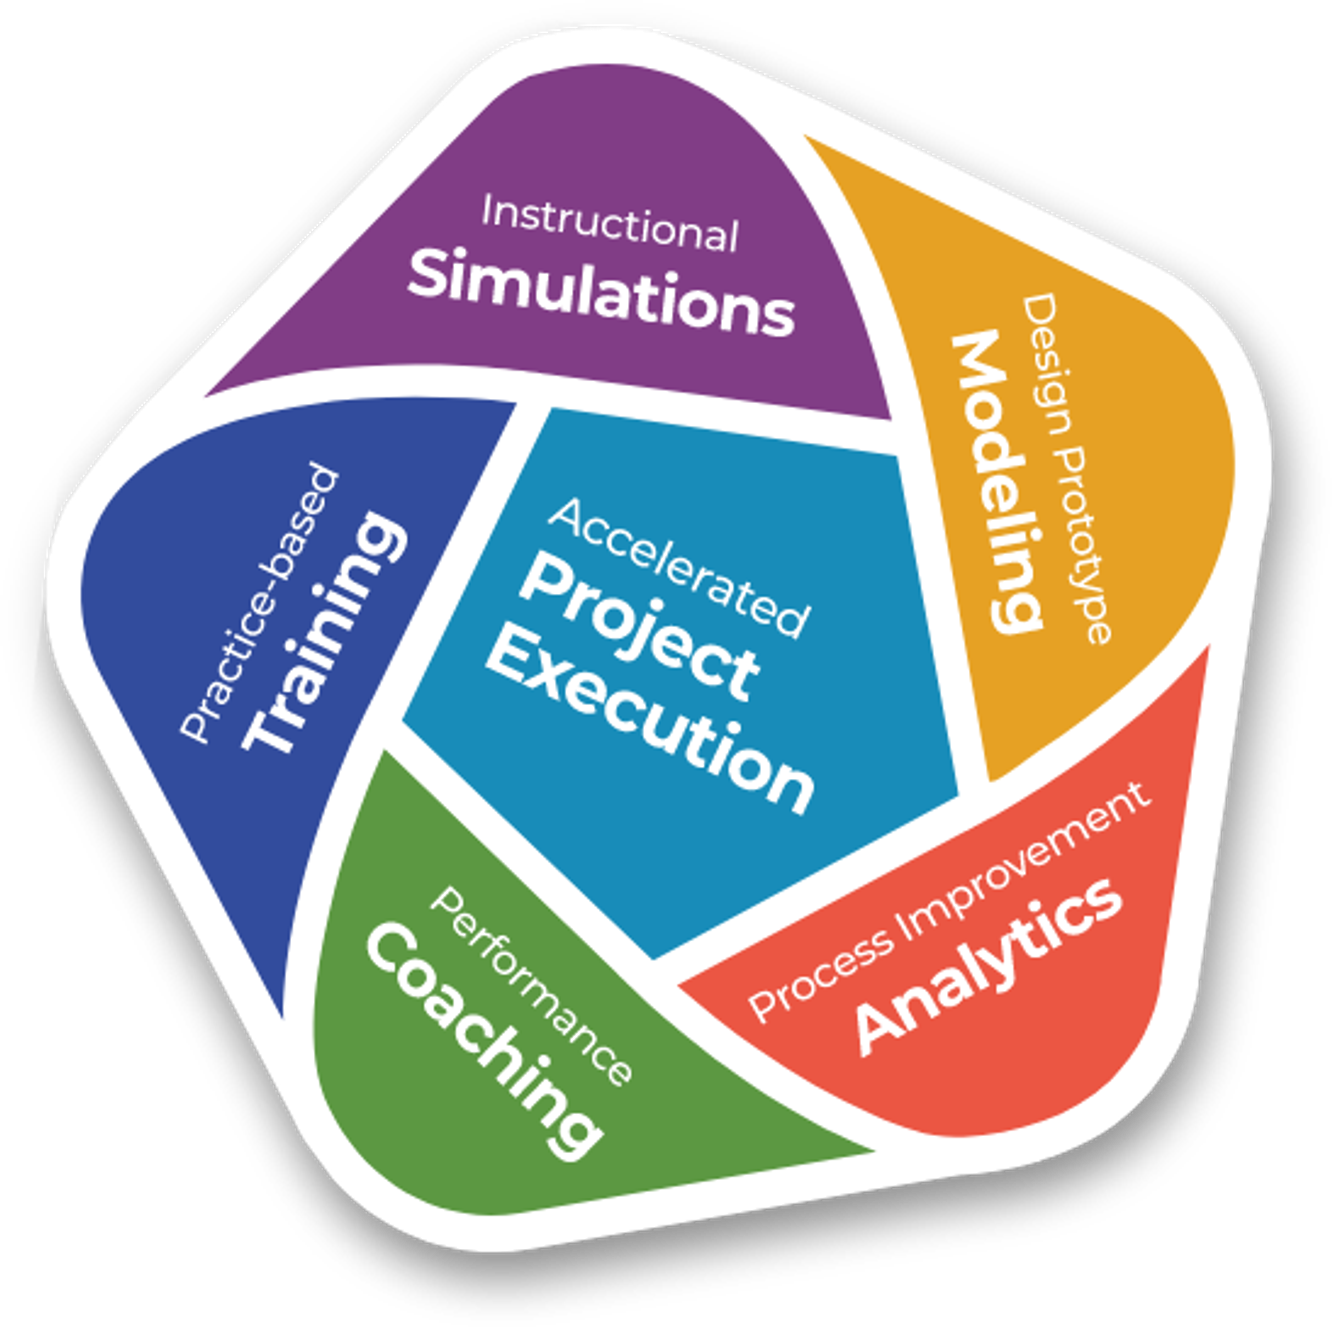
Managing a Lean Six Sigma Training Program is more than rolling out training. The real work lies in developing impactful projects tailored to the organization's needs and equipping individuals within your organization to execute these projects successfully. MoreSteam's integrated technology platform includes data analysis software, process modeling for Lean transformations, project tracking software, and a plethora of training simulations that help to build both competency and confidence in aspiring Lean Six Sigma practitioners.
Whether you're initiating Lean Six Sigma training or looking to elevate an existing program, MoreSteam's platform is your strategic partner in building a successful and results-driven initiative.
