Fishbone (Ishikawa) Diagram
Background
Fishbone Diagrams (also known as Ishikawa Diagrams) are used in process improvement methods to identify all of the contributing root causes likely to be causing a problem.
Another name for this diagram is the "Cause & Effect" or CE diagram. A completed Fishbone diagram includes a central "spine" and several branches reminiscent of a fish skeleton.
Fishbone Diagrams can be used to answer the following questions that commonly arise in problem solving: What are the potential root causes of a problem? What category of process inputs represents the greatest source of variability in the process output?
Dr. Kaoru Ishikawa developed the "Fishbone Diagram" at the University of Tokyo in 1943. Hence the Fishbone Diagram is frequently referred to as an "Ishikawa Diagram." The Fishbone chart is an initial step in the screening process. After identifying potential root cause(s), further testing will be necessary to confirm the true root cause(s). This methodology can be used on any type of problem, and can be tailored by the user to fit the circumstances.
Using the Ishikawa approach to identifying the root cause(s) of a problem provides several benefits to process improvement teams:
- Constructing a Fishbone Diagram is straightforward and easy to learn.
- The Fishbone Diagram can incorporate metrics but is primarily a visual tool for organizing critical thinking.
- By Involving the workforce in problem resolution the preparation of the fishbone diagram provides an education to the whole team.
- Using the Ishikawa method to explore root causes and record them helps organize the discussion to stay focused on the current issues.
- It promotes "System Thinking" through visual linkages.
- It also helps prioritize further analysis and corrective actions.
How to Get Started
This tool is most effective when used in a team or group setting.
1. To create a Fishbone Diagram, you can use any of a variety of materials. In a group setting you can use a white board, butcher-block paper, or a flip chart to get started. You may also want to use "Post-It" notes to list possible causes but have the ability to re-arrange the notes as the diagram develops. There are also several software packages that can be useful in creating a Fishbone Diagram, including Microsoft Excel and EngineRoom . EngineRoom is available for a free trial so that you can practice making a Fishbone Diagram. Or you can watch the tutorial provided below that shows how to make and use a Fishbone Diagram using EngineRoom.
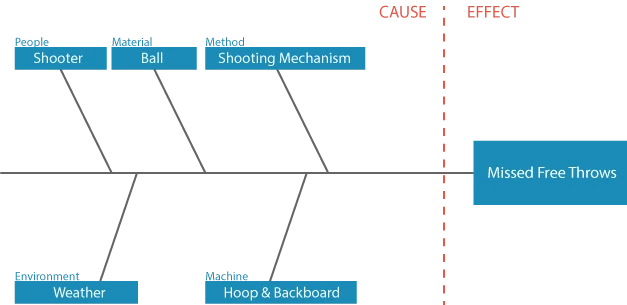
2. Write the problem to be solved (the EFFECT) as descriptively as possible on one side of the work space, then draw the "backbone of the fish", as shown below. The example we have chosen to illustrate is "Missed Free Throws" (an acquaintance of ours just lost an outdoor three-on-three basketball tournament due to missed free throws).

3. The next step is to decide how to categorize the causes. There are two basic methods: A) by function, or B) by process sequence. The most frequent approach is to categorize by function.
In manufacturing settings the categories are often: Machine, Method, Materials, Measurement, People, and Environment. In service settings, Machine and Method are often replaced by Policies (high level decision rules), and Procedures (specific tasks).
In this case, we will use the manufacturing functions as a starting point, less Measurement because there was no variability experienced from measurements (its easy to see if the ball goes through the basket).
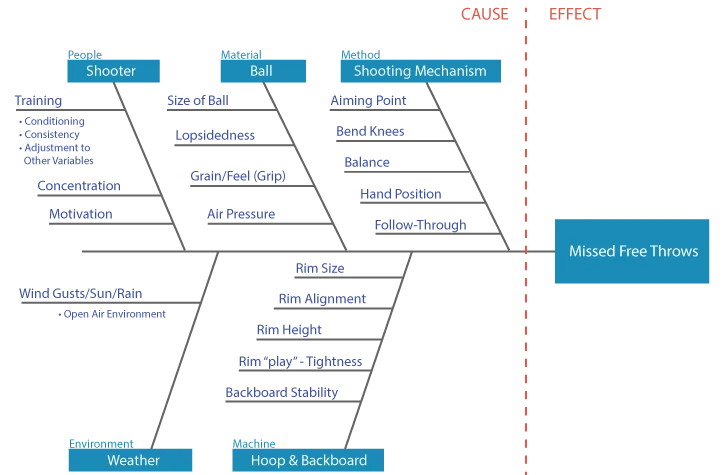
4. You can see that this is not enough detail to identify specific root causes. There are usually many contributors to a problem, so an effective Fishbone Diagram will have many potential causes listed in categories and sub-categories. The detailed sub-categories can be generated from either or both of two sources:
- Brainstorming by group/team members based on prior experiences.
- Data collected from check sheets or other sources
A closely related Cause & Effect analytical tool is the "5-Why" approach, which states: "Discovery of the true root cause requires answering the question 'Why?' at least 5 times". See the 5-Why feature of the Toolbox. Additional root causes are added to the fishbone diagram below:
5. The usefulness of a Fishbone Diagram is dependent upon the level of development - moving past symptoms to the true root cause, and quantifying the relationship between the Primary Root Causes and the Effect. You can take the analysis to a deeper level by using Regression Analysis to quantify correlation, and Designed Experiments to quantify causation. As you identify the primary contributors, and hopefully quantify correlation, add that information to your chart, either directly or with foot notes.
The following chart has the top five primary root cause contributors highlighted in gold. The note "MC" (for Mathematical Correlation) attached to air pressure indicates that strong correlation has been established through statistical analysis of data (the lower the air pressure, the less bounce off the rim).
If you have ever tried to shoot baskets at a street fair or carnival to win a prize, you know that the operator always over-inflates the ball to lower your chances. Pick any system that works for you - you could circle instead of highlighting. The priority numbers can carry over to a corrective action matrix to help organize and track improvement actions.
6. See an example of how to use the Fishbone Diagram Tool in EngineRoom below:
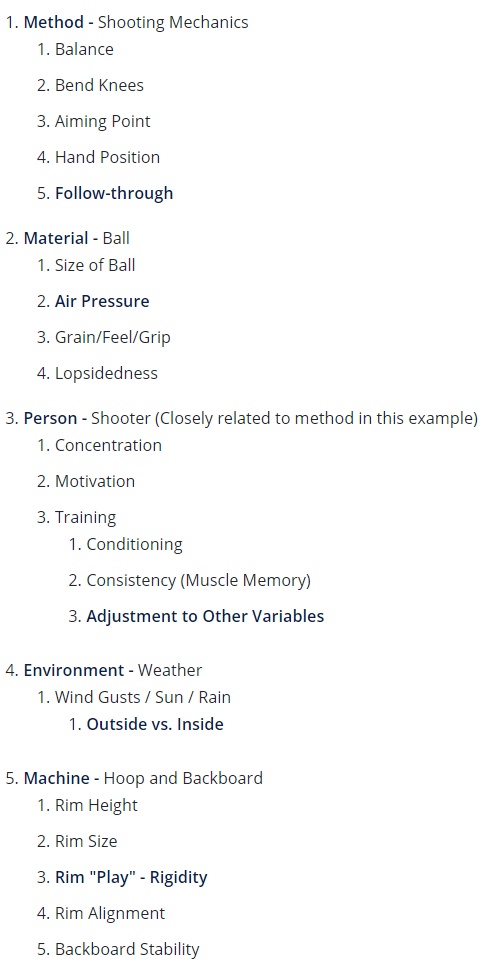
Indented Hierarchy Fishbone
An alternate format for a Cause and Effect diagram is the "indented hierarchy fishbone". This format may be easier to use as it can be easily executed in a word processing or spreadsheet program. Following is an example of our Free-Throw example using the indented hierarchy method:
Effect - Made (Missed) Free Throws
Cause -
Resources: Guide to Quality Control - Dr. Kaoru Ishikawa
Summary
Regardless, if one uses the graphical or the indented hierarchy Fishbone, this process improvement tool will greatly help understanding the significant factors involved in a process.
Creating this diagram with a cross functional team will build not only trust between departments but will cultivate new found knowledge and understanding for the key players in the process. When using the Fishbone as a discussion topic meetings can be better focused on process improvement and defect reduction.