Introduction
"Simpson's Paradox" is a well‐known phenomenon that can distort causal relationships in data sets in the presence of a confounder or covariate, where the direction of an effect is reversed when you take into account a previously ignored ('lurking') variable that significantly affects the relationship. In this paper, we will talk about some practical ways to guard against becoming the victim of this insidious effect.
To refresh your memory, Simpson's Paradox is the name given to the phenomenon where the direction of an effect is reversed when you take into account a previously ignored ('lurking') variable that significantly affects the relationship.
An Example of the Paradox
The Exercise Study
Let's elaborate on the definition with an example. You're in charge of a study that compares how two weight‐loss techniques — Diet and Exercise — affect the weight loss of overweight patients. Overall, you had 240 patients participate in the study, with 120 assigned to a weight‐loss diet and the remaining 120 assigned to a supervised exercise regimen.
At the end of 30 days, you measured each group's weight loss. The data showed that 70 dieters and 57 exercisers lost significant weight, representing 58% in the diet group and only 48% in the exercise group — a significant difference. So, should you conclude that diet is better than exercise?
No, and this why Simpson's Paradox can be so tricky! When the data are stratified instead by the starting Body Mass Index (BMI) of the participants, as shown below, a clearer picture emerges:
When examined by BMI group, you can clearly see that the percentage of patients who lost weight in each BMI group was smaller among the dieters than among the exercisers. The surprising ("lurking") variable is the unbalanced allocation of obese and severely obese patients in the Diet and Exercise groups.
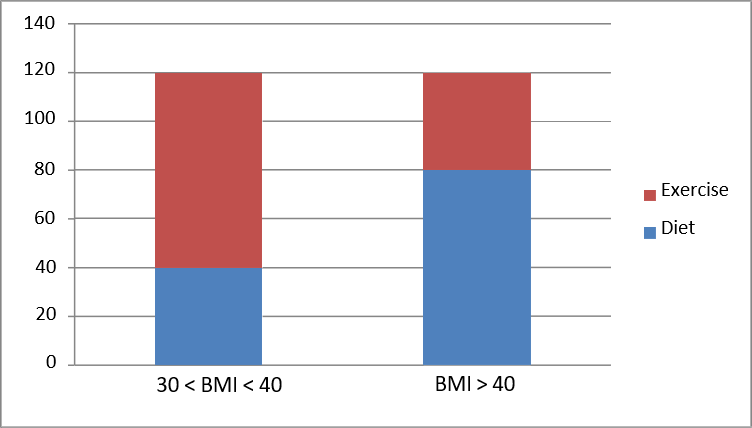
As you can see, the numbers are flipped between the two groups: 40 obese and 80 severely obese in the Diet group, and 80 obese and 40 severely obese in the Exercise group. Since it appears that the severely obese group benefitted disproportionately more from each treatment, the Exercise group was penalized simply due to the smaller number of severely obese in that group.
Simpsons's Paradox at Work: The percentage of patients who lost weight was higher for exercisers among both obese and severely obese patients, but when you aggregate the two groups, the dieters appear to do better.
Why Did This Happen?
Two factors are at play here. First, there is an overlooked confounding variable (BMI), and second, a disproportionate allocation of BMI levels among the experimental (diet and exercise) groups. We do not know the reason for the disproportionate allocation, but we might guess that the patients somehow self selected themselves into the two groups.
Simple charts can go a long way to explain what is going on in the underlying data. See for example this column chart from Microsoft® Excel® that depicts the disaggregated data, showing the proportions of dieters and exercisers in each BMI group:
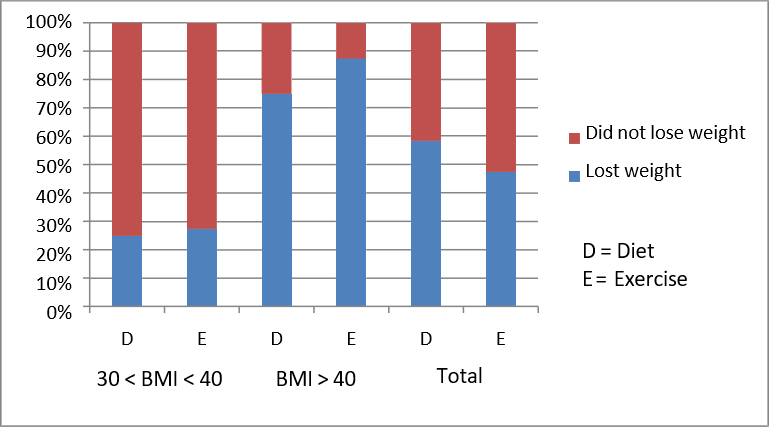
The chart below shows the proportions of weight loss and non‐weight loss patients among the different subgroups:
It is clear that more exercisers lost weight in each BMI group (look at the levels of blue across the first two pairs of columns,) but that in the aggregated sample the proportions seem to be reversed.
How to Avoid the Paradox
To avoid spurious results, it is always good practice to examine whether the relationship in the aggregated dataset holds up in it subsets, especially when some groups are not equally represented as others in the data. Another way may be to weight the samples according to their sizes.
Unfortunately, statistical analysis tools are just that — tools to help you organize and analyze the observed data. They cannot tell you anything about data that were not observed or not included in the analysis.
So it is very important to involve a cross‐functional team and especially subject matter experts and practitioners in the initial planning and selection of the variables to be measured. After they collect the data, the only way to try to avoid this pitfall is to visually and otherwise examine meaningful subsets of the data.
Conclusion
Simpson's Paradox will generally not be a problem in a well‐designed experiment or survey. You can identify possible lurking variables ahead of time and properly control them by eliminating them, holding them constant for all groups, or including them in the study.
Proper randomization also goes a long way in minimizing the effects of a lurking variable that might have been missed. The Analysis of Covariance, in which possible variables (covariates) associated with the response (in our example the starting BMI was not related to the treatments, but did affect weight loss) are added to the model, will also help.
However, if you don't have the option of planning the study but are given the data from a database and asked to "find what you can", the lesson of Simpson's Paradox is to always look at the data at several levels of aggregation, as in the example above.