What is the power of a test?
The power of a statistical test gives the likelihood of rejecting the null hypothesis when the null hypothesis is false. Just as the significance level (alpha) of a test gives the probability that the null hypothesis will be rejected when it is actually true (a wrong decision), power quantifies the chance that the null hypothesis will be rejected when it is actually false (a correct decision). Thus, power is the ability of a test to correctly reject the null hypothesis.
Why is it important?
Although you can conduct a hypothesis test without it, calculating the power of a test beforehand will help you ensure that the sample size is large enough for the purpose of the test. Otherwise, the test may be inconclusive, leading to wasted resources. On rare occasions the power may be calculated after the test is performed, but this is not recommended except to determine an adequate sample size for a follow‐up study (if a test failed to detect an effect, it was obviously underpowered ‐ nothing new can be learned by calculating the power at this stage).
How is it calculated?
As an example, consider testing whether the average time per week spent watching TV is 4 hours versus the alternative that it is greater than 4 hours. We will calculate the power of the test for a specific value under the alternative hypothesis, say, 7 hours:
The Null Hypothesis is H0:µ = 4 hours
The Alternative Hypothesis is H1:µ = 4 hours
Where µ = the average time per week spent watching TV. Under the null hypothesis µ is written as µ0 and under the alternative it is written as µ1. So here µ0 = 4 and µ1 = 6. Suppose the standard deviation from past data is known to be 2 hours. To find the power of this test for a sample size of 4:
1. At the 5% significance level, the decision criterion for the test is to reject H0 if Z > 1.645, where:
The 5% critical value from the standard normal distribution is 1.645. Equating the critical Z‐value to the calculated Z gives the corresponding (hypothetical) sample mean value:
2. Calculate the Z‐statistic assuming the alternative hypothesis is true, i.e., µ1 = 6:
3. P(Z > -0.355) = 0.6387. The power of the test is approximately 64%. In general, tests with 80% power and higher are considered to be statistically powerful.
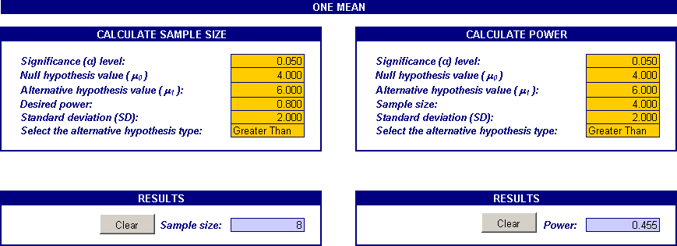
To find the sample size required to achieve a target power, work backwards from the power. As you can see, it is fairly complicated to obtain the power even for a simple one sample test. Many statistical software programs perform statistical power analyses, among them: Minitab, SAS/STAT, Stata, R, SPSS, SamplePower 2.0, and G*Power. The MoreSteam.com lessons on Hypothesis tests as well as the MoreSteam Excel add‐in EngineRoom provide templates to make power and sample size calculations for statistical tests on one and two proportions, means and One‐way ANOVA for multiple means. Here's a screenshot of the sample size and power calculations for a one‐sample t‐test in EngineRoom:

This calculator gives the power and sample size based on a one‐sample mean t‐test. On the right panel it shows the power of the test for the sample size of 4. After making the t‐test adjustments, this is 45.5%, lower than the value we obtained above using the Z‐distribution. On the left panel the calculator shows that the minimum sample size required in order to achieve power of 80% is 8. So you would need at least 8 units to be assured that the one sample test described above has 80% power to detect the effect.
What factors affect the power of a test?
To increase the power of your test, you may do the following:
- Increase the effect size (the difference between the null and alternative values) to be detected
- Increase the sample size(s)
- Decrease the variability in the sample(s)
- Increase the significance level (alpha) of the test