OEE, or Overall Equipment Effectiveness, is a classic performance metric used to score the overall efficiency of a process. The first word, Overall, is key, as OEE is a score aggregating several metrics into the final score. OEE is typically considered a manufacturing metric, but let’s try applying it to a service process. Two of MoreSteam’s learning simulations (SigmaBrew DMAIC and SigmaBrew InBox) are built around the mythical company SigmaBrew, so we’ll stick with the coffee theme today. OEE assumes that we can run the process continuously over the scheduled period, so this SigmaBrew location will be the first airport location, with constant demand throughout the day.
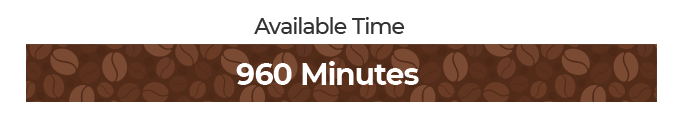
To calculate OEE, start with a typical 24-hour day. If SigmaBrew opens at 6 am and closes at 10pm, that gives us a planned schedule of 16 hours each day (24 hours minus the 8 hours we’re closed). Let’s also assume that, on average, we can produce and serve one cup of coffee per minute. So, 16 hours multiplied by 60 minutes in an hour gives us 960 minutes in our planned day, so our theoretical maximum cups of coffee delivered is 960.
OEE Component Number One: Availability
The first component of OEE is called Availability. Availability looks at how many of the 960 minutes of our day are actually available to serve coffee. The events that impact availability are binary, or "on/off" types of events.
The first, and typically most significant, is changeover or setup time. We could start the day in the coffee shop by brewing a giant 960-cup pot of coffee. We would never need to interrupt the sales of coffee during the day to stop and brew a new pot of coffee, but a batch of this size comes with quality problems (stale/cold coffee).
Caution: spending less time on setups, either by doing them more quickly or by doing less, improves the OEE metric similarly. But beware, enhancing OEE by doing fewer setups with larger batches creates other problems. It adds WIP (work in process), increases lead team, and reduces your flexibility to respond to changes in customer demand. Simply put, you're improving one metric to the detriment of another.
Being a bit more realistic, we might reasonably expect that we can brew ten or twenty cups of coffee at a time. Now, assuming we have only one person doing the selling and the brewing, if they’re brewing, they’re not selling, and our ability to deliver 960 cups of coffee drops.
So, we need additional metrics to keep OEE in check. This brings us to Little’s Law.
Short lead time means we can adapt to market demands and changes in customer expectations. Short lead time only comes from managing the WIP in our process and keeping it at a target level.
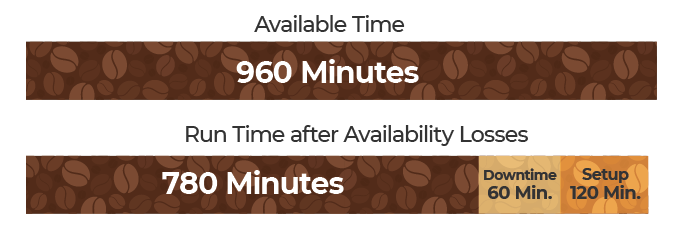
‘Exit Rate’ is the other component of Little’s Law, and monitoring it is already part of OEE, so we’ll get to that in a moment. But first, let’s look at the other event that impacts availability: downtime, whether it's planned or unplanned. If our company policy requires that we never grind more than 50 cups worth of beans at a time, then for every 50 cups of coffee, our solo operator will have to stop selling coffee and grind some beans. That’s planned downtime, which takes away from our ability to sell cups of coffee. Unplanned downtime happens with the grinder jams up and needs to be cleaned. Again, our solo operator is interrupted and forced to take time away from selling coffee to fixing the bean grinder. Our 960 minutes of theoretical capacity has taken a bit of a hit and might look like this now.
At this point, we’ve lost 180 minutes of the 960 minutes originally available, and our OEE is down to 81.25%.
OEE Component Number Two: Performance
The next component of OEE is called performance loss. Recall that we assumed the average time to serve a cup of coffee is one minute. If slowdowns cause that average to exceed one minute, that’s called a performance loss.
For example, say that our solo worker in the coffee shop is relatively new at the job, and they just can’t quite keep up with the target of one minute to serve a cup of coffee. That’s a performance loss. In traditional manufacturing businesses, OEE performance loss is often related to machine maintenance. Tooling gets dull, bearings wear, and the machine just can’t keep up the original pace of when it was new.
The ‘Exit Rate’ component of Little’s Law fits perfectly with the Performance component of OEE. Exit Rate is affected by the performance of the process and downtime, as both impact the number of cups of coffee that can be delivered. In this sense, Exit Rate is an aggregate metric while OEE Performance is a more specific metric that impacts Exit Rate.
Caution: As we see, OEE is an aggregated metric consisting of several components. Exit Rate is also an aggregated metric that consists of several components, and both OEE and Exit Rate are lagging metrics. As you determine the metrics you’ll use to monitor and control your processes, you will need to figure out where you might need more specific, leading metrics to improve OEE and Exit Rate. For instance, if the coffee grinder getting jammed is a regular downtime event, and we know it has a big impact on our ability to serve coffee, we need a specific metric to monitor the grinding operation to increase its performance. For example, if we observe the count of cycles on the grounder, we will probably decrease downtime in the grinder and improve the exit rate.
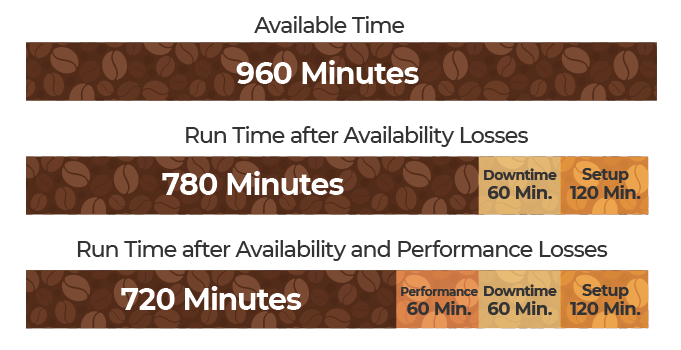
Back to SigmaBrew. Say that our newly hired operator is about 8.3% slower than standard in serving a cup of coffee. We lose 60 minutes of run time due to this performance slowdown, and our OEE drops to 75%.
From above, OEE based just on Availability losses is 81.25%.
OEE Component Number Three: Quality
The last component of OEE is quality. Losses due to poor quality are the final impact, further reducing the ‘good’ cups of coffee sold. Perhaps our batch size is too big (the 960-cup pot), and the coffee is burned, stale, or cold. Customers reject the coffee, and it gets discarded. Quality is an aggregated metric, as many failure modes might cause the coffee to be considered defective. Once again, you may need more specific metrics to monitor and control specific attributes that impact the quality of the coffee. For the Exit Rate metric, quality is another factor affecting Exit Rate as we only get to count good exits, not bad ones.
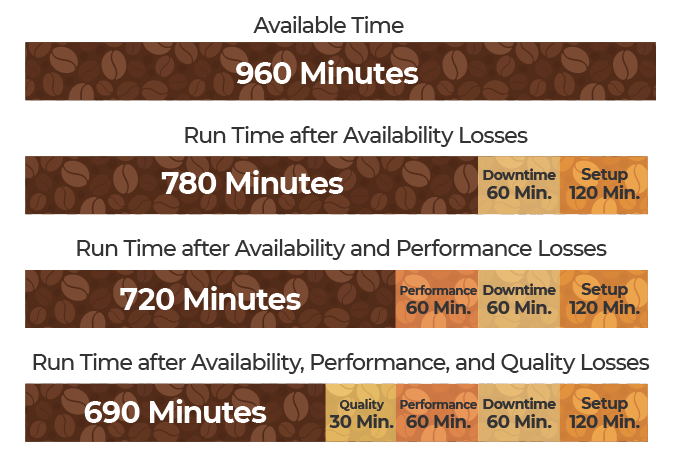
Considering quality issues that cause some cups of coffee to be rejected, we finally have arrived at our complete OEE metric. Say that 30 cups of coffee are rejected throughout the day. Our OEE quality losses calculations are:
From above, OEE Availability Loss is 81.25%, and OEE Performance Loss is 92.3%.
We're Not Done Yet
Hopefully, this has been a helpful explanation of Overall Equipment Effectiveness (OEE).
On the topic of balance, we’re not done yet. This blog focused on the fundamentals of OEE and the need to balance OEE with additional metrics. We focused on producing a single product, our generic cup of coffee. But what if we want to understand the OEE of a real coffee shop with dozens or hundreds of different products? How can we understand OEE in that context? What about our average time to make a cup of coffee? Can we rely on that being one minute when we have variations in the types of coffee we serve? Probably not.
Key Takeaways
OEE is an aggregate metric, and you may need to have additional, more targeted and specific metrics to monitor and control your process
Little’s Law guides us towards additional key metrics: WIP, Lead Time, and Exit Rate that also need to be part of every process
Balance! Finding and tracking the right balance between metrics is a fundamental part of every process in every organization. A process that is myopically driven by a single metric will rarely be a successful, long-lived process.
In my next blog, we’ll dive into the abyss of complexity. How do we identify which distributions to use to characterize the variability in our process? How should we segment our product and service offerings to better understand and calculate OEE and manage our processes? We’ll look at these questions and use process modeling to examine and understand the impact variation and complexity have on OEE and the ability of our processes to deliver as needed and promised. Until next time…
Read the follow-up blog: Modeling OEE: Reality is Rarely Well Behaved