In my last blog, we went through the basic components of the Overall Equipment Effectiveness (OEE) metric and how to calculate it. Traditionally OEE has been applied to a single piece of equipment in a manufacturing setting, hence the ‘equipment’ in the name. In this article, we’ll look at how process modeling helps us understand how OEE behaves when real-world variation and complexity are introduced.
The coffee shop example of the last blog extended the concept to the overall effectiveness of the operator in the coffee shop. Consequently, the metric became more of an Overall Process Effectiveness, or OPE. OPE is a lot easier to say than OEE, so maybe we’re on to something here.
But calculating OEE or OPE assumes a fairly simple and predictable process. In reality, most processes involve variation, downtime, and product complexity that make performance much harder to understand. One way to explore those realities is through process modeling.
Those of you with some Lean experience probably noticed how the coffee shop process example closely paralleled another common metric, rolled throughput yield (RTY). Rolled throughput yield (RTY) measures how losses accumulate across the steps of a process by multiplying the yield at each step. This comparison is useful because both OEE and RTY effectively describe losses that occur as work moves through a process.
A process that starts with 100 widgets, has three steps, and a percent yield of 90% at each step only produces 72 good widgets. The first step begins with 100 but loses 10 to poor quality (90% yield). The second step starts with 90 but loses 9 (10%) due to poor quality. The third step starts with 81 and loses 8.1 (round up to 9), yielding 72 good widgets by the end.
Rolled Throughput Yield = 0.90 0.90 0.90 = 0.729 = 72.9%
The coffee shop example used the components of OEE, availability loss, performance loss, and quality loss as yield losses of time through the process. Does that make OPE a ‘fusion’ metric?
Joking aside, we should always be open to taking the best parts of existing concepts and combining them to accomplish what we need from our processes. ‘Amateurs borrow, professionals steal.’ And we’re continuous improvement ‘professionals.’
Using Process Modeling to Represent OEE Losses
In the SigmaBrew coffee shop example of the last blog, we calculated the OEE of the single operator performing all of the process steps required to deliver a cup of coffee. In the baseline example, there was no variation and no loss, and with the shop open for 960 minutes, the operator could deliver 960 cups of coffee to meet customers’ demands.
Using Process Playground, MoreSteam’s discrete event simulator, the model would look something like this:
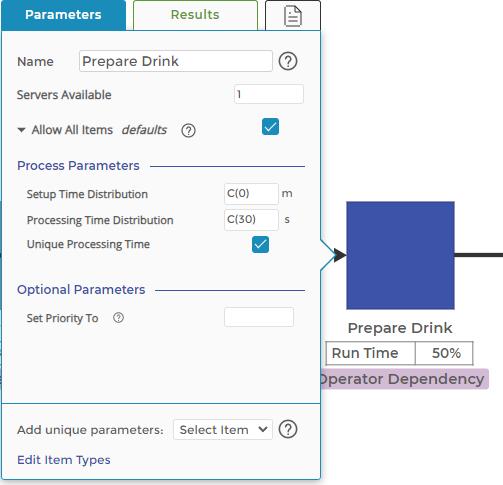
Demand is entered, without variation, in the ‘Takt Time’ block, and each blue square activity block holds the fixed average time to perform that step in the process. Note that there is no variation entered for any of the times. The C(30) entry in the image to the right shows the fixed, average 30-second time required to prepare the drink. The other two activity blocks represent the 15-second order and 10-second delivery times.
The “Perfection Staff” resource block at the top left of the model represents our single operator in the process. They perform each step, shown by the “Perfection Staff Dependency” label under each activity. The utilization of the staff member shows under the block as 91.67% and 960 cups of coffee are delivered, as shown in the final exit block on the right end of the model.
Fast forward to the final model, and we can see the effect of the various OEE losses. A second process has been added below the original to represent the availability losses, setup, and downtime. Those losses are set to occur, on average, every hour and to last about eleven minutes. Note that the Operator resource block is associated with the Downtime and Setup activity block, consuming the operator’s time to perform those tasks.
The decision block at the end of the model represents quality losses. It’s a simple probability entry that randomly determines if the cup of coffee gets rejected. If rejected, the order returns to the ‘Wait to Prepare’ queue to be prepared again. The priority of the order jumps to the front of the line.
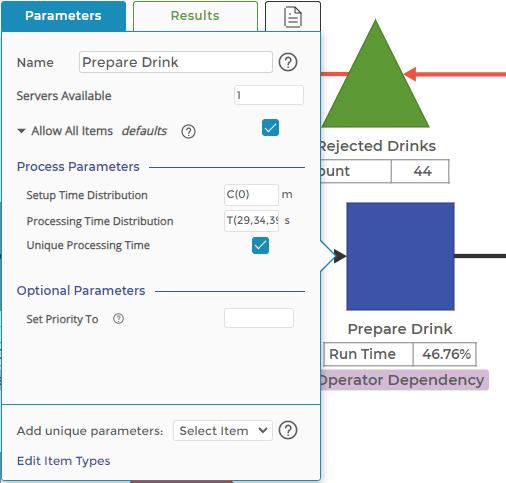
The original three process activities include performance losses. Rather than a simple, constant time to perform each activity, they are now variable and with a higher average to reflect the observed performance losses. The Prepare Drink activity time now looks like this:
Note the use of the triangular distribution to represent the time to prepare the drink. We might jump to using the Normal distribution for an activity like this, but the triangular distribution is widely used to represent service times in processes.
The minimum parameter of the distribution is relatively easy to identify, as it represents the perfect, no-waste time it takes to perform the task. The maximum represents the reasonable maximum time at which there is an intervention of some sort - either the customer balks and leaves, a supervisor intervenes, or something like these events happen to ‘fix’ the process. Finally, the mode parameter is typically available to give us a sense of the central tendency of the time for the task.
Overall, the output of the coffee shop is about 673 cups of coffee versus the ‘perfection’ scenario of 960 cups. By modeling each of these various sources of loss, we can use the model to predict the future performance of the process if we make changes and improvements to each of these losses.
For instance, if we cut our availability losses in half, the model would predict that we can deliver 751 cups of coffee, an 11.5% improvement. We can predict the project’s financial return if we know the cost of the improvements and the value of an additional 11.5% in sales.
The model can also be used to examine the impact of external factors:
- What if demand suddenly increases?
- How much staff would we need to add to keep up with the new level of demand?
- What if demand varies during the day - what staffing plan will work best?
These types of questions and scenarios can be investigated with a process model, providing a virtual digital twin of your process to test and predict process behavior before you’re in the middle of the chaos. You can experiment with these types of models yourself using Process Playground in EngineRoom.
Preparing Data for Process Modeling
The first step in any process modeling exercise is mapping the process. And a good process map has two things: the process flow and data that describes what happens at each step. The first part, the process flow, isn’t usually too hard to figure out. The second part can be a little tricky.
Identifying the data needed and then mapping that to the data available can be an arduous task that takes time. Some of the problems might include:
- Data integrity: Has the data been collected reliably, with an acceptable measurement system?
- Data scope: does the scope of the data match the area of interest? A total lead-time measurement is of little use if we’re looking at a segment of the process.
- Data detail: does the data contain enough detail to describe the unique characteristics of each item? Demographic data, whether about our customers or the type of coffee we’re selling, is critical to understanding underlying differences in our products or services.
Once the data we need is collected, we need to start by assessing the stability and capability of our process. “Assess stability” should never exist without the companion words “with a control chart.” The control chart below shows the time to prepare our drinks in the coffee shop. The average is at 30 seconds, and the process is in control, but the variation may be unacceptable.
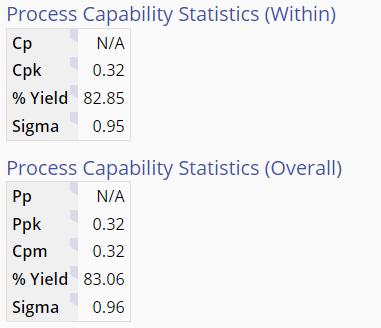
A quick look at process capability shows that the process isn’t particularly capable:
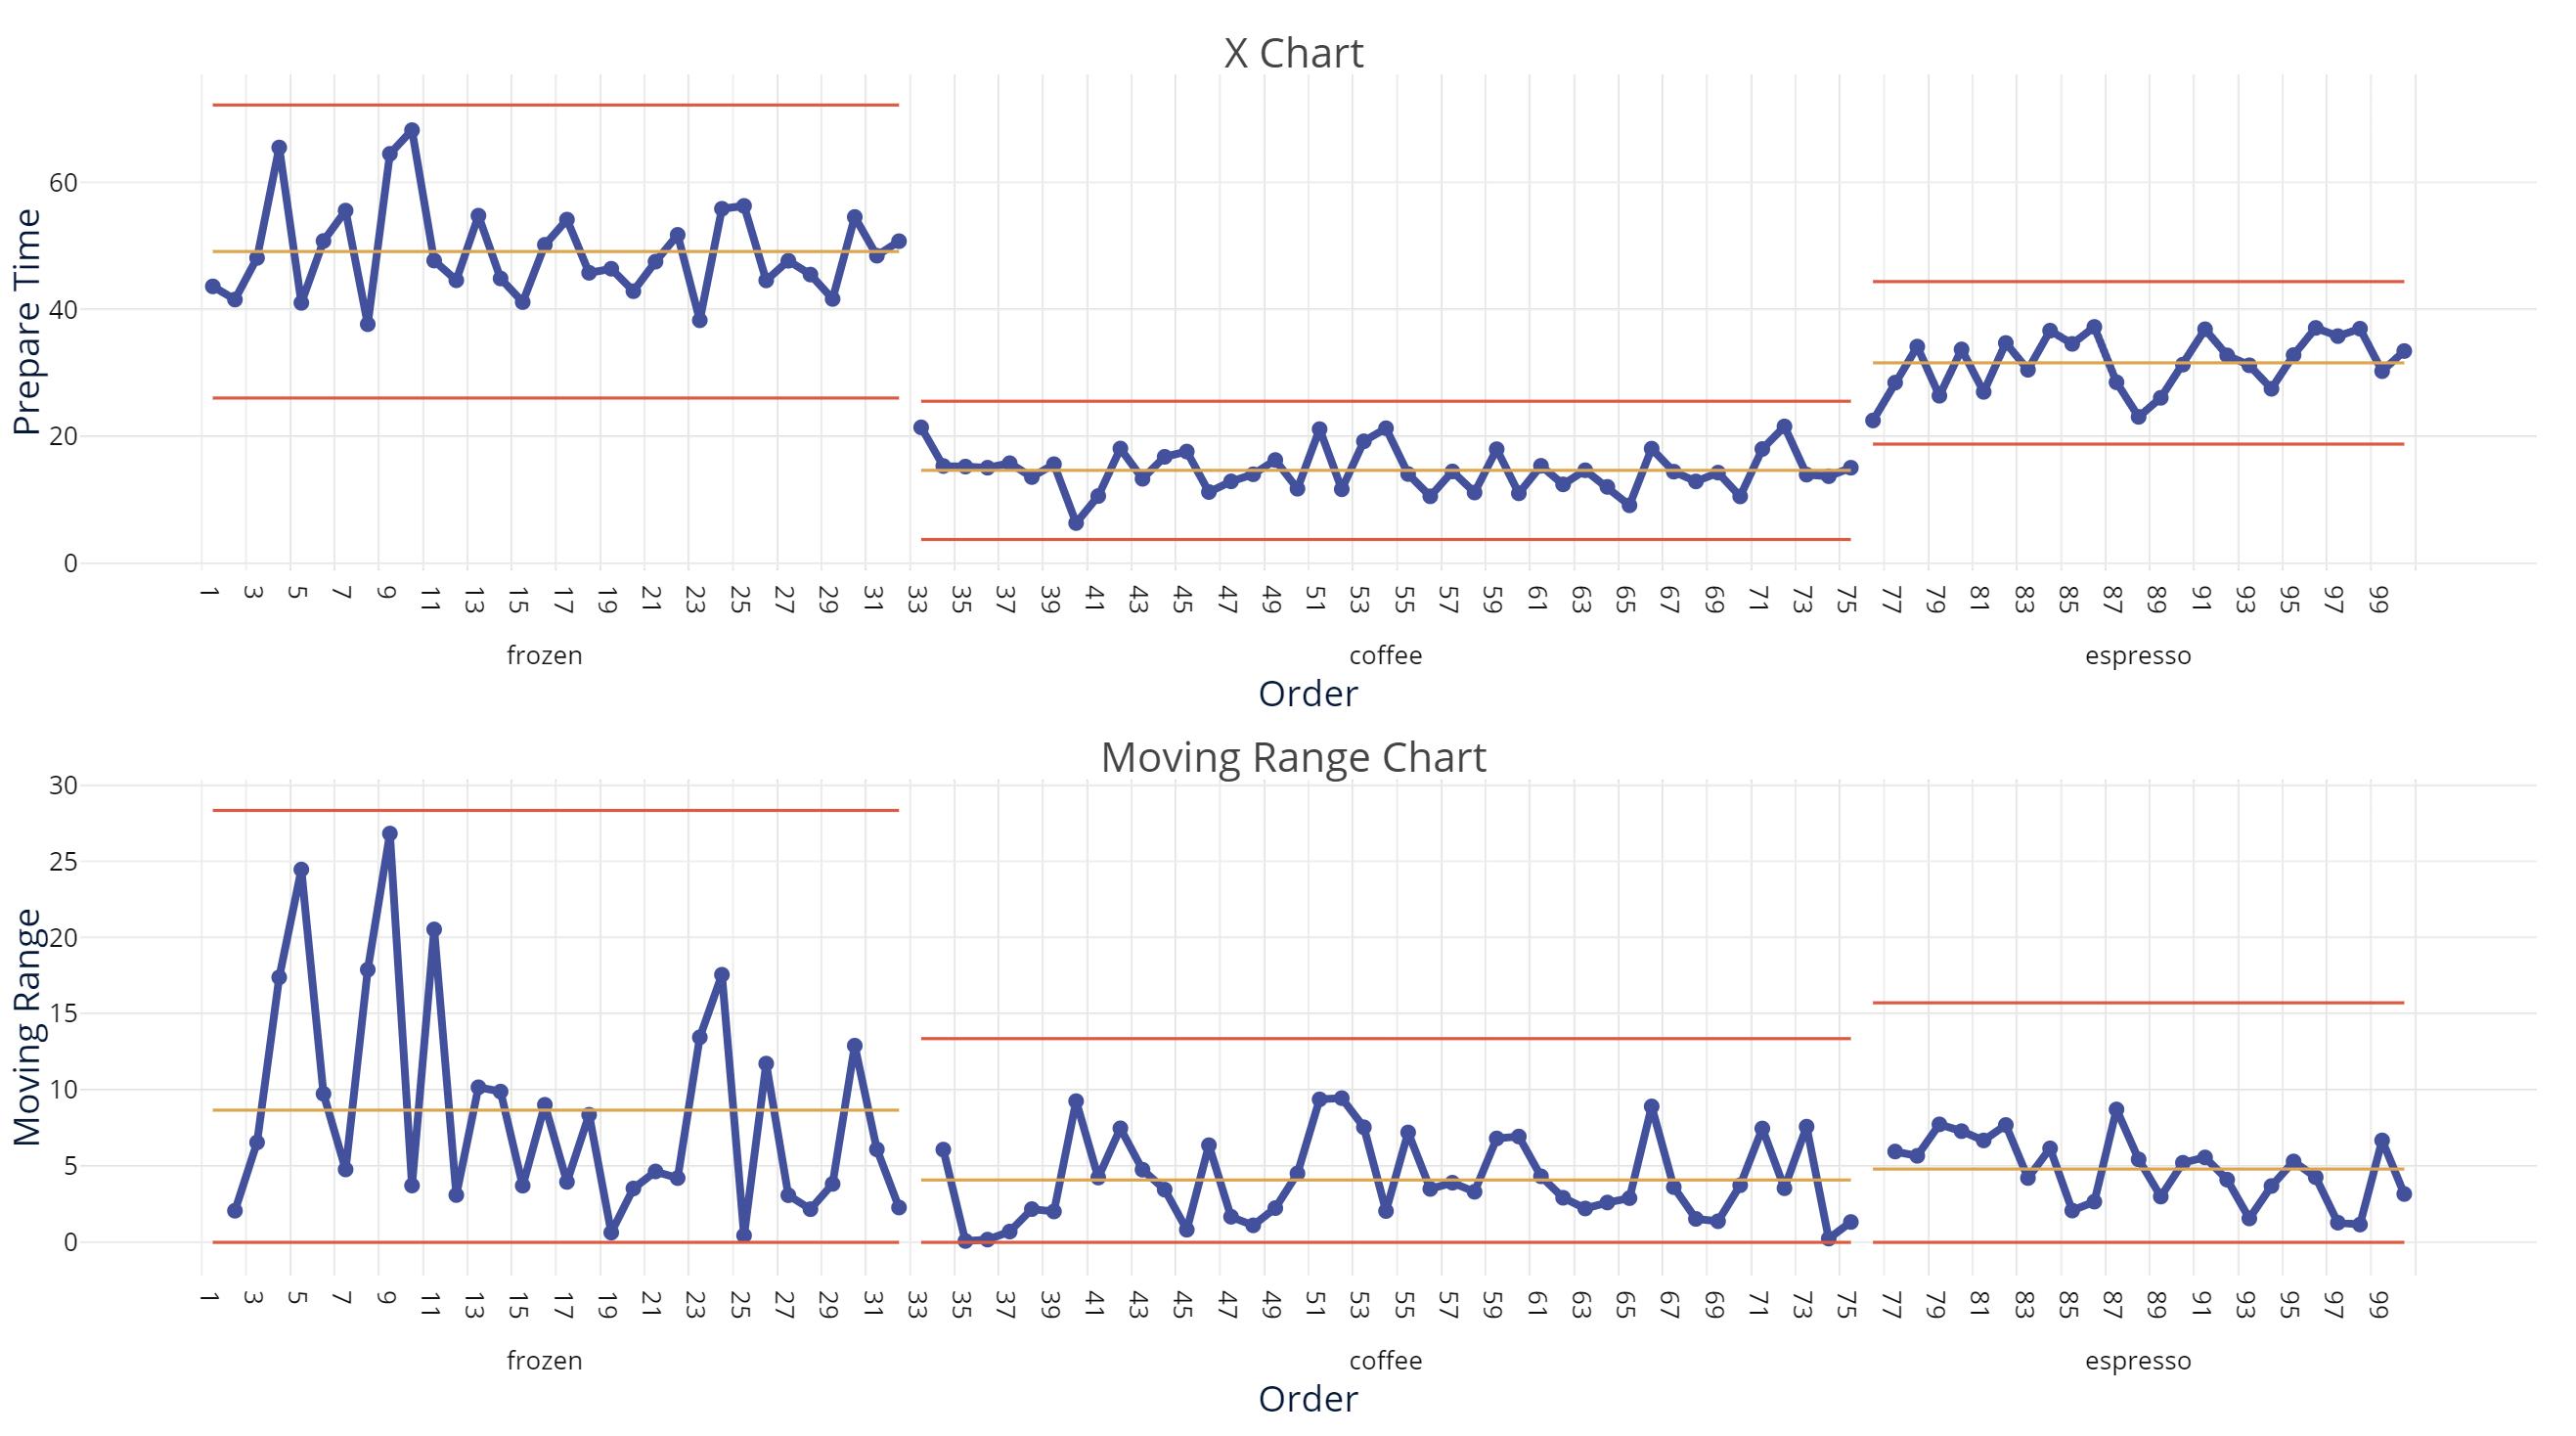
Diving a little deeper, we find that the marketing department came up with a few new product ideas, adding espresso and frozen blender-based drinks to the menu. The control chart becomes much more interesting and useful by breaking the data apart and using a stage variable to represent the different types of drinks.
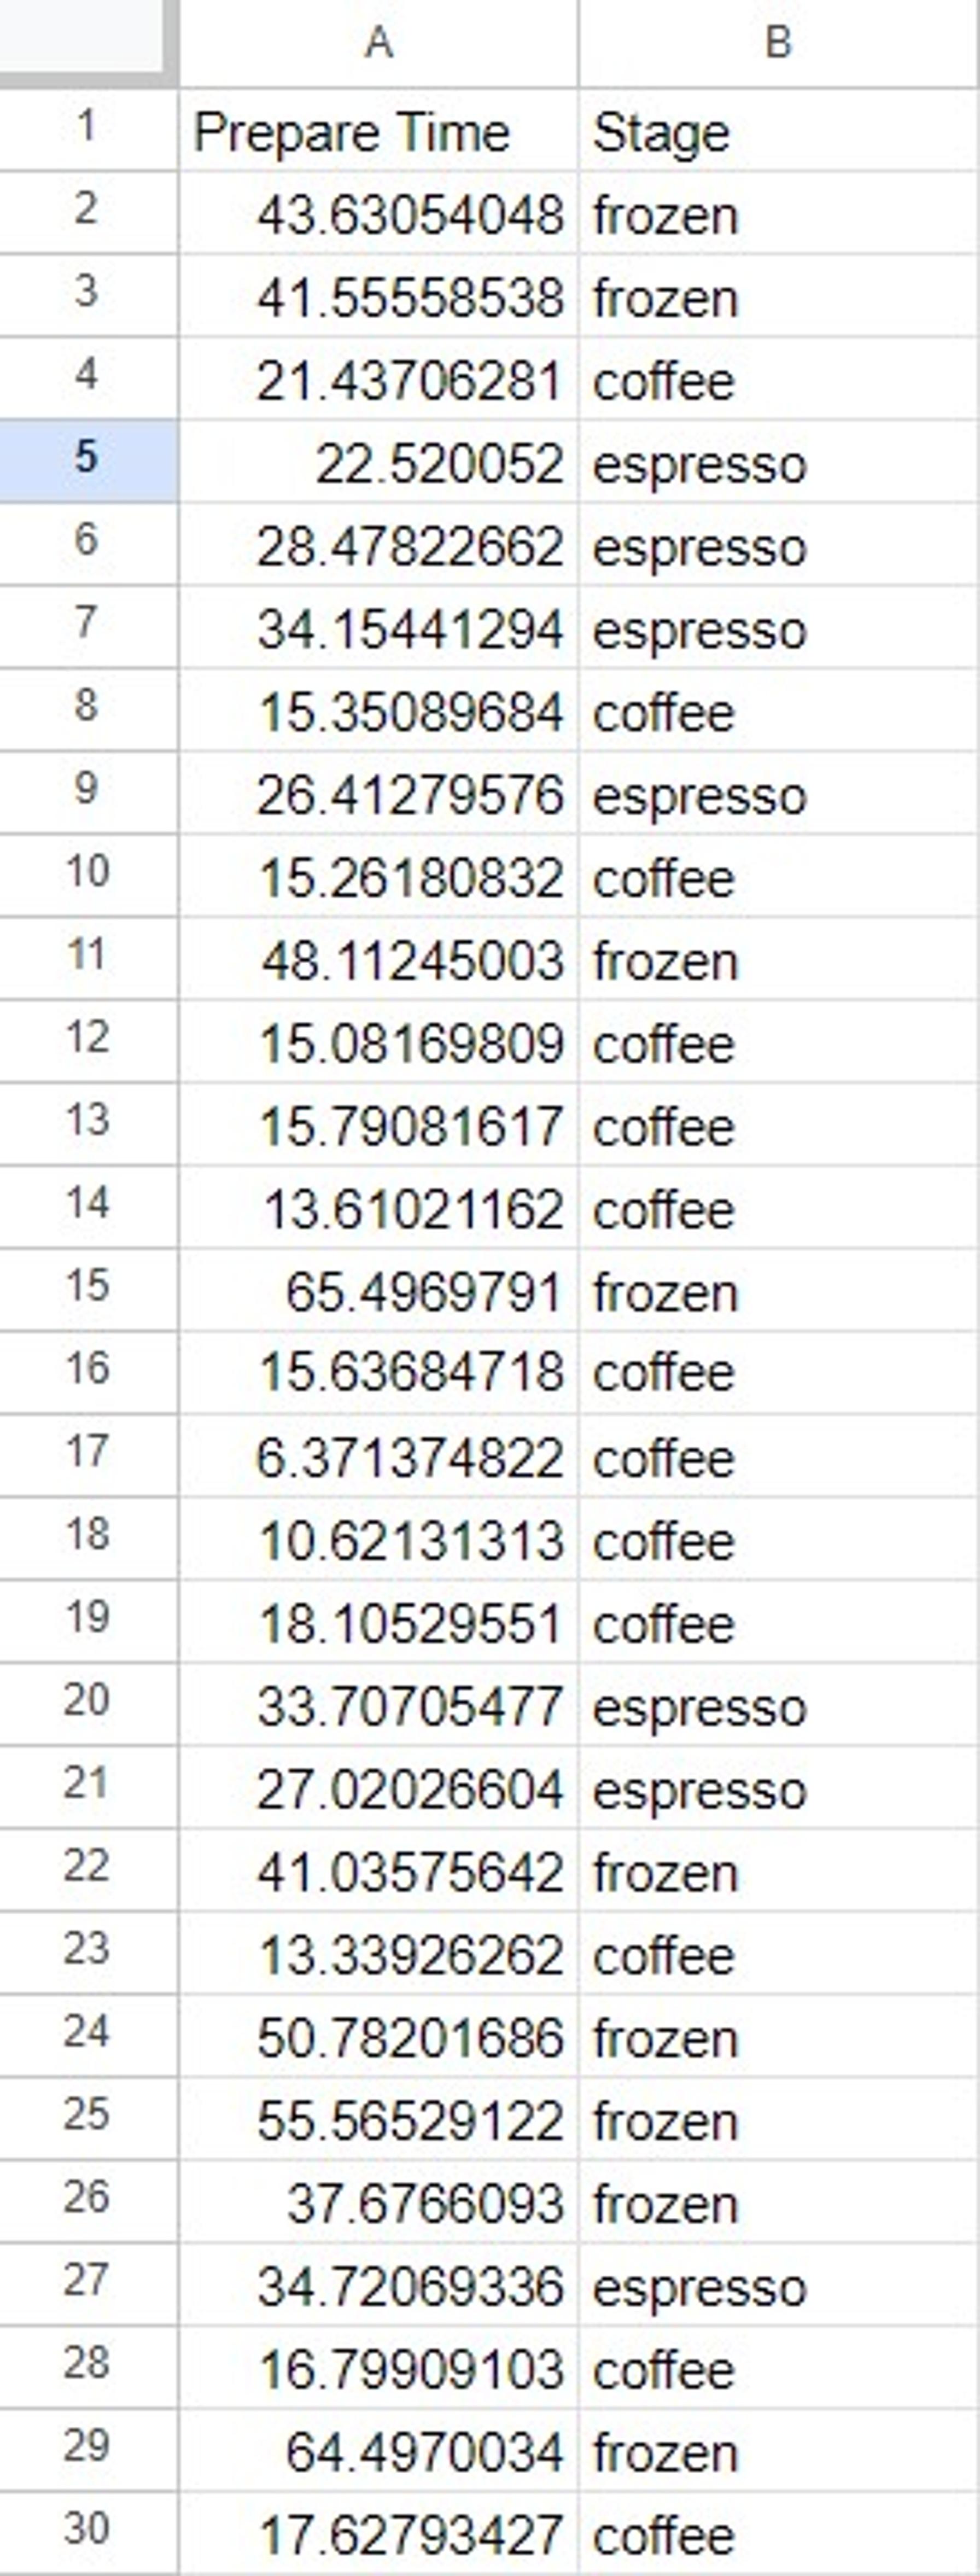
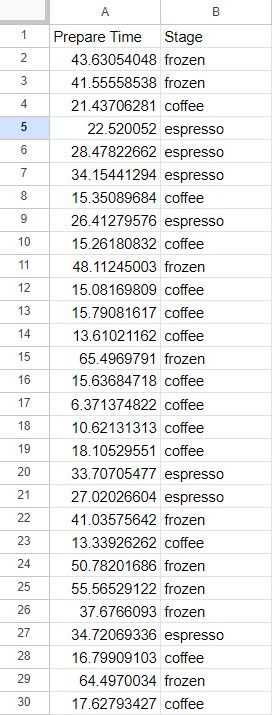
A sample of the data sheet used to make the control chart
From this realization, a whole new range of improvement possibilities becomes possible. Each subprocess defined by the drink type is stable, and the coffee and espresso processes are quite capable against our customer’s upper spec limit of 45 seconds to prepare the drink. Frozen drinks appear to be our problem, both in the average time to prepare and the variation around that average. Perhaps a separate process, a dedicated work cell just for frozen drinks, is a solution we should consider.
Using Process Models to Understand the Current State
Building a valid, reliable model that properly represents your process can be challenging. However, most of that challenge comes from the effort required to fully understand the process itself.
One large client described an interesting practice: they require building a Process Playground model for nearly every improvement project. The purpose is not just to simulate improvements, but to validate that the team truly understands the current process.
If the baseline model cannot replicate the current reality, that becomes a signal that the team needs to dig deeper into the current state. This approach leads to a far stronger understanding of the process, often revealing improvement opportunities that were not previously obvious. It also creates a validated model that can be used to safely test improvement ideas before implementing them.
Process modeling is frequently used to test improvement ideas before implementing changes. See how teams have used simulation and modeling in these three Lean Six Sigma success stories.
Why Modeling Real Processes Matters
Real processes are rarely as simple as the equations we use to describe them. Variation, product complexity, downtime, and shifting demand all interact to influence performance.
Process modeling provides a way to explore these interactions before making changes in the real world. By combining good data, thoughtful analysis, and simulation tools, organizations can better understand how their processes actually behave and make more informed improvement decisions. As processes become more complex, simulation and process modeling provide an increasingly valuable way to understand and improve how work actually gets done.
Key Takeaways
Data is vital to building an accurate, reliable process model
Diving deep into the data to understand and break apart subprocesses and families of related activities is a critical, albeit often missed, part of process analysis
Understanding how processes respond to complexity in offerings is challenging with our traditional tools but well within the scope of a discrete event simulation model