
More Flexibility. More Capability.
MoreSteam provides training and technology to help organizations build operational excellence in everything they do. We integrate Lean Methods, Lean Six Sigma, Agile Process Design, and PDCA to provide a flexible set of expert tools supporting Enterprise Process Improvement.
We are the leading global provider of online training certifications and technology for Lean Six Sigma.
We work with individuals, universities, and businesses large and small to provide proven solutions that are right for them. From interactive training to process improvement software, we are here to help you work as efficiently and effectively as possible.
700,000+ Professionals Trained

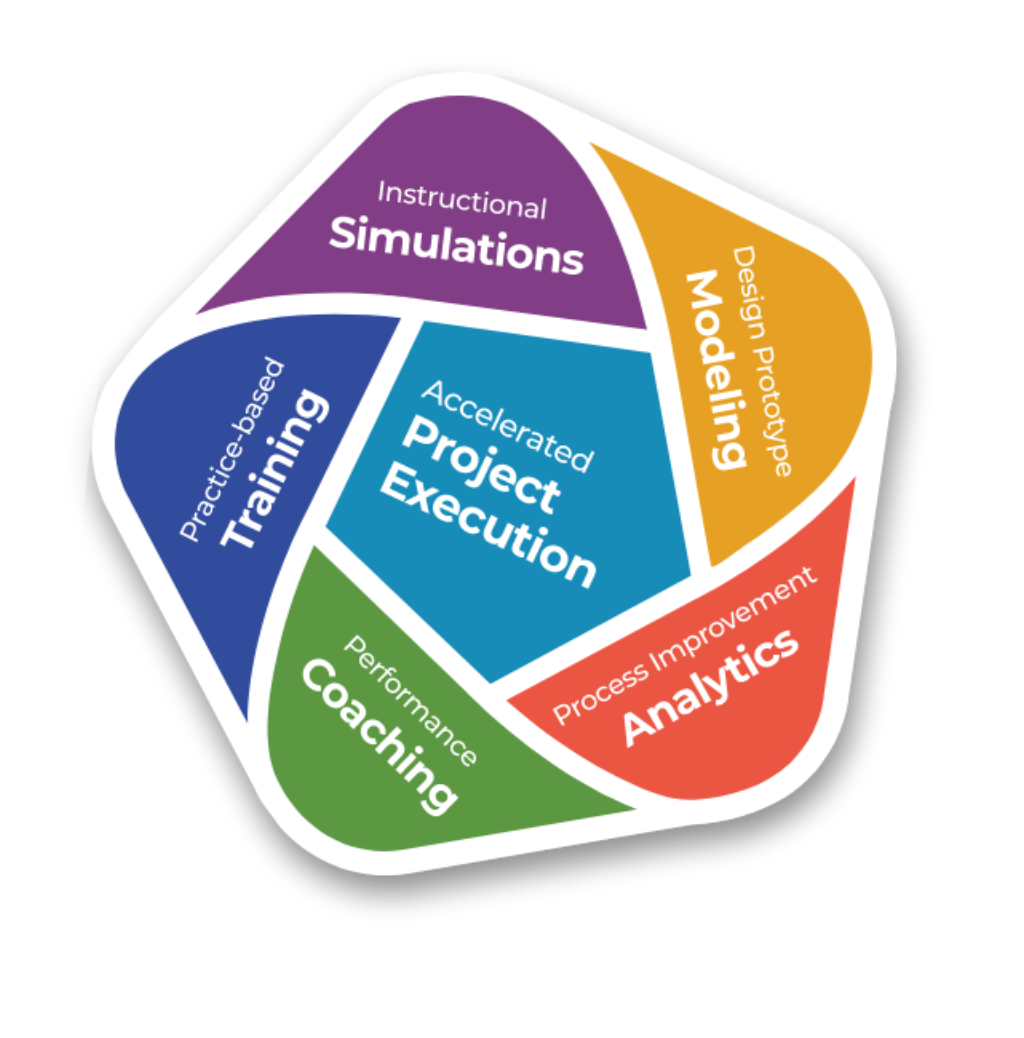
Technology to Empower Continuous Improvement
- Interactive Practice-based Online Training
- Accelerated Project Execution using TRACtion®
- Instructional Simulations and Games
- Data Analytics with EngineRoom®
- Process Modeling with Process Playground
- Performance Coaching using Coach View
A System for Continuous Improvement You Can Trust
MoreSteam offers the most comprehensive and effective Lean Six Sigma training in the world, selected by thousands of global organizations representing over 50% of the Fortune 500 companies as well as many leading universities. MoreSteam was the first to develop a complete online curriculum for Lean Six Sigma Green Belt and Lean Six Sigma Black Belt, and is the exclusive online Lean Six Sigma training partner of the Institute of Industrial and Systems Engineers.
Our Affiliations & Partners:


Stories in Continuous Improvement

Case Study
Process Modeling Fuels Operational Excellence in High-Stakes Industry
Explore Our Lean Six Sigma Training Offerings
Process Improvement Operational Excellence
What is Lean Six Sigma?
Lean Six Sigma is a methodology for improving processes ‐ and everything is a process! Lean Six Sigma is the combination of two approaches: Lean, which is a set of techniques for streamlining a process by eliminating waste and reducing non-value-added activities, and Six Sigma, which is a set of techniques for identifying and reducing defects in a process.
The goal of Lean Six Sigma is to improve efficiency, reduce costs, and increase customer satisfaction by constantly identifying and addressing problems in a systematic and data-driven way.
about Lean Six Sigma methodology and belt levels
FAQs
- Do you offer training and certification for individuals as well?
Yes! We have paths for every type of learner in our online catalog ‐ from self-paced online courses to instructor‐led hybrid training programs.
- Do you have coaches that support training and project work?
Yes. Our MoreSteam Client Services team has extensive experience across industries. They can support study halls, lead team onboarding, workshop planning, and coach projects.
- Will this prepare me for the ASQ exam?
Yes! Our content will fully prepare you to pass the ASQ certification exam. We also offer certifications for Green Belt, Black Belt, and Master Black Belt.
- Can I customize my training?
Our courses come with off‐the‐shelf customization options like industry flavor and data analysis software version. To discuss more please contact us.
- What is a blended learning approach?
Blended learning is an approach to education the combines the best of traditional, in-class learning methods with online elements offering a more flexible and personalized learning experience for participants.
- Still have questions?
Contact us to chat.
Want to talk about your specific needs?
We're happy to help answer questions, provide materials, or setup your enrollment.
No robots. Only humans.