Donald Wheeler’s latest article is another thoughtful installment of his ongoing gift to the quality improvement community. In this article, Wheeler offers a practical perspective on the use—and sometimes misuse—of formal measurement system analysis and illustrates how a statistical process control chart can serve as the unifying foundation of a DMAIC project. In Wheeler’s view, the control chart should be used throughout every phase of a project, not just as a point solution. I agree.
To evaluate a process's potential for improvement, Wheeler applies a variation of the Stability Index, which compares the actual performance of the process to its theoretical capability. The greater the gap between these two, the larger the Stability Index ratio¹. Despite its simplicity, this index is a powerful tool for identifying where to focus limited resources. across an organization. Once a process is selected for improvement, Wheeler turns to the tool that both visualizes process behavior and detects instability: the control chart. While not always the sole solution, it’s often the first—and best—step toward improvement. When used correctly, control charts expose both known and unknown sources of variation, making them essential to data-driven decision-making.
However, the key phrase here is used correctly—misusing a control chart can lead to no improvement or even introduce greater instability. Here are some common pitfalls that can hinder its effectiveness.
1. Using the Wrong Control Chart
Choosing an inappropriate control chart based on rational subgrouping, data type, or monitoring objective can skew results and reduce actionable insights.
2. Lack of Documentation
When a special cause is corrected without thorough documentation, the risk of recurrence remains high. Proper record-keeping ensures lessons learned translate into sustained process stability.
3. Failing to Take Action
Implementation of a control chart has no impact on a process unless the full control strategy is seen through. When a special cause is signaled on the control chart, action must be taken to investigate, correct, and document the uncharacteristic occurrence. Taking these steps are what will actually impact the process stability. Otherwise we are just drawing dots on paper.
4. Overcorrection Using Only Known, Controlled Inputs
If only known inputs are adjusted after a special cause occurs, the true source of instability may go unnoticed. A thorough root cause investigation is essential to drive meaningful, long-term process improvements.
As a statistical software company, we love complex statistical analysis - at the right time in the right situation. But we should always default to the simplest tool that gets the job done. The beauty of the stability index and control charts is that they don’t trade power for simplicity, especially when used as intended.
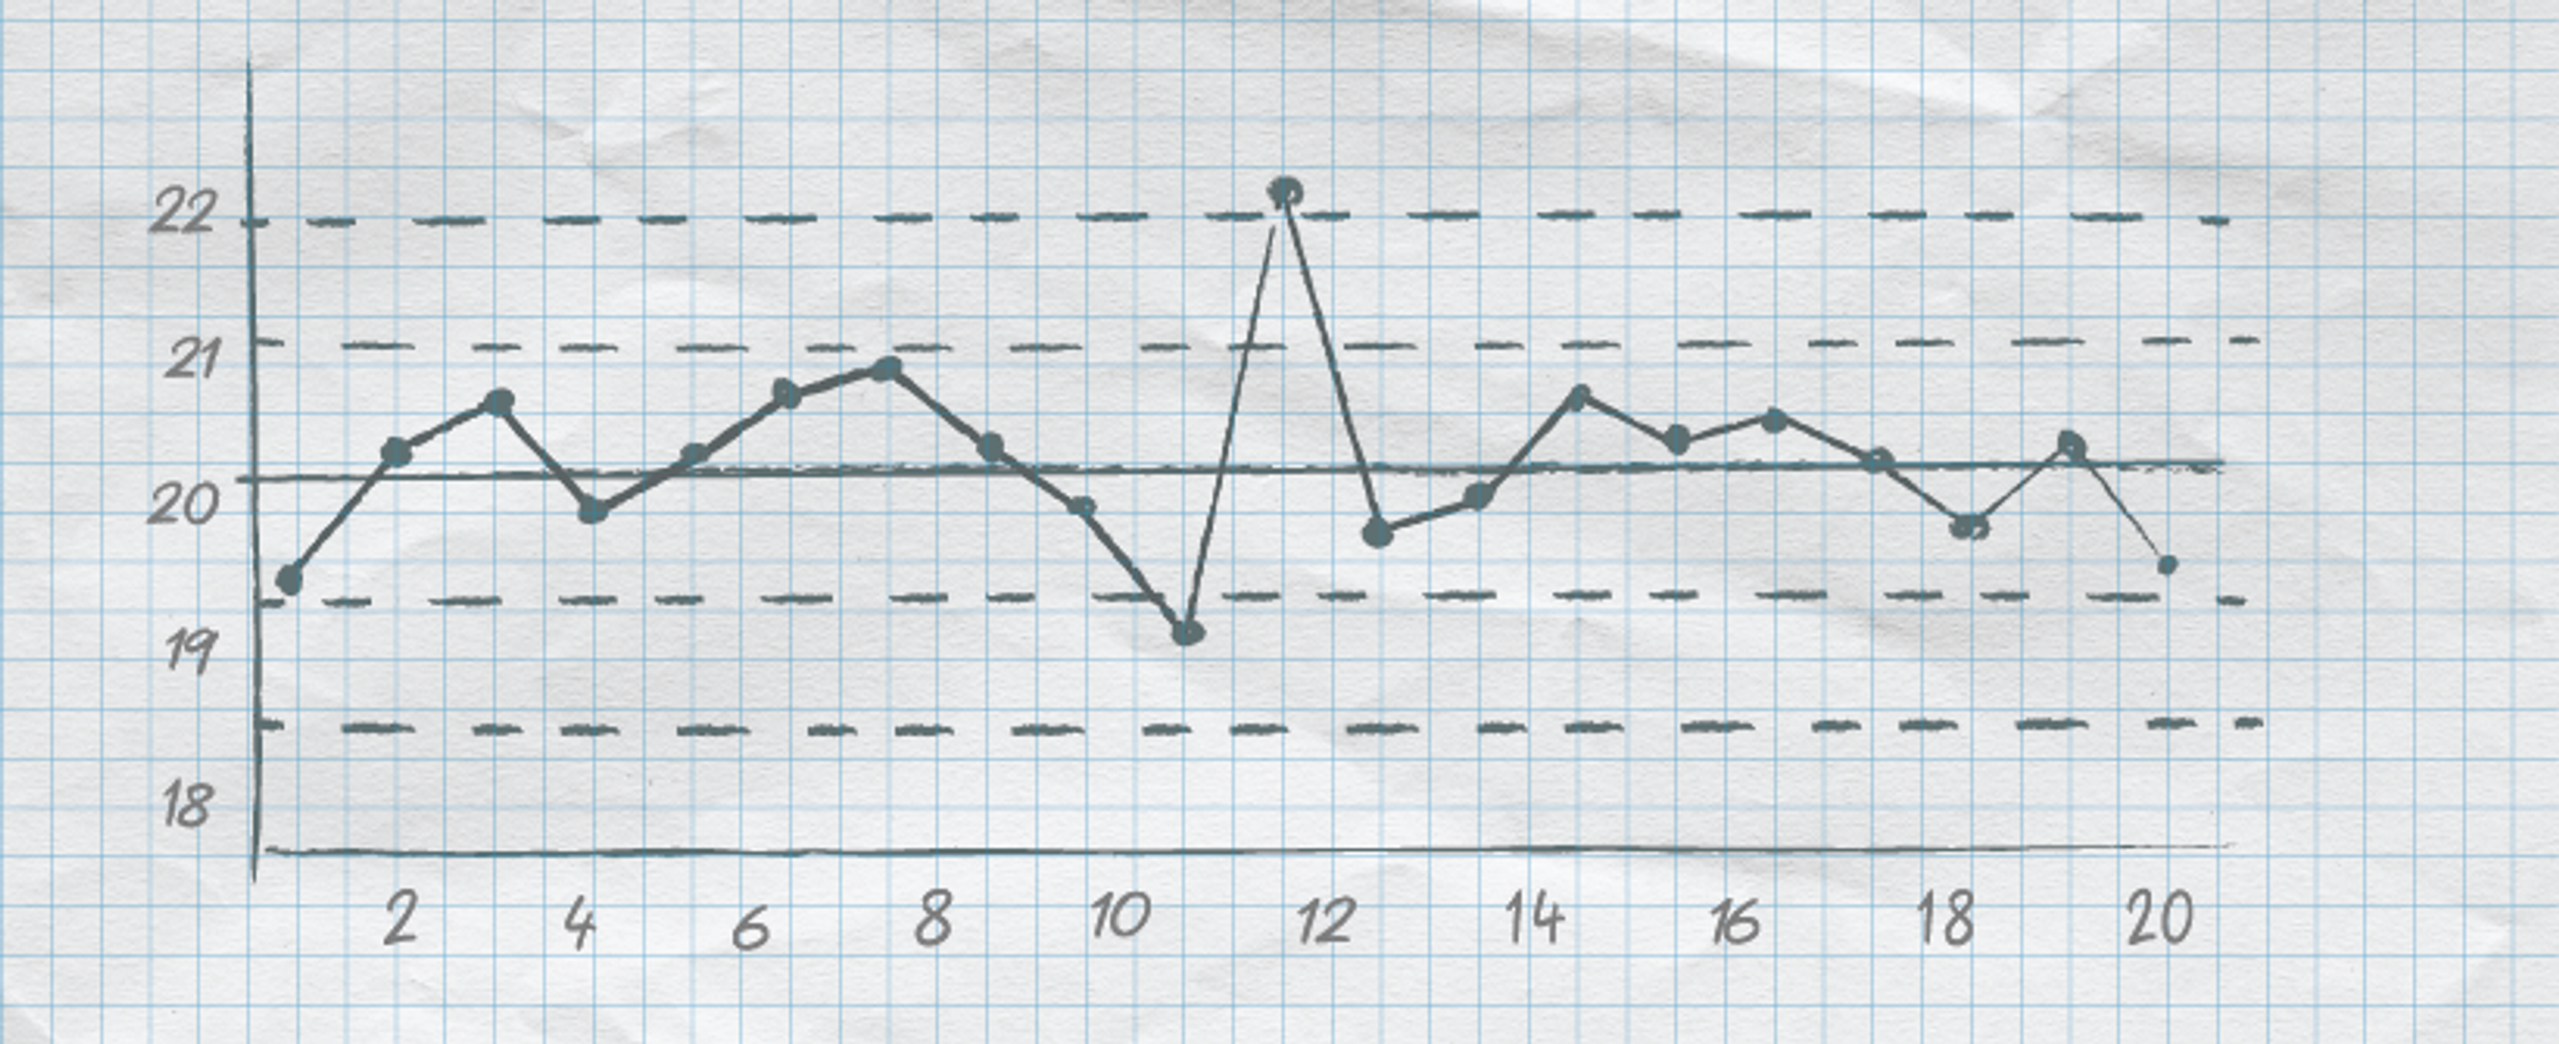
This isn’t new thinking. I remember when I was at Ford in the early 90s using paper control charts as the primary vehicle for an ongoing improvement "project" - with events circled, hypotheses noted, fishbone diagrams in the margins, and actions noted. It all made such a great mapping of the chain of critical thinking involved in making something work better. In the inevitable move to computer-based process control, we've lost a lot from not charting daily on paper and then annotating and writing notes by hand. Those old methods seemed to do a better job of really connecting the data to the thinking. But that doesn’t mean we can’t still use control charts to support and drive the thinking, we just have to better integrate them into the project flow. Wheeler’s article is a timely reminder of that imperative.
Check out the article here:
1. For further insights, see Stability Assessment with the Stability Index (Jensen, Szarka III, & White, 2018).