Root Cause Analysis
Description
Root Cause Analysis (RCA) is a systematic problem-solving technique used to identify and address the underlying causes of issues or problems to prevent them from reoccurring. It's a proactive approach that goes beyond addressing the symptoms of a problem and instead focuses on understanding the fundamental reasons behind it.
RCA empowers organizations to implement sustainable solutions that improve process efficiency, customer satisfaction, and overall performance.
Common Lean Six Sigma tools and methods to use while performing Root Cause Analysis Include:
- Fishbone Diagram
- '5 Why' Analysis
- Pareto Chart
- Process Mapping
- Root Cause Tree
- Statistical Analysis
- Control Charts
How to Start
Performing Root Cause Analysis (RCA) requires planning, data collection, analysis, and implementation of solutions.
Define the Problem: Clearly define the problem or issue you want to investigate. Be specific and focus on the symptoms, patterns, or trends affecting your organization's performance or outcomes.
Assemble a Team: Form a cross-functional team with representatives from different departments or areas of expertise who know the problem or issue. Gathering people with varying expertise in the RCA process ensures diverse perspectives.
Collect Data: Gather data relevant to the problem. This may include process data, performance metrics, customer feedback, incident reports, or other pertinent information to help understand the problem.
Analyze Data: Use data analysis tools and techniques to identify patterns, trends, and potential causes. Common tools for this stage include Pareto charts, cause and effect diagrams, process flowcharts, and statistical analysis. This stage is crucial because the thoroughness of your data analysis determines how much insight you'll gain on the root cause(s).
Validate Root Cause: Once the team identifies potential causes, it's time to validate them using data and evidence. Conduct experiments, tests, or simulations to confirm which cause or causes are contributing to the problem.
Implement Solutions: Develop and implement solutions based on the validated root cause(s). Consider short-term and long-term solutions that are practical, feasible, and aligned with your organization's goals and resources.
Monitor Results: The work doesn't end when the problem is solved. It is imperative to continuously monitor and track the effectiveness of the implemented solutions. Measure the impact of the solutions on the problem and overall process performance and make adjustments as needed to ensure sustained improvement.
Communicate and Document: Whether it's throughout the process or part of a debriefing at its conclusion, document the entire RCA process. This includes the data collected, every analysis performed, identified root cause(s), implemented solutions, and outcomes. Communicate the findings and recommendations to relevant stakeholders, and share the lessons learned across the organization.
Example
Let's look at an example of performing a Root Cause Analysis in a manufacturing setting. CircuitCore is a company that manufactures semiconductors, and it is struggling with a high rate of defective products during the final inspection process, leading to scrapped semiconductors.
Define the Problem: 5% of semiconductors are defective upon final inspection, representing a substantial waste of resources and raising concerns about the integrity of the production process.
Collect Data: A cross-functional team collects data on defect types and their respective frequencies. They build a Pareto chart of defect frequency by type:
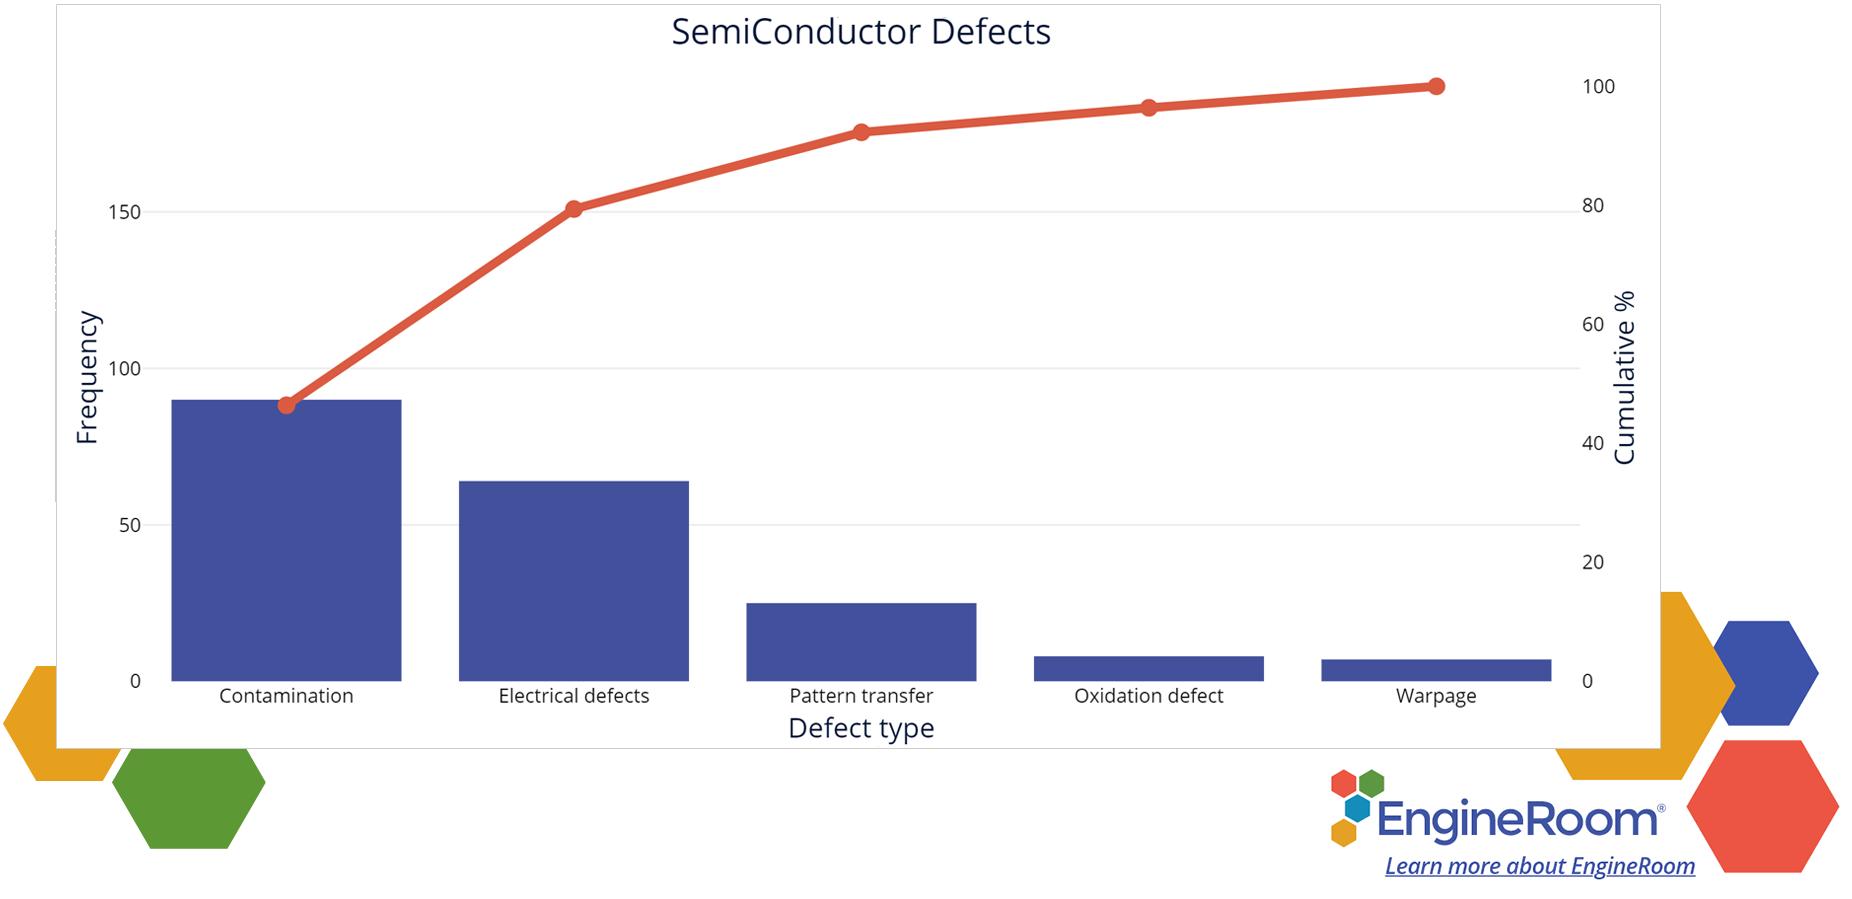
Analyze Data: Since "contamination defects" and "electrical defects" account for roughly 80% of total defects, the team decides to focus its efforts on these two defects. One team member's familiarity with the process allows her to inform the rest of the team that electrical defects are often the direct result of contamination, so the two defects may even share a root cause.
Identify Potential Causes: The team performs a 5-Why analysis to begin exploring a possible root cause. The results of the 5-Why are shown below:
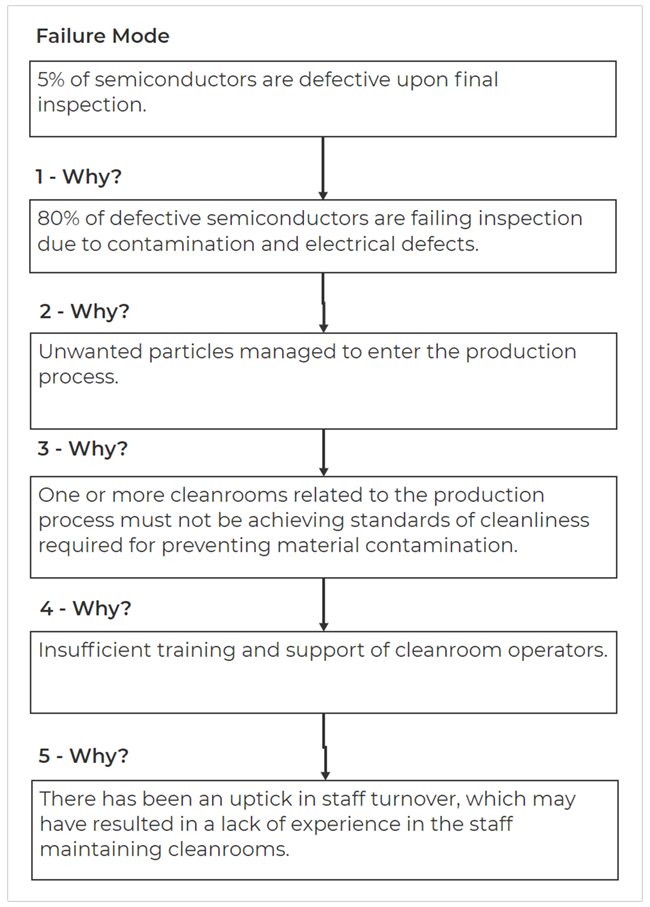
This line of reasoning seems plausible, and some team members are eager to jump straight to work on improving cleanroom procedure training. Others push back and encourage the team to be more thorough by exploring additional root cause analysis tools. They decide to construct a Fishbone Diagram:
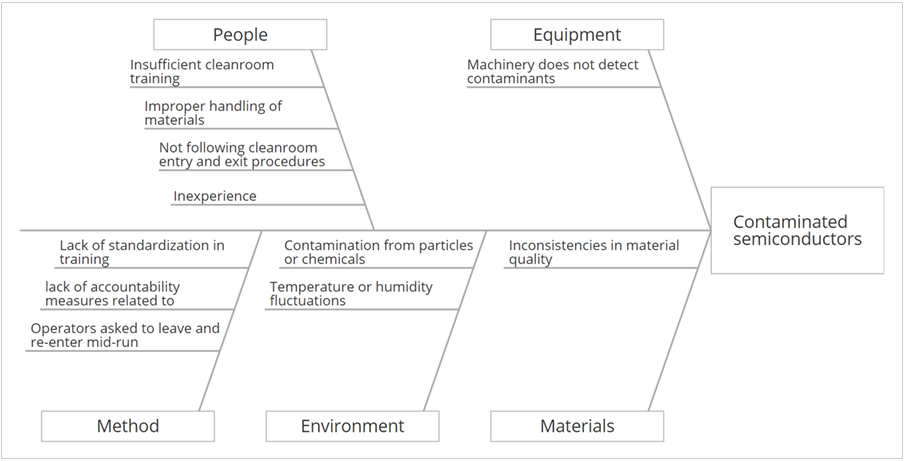
Sure enough, through constructing the Fishbone Diagram, the team realizes that operators asked to leave and re-enter cleanrooms during machine runs could easily "open the door" to contamination. This discovery leaves them with two main hypotheses for the source of contamination: (A) insufficient cleanroom procedure training and (B) excessive entrance and re-entry from the cleanrooms. To explore both possible root causes further, the team constructs a Root Cause Tree:
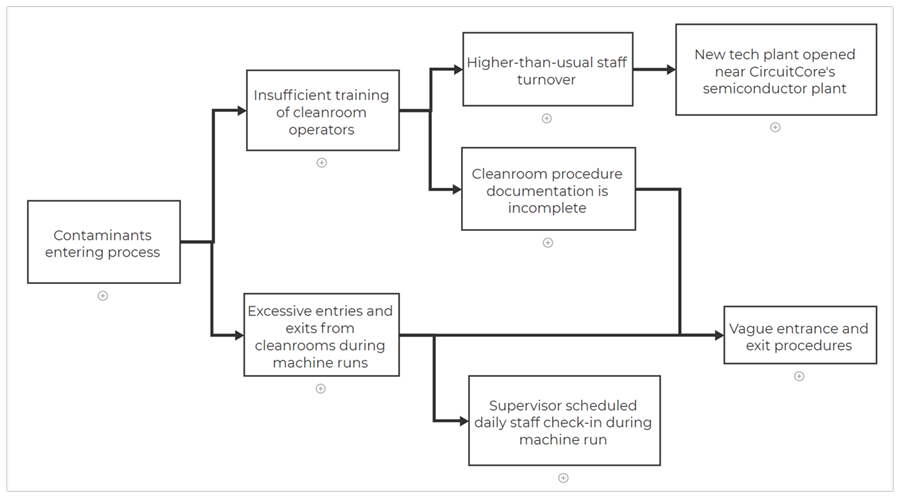
Once again, using a structured root cause analysis tool leads to new insights. The team determines that both of their hypothetical root causes may themselves result from one deeper root cause: vague entrance and exit procedures. They also find out that a scheduled staff check-in is directly resulting in extra cleanroom entrances and exits, which seems like it might be an opportunity for a quick fix.
Validate Root Cause: The team meets with the supervisor and confirms that daily check-ins had been scheduled during machine runs. The supervisor was actually unaware of the scheduling conflict and was happy to change the timing of the daily check-in in order to avoid disrupting the cleanroom operators. They then reviewed the cleanroom entrance and exit procedures with the cleanroom operators. While reviewing what little documentation existed, operators were quick to interject with questions they had often wondered about. It became clear that the entrance and exit procedures needed to be clarified, emphasized, and re-taught to the operators.
Implement Solutions: The team involved the operators in establishing clear entrance and exit procedures. They coordinated with the supervisor to plan re-trainings and to incorporate the new procedures in new-hire training. Finally, they posted the procedures and planned to check in with the cleanroom operators after one month had passed to address any pain points or ambiguities.
Monitor Results: Continued monitoring of semiconductor defects immediately showed a dramatic decrease in both "contamination" and "electrical defect". The team monitors the results by tracking the number of defective semiconductors with defect types of "contaminated" or "electrical defect".
As an additional resource, checkout the detailed tutorial below that shows how to use the Root Cause Tree Tool in EngineRoom:
Summary
Root Cause Analysis is a powerful problem-solving approach that enables organizations to identify and eliminate the underlying causes of problems, leading to more effective and sustainable solutions, improved processes, and better overall performance.
A Root Cause Analysis requires a systematic and collaborative approach involving data-driven decision-making, open communication, and a commitment to continuous improvement. It is essential to involve key stakeholders, use appropriate problem-solving tools, and document the entire process for future reference.
The biggest bang from an Affinity Diagram exercise is that it forces the team members to move beyond preconceived notions and patterns of thinking towards more intuitive and unconventional solutions.