

New Features
Recently released features and new functionality

EngineRoom provides you with automatic updates within the application, so the latest version is always available — and FREE.
Check out our recently released features and new functionality below:

February 5, 2026
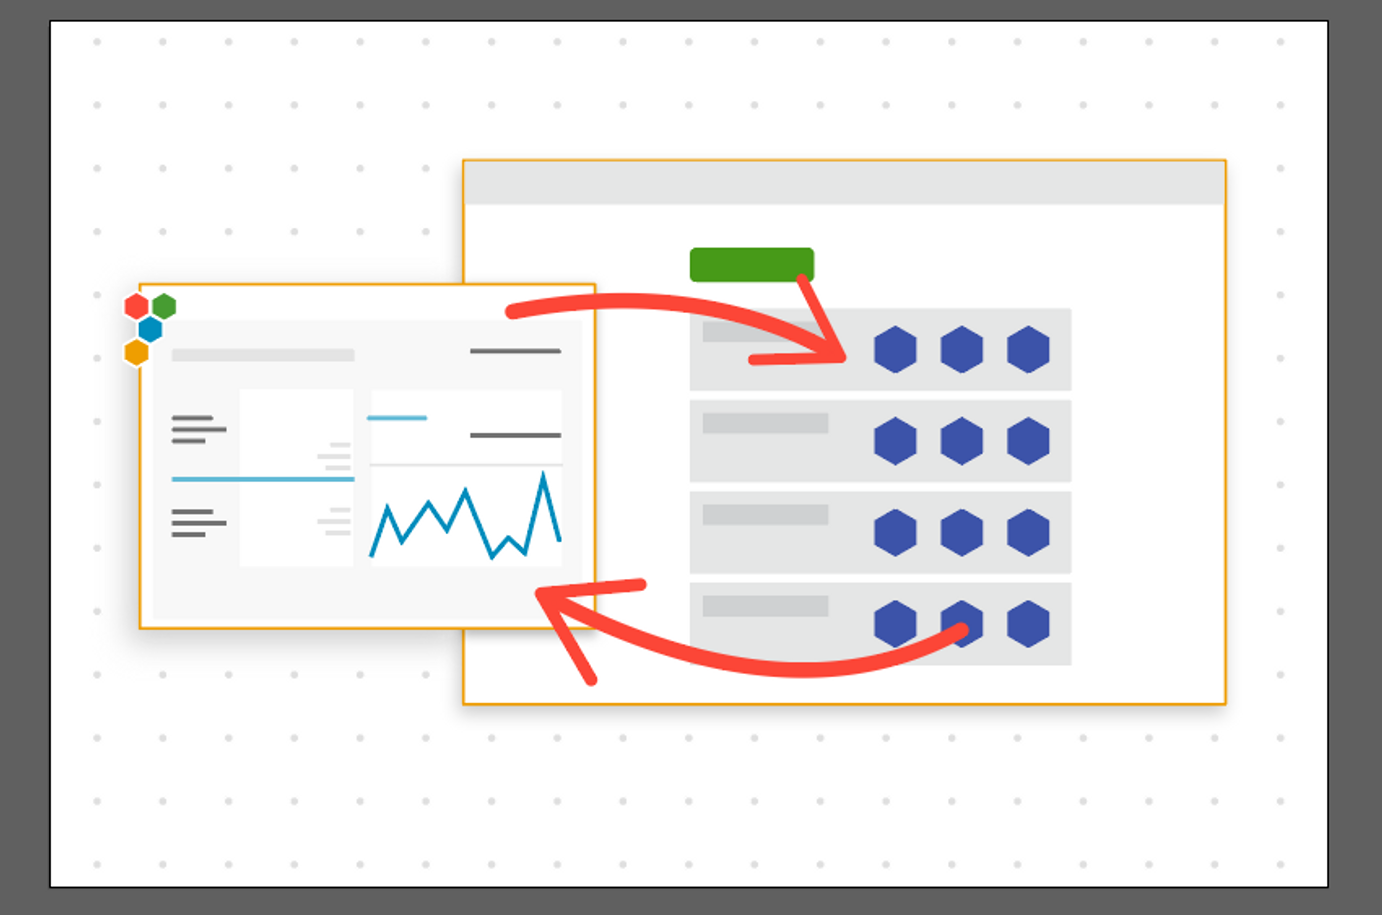
Import Data from Google Sheets into EngineRoom
Our latest upgrade allows you to connect your Google Sheets to EngineRoom and import the data!
- Connect to your Google Sheets from EngineRoom
- Import the data and use like another data source
- Update your data in Google Sheets, then refresh in EngineRoom to get the latest data
Thanks for using EngineRoom! Check out our latest updates!

February 4, 2026
Hexie Got an Upgrade!
Hexie got an upgrade! With some additional boosts on the backend, Hexie will also:
- Have greater flexibility in types of questions it answers
- Provide source links from EngineRoom Help provided in the bottom of chats
- Translation improvements
- and more!
Try Hexie out today!
December 23, 2025
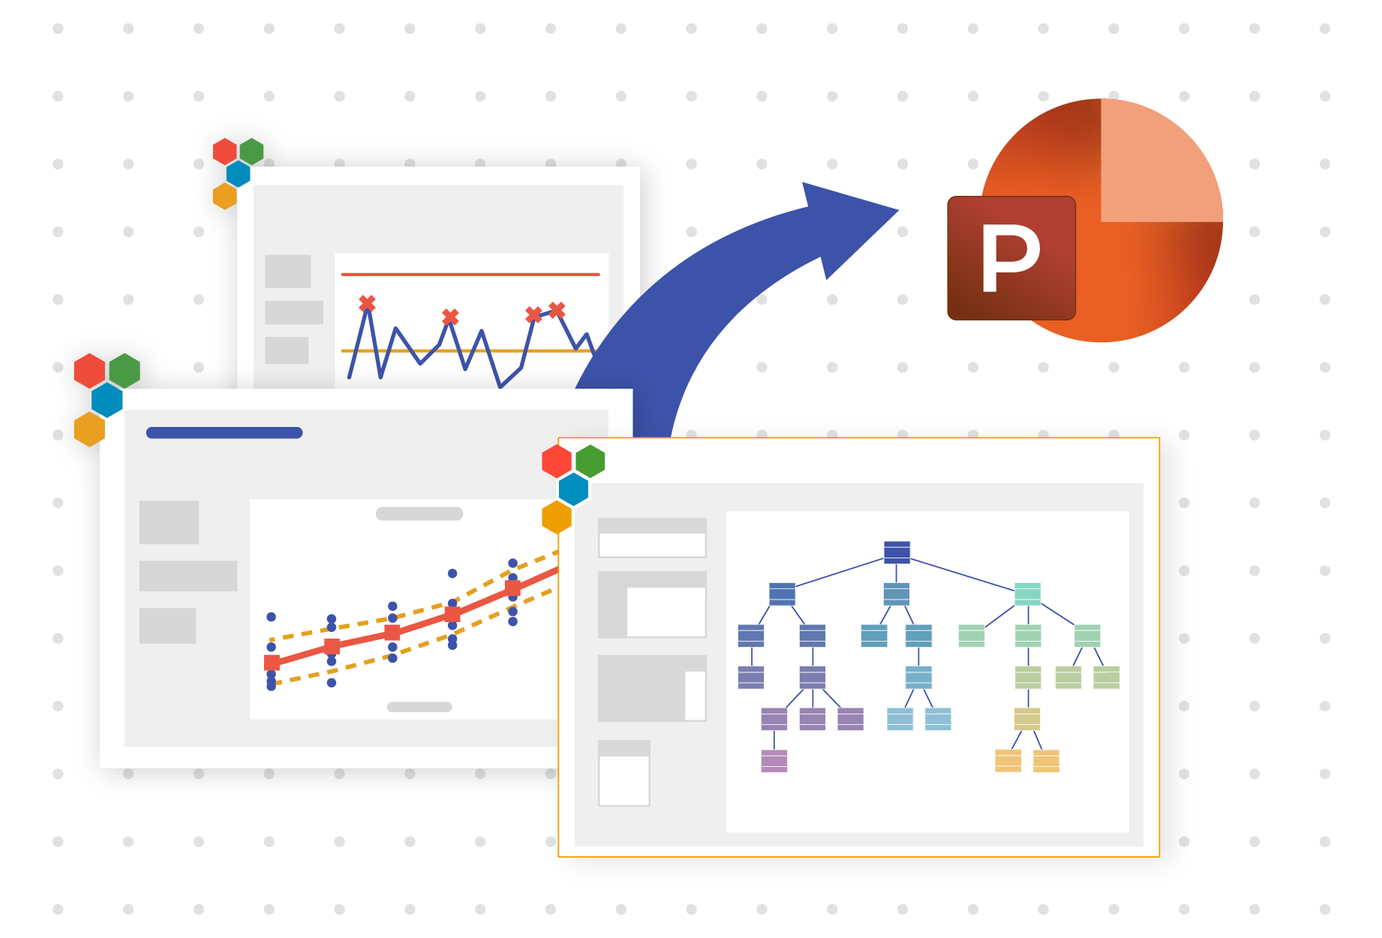
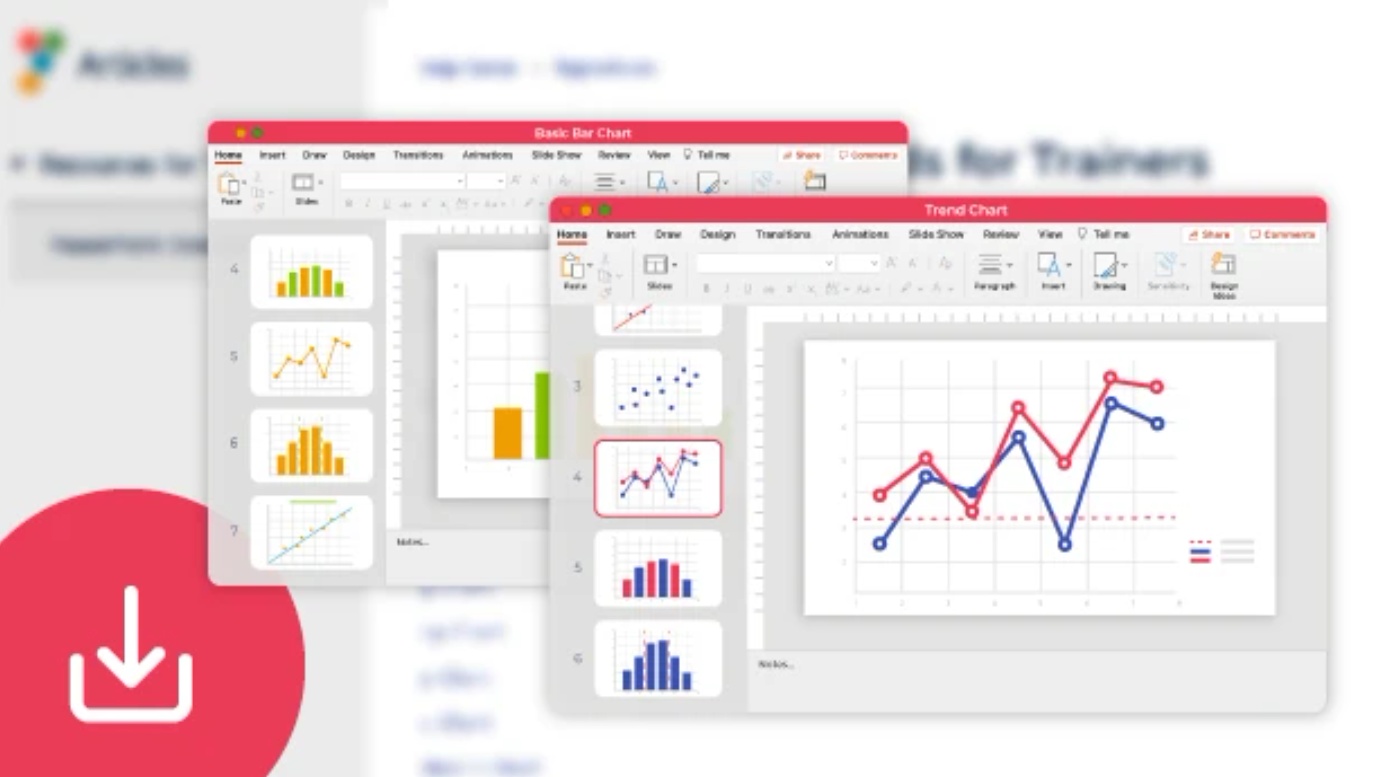
Export Entire Projects with Bulk Export
Export multiple studies from your project into one polished PowerPoint file with just a few clicks.
- Click the button in the top-right corner to begin an export
- Select and rearrange your studies to suit your narrative
- Download the final PowerPoint containing all of your tables, charts, documents, and diagrams
October 27, 2025
Technical Upgrade for Diagramming and Process Playground
A technical boost brings smoother performance and new features:
- Support for a greater number of shapes on the workspace
- Click and Drag to Move, Shift and Drag to Multi-Select
- Curved connector lines
August 25, 2025
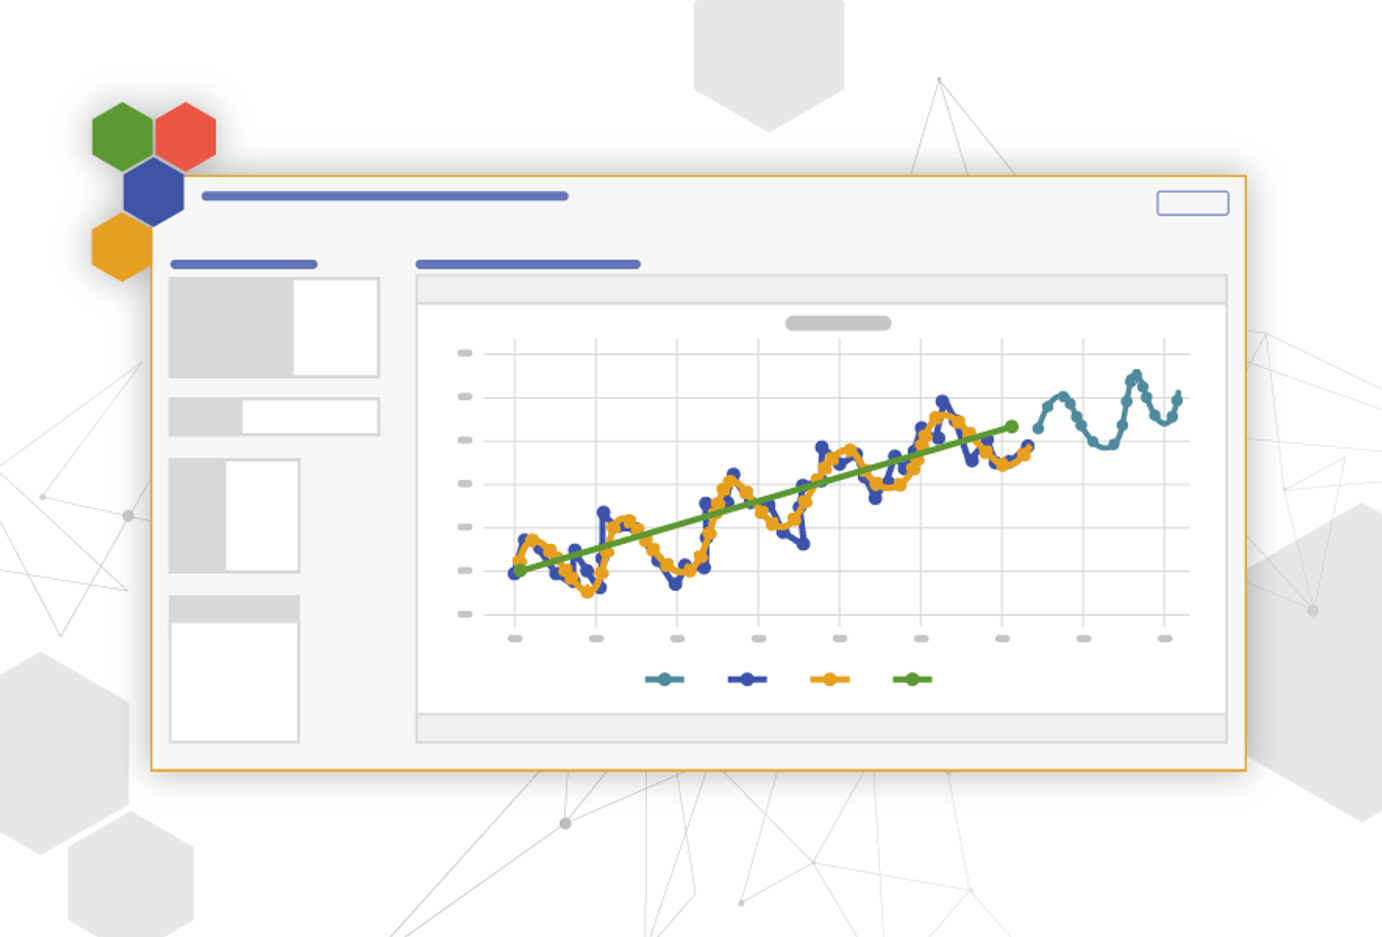
Forecasting with Seasonality and Trends
Our latest tool, Time Series Analysis - Decomposition, allows you to separate the effects of seasonality and trends within your data and predict future results.
- Helps identify the length of seasons in your data using statistics
- Tests multiple models and makes a recommendation for the best fit
- Displays a user-selected number of points to forecast into the future based on past data
June 6, 2025
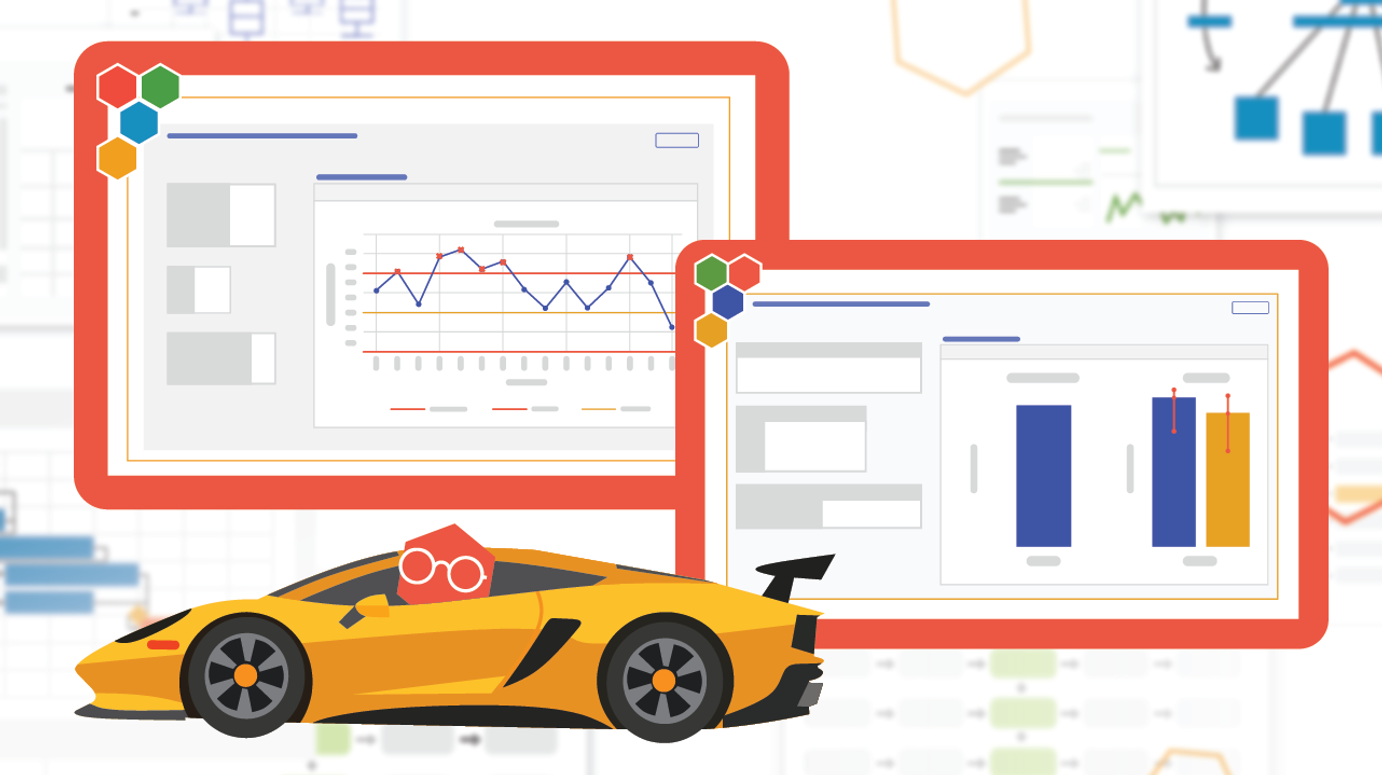
New VDA5 Tools Released to Meet Growing International Market Demand
EngineRoom added 3 tools to support the VDA5 standard for Measurement System Analysis. The VDA5 standard, which comes from the German automotive industry, places greater emphasis on evaluating measurement uncertainty.
- VDA5 Prestudy – A VDA5–compliant version of the Type 1 Gauge Study to assess system readiness.
- VDA5 Gauge R&R – A Gauge R&R tool tailored for VDA5, focusing on repeatability, reproducibility, and uncertainty.
- Bowker Test for Attributive Analysis – An advanced attribute agreement tool for comparing appraisers against each other and against a reference.
These tools support documentation related to the VDA5 standard and high-confidence decision-making in quality-critical environments.
May 20, 2025
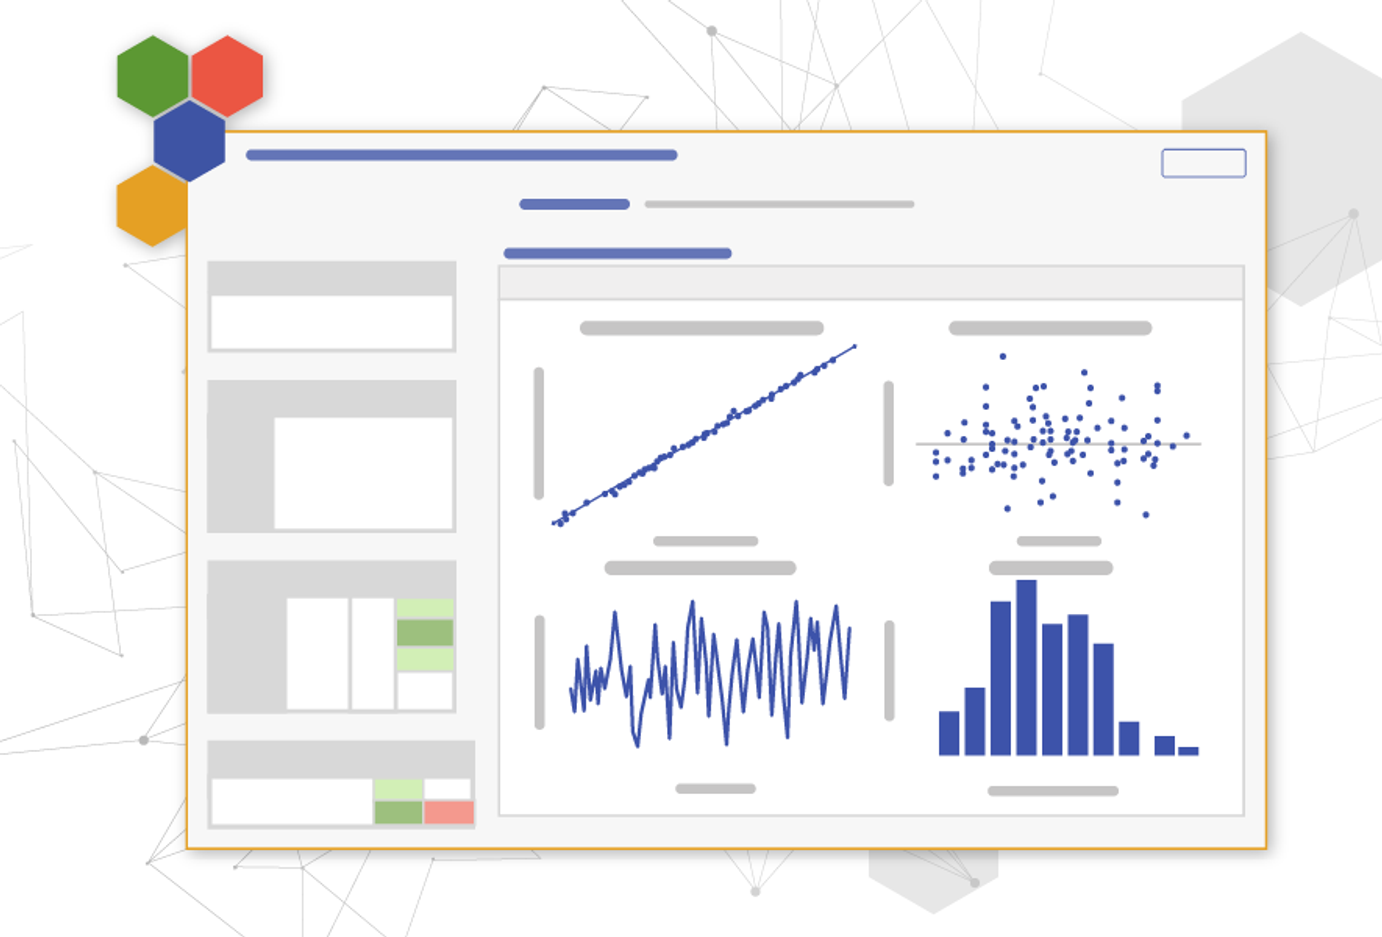
Advanced Regression added to EngineRoom
Additional features for Regression allow you to create even more advanced models for your data. The General Linear Modeling tool in EngineRoom adds the ability to:
- Include nested terms, higher order terms, and interaction terms to your models
- Reduce your model using different methods like backward elimination and forward selection
- Standardize your input values for better comparisons with your coefficients
These features enable even more power for understanding your data.
May 20, 2025
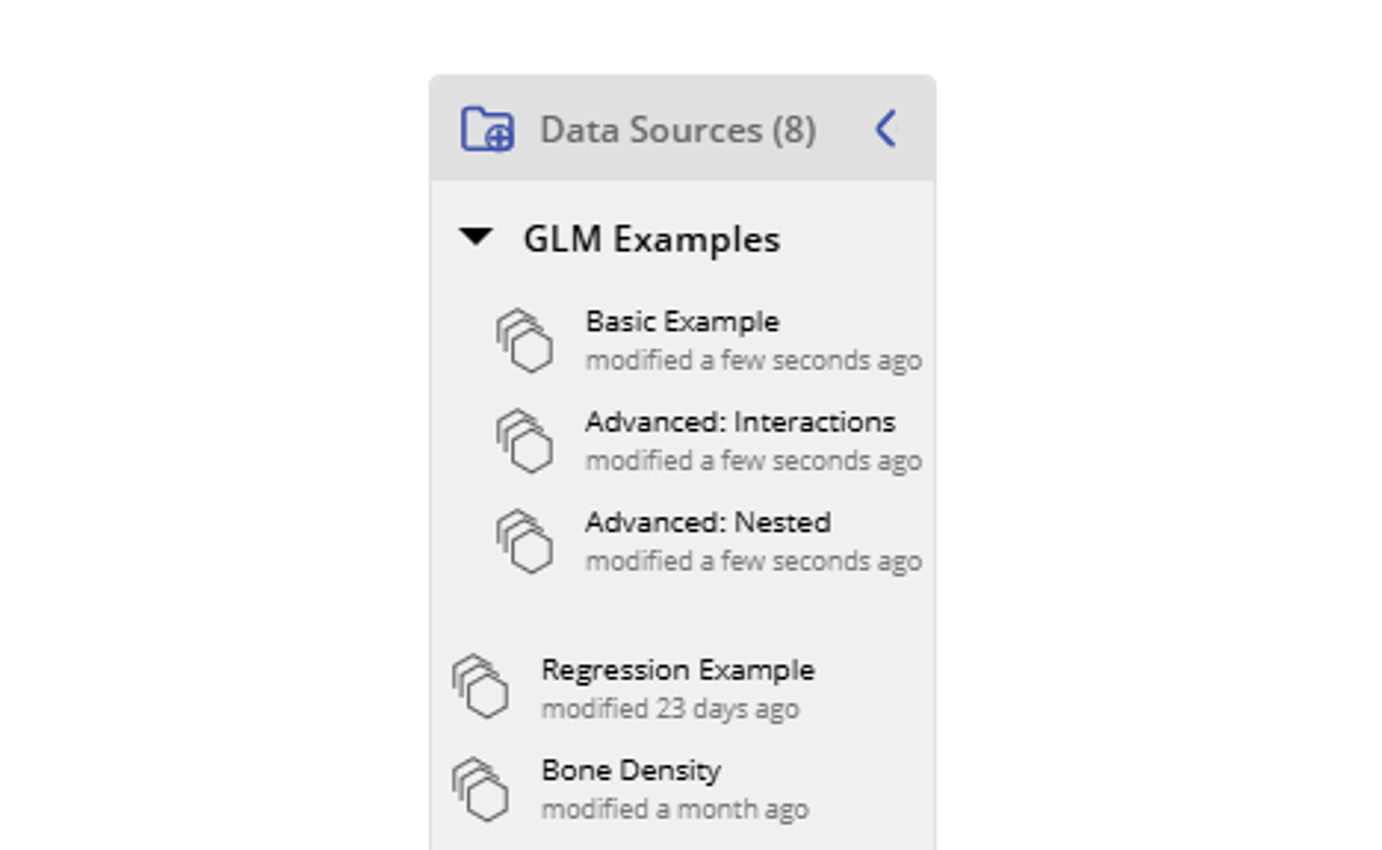
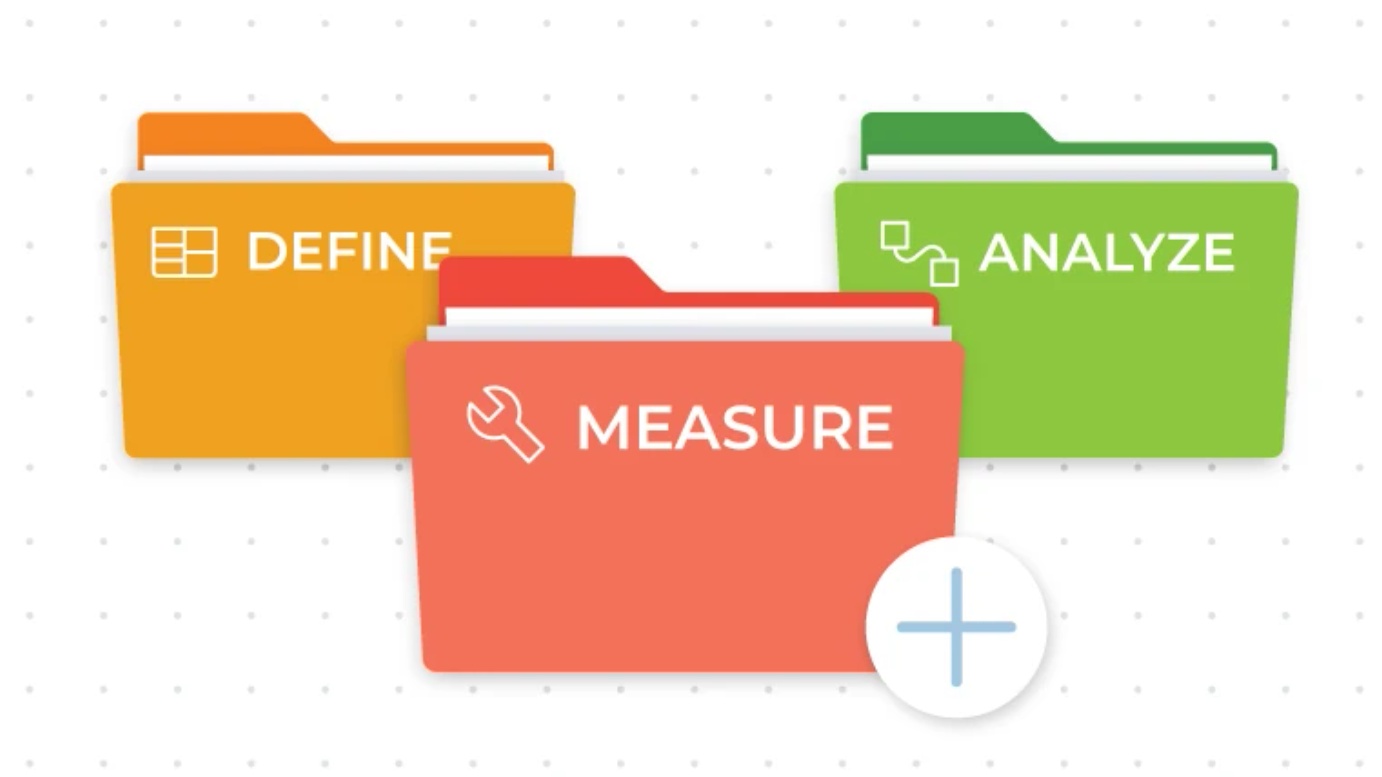
Folders Added to Data Sources Panel
The Data Sources panel just got an upgrade! In the top left corner you're able to add a folder to the data sources panel. This enables you to organize your data sources like never before!
In addition, the add folder button for studies has also been added to the top-right of the Studies Panel.
Happy organizing!
April 25, 2025
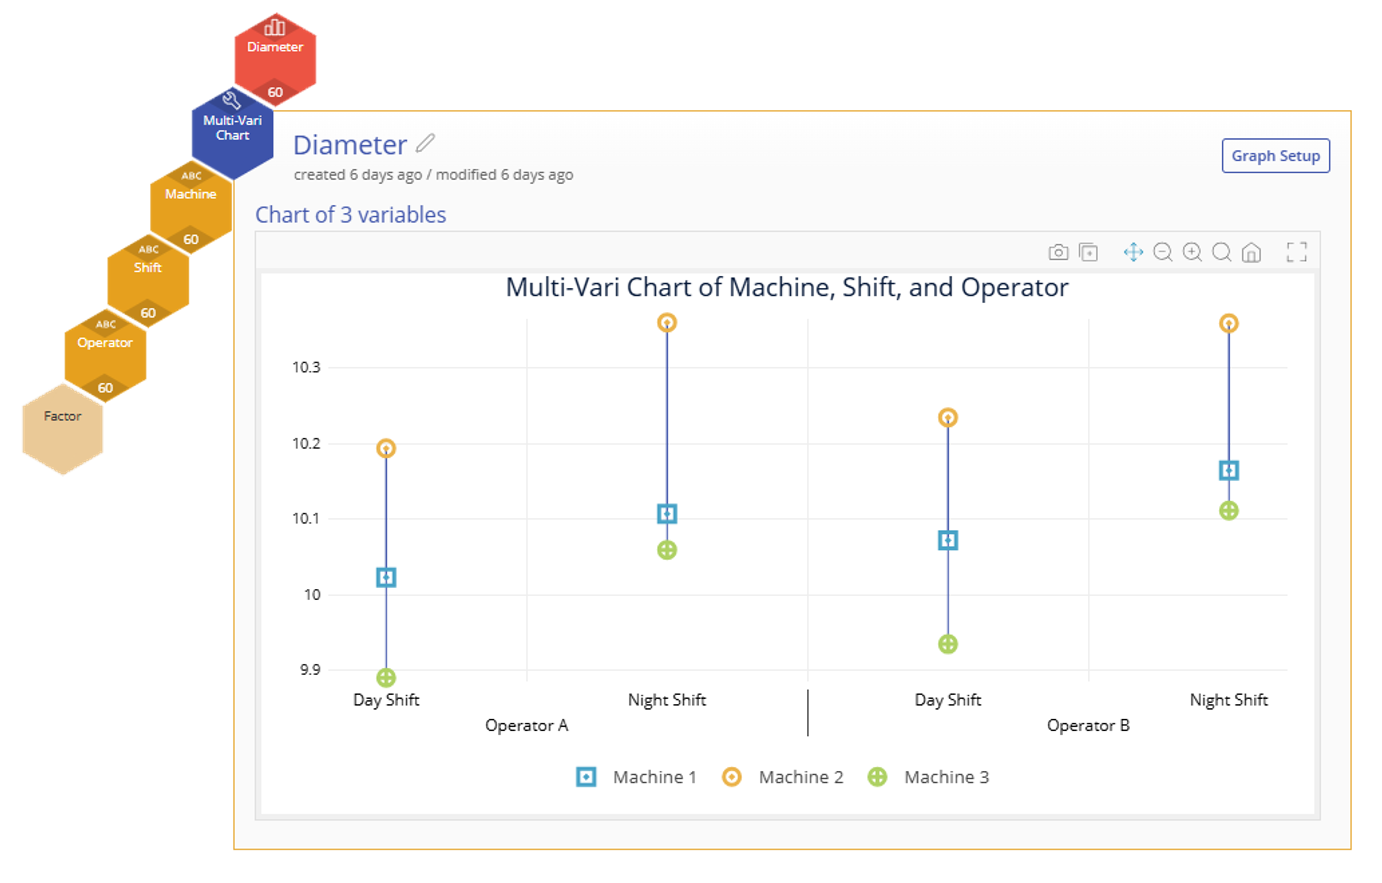
New Tool Alert! Multi-Vari Charts in EngineRoom
Multi-Vari Charts bring a simpler way to analyze the effect of categorical factors on an output. Visualize the variation between different levels of your inputs and understand which one gives you the best result.
- Choose 2-4 factors to include on your visual.
- Toggle on the Mean (or Mean of Means) across multiple factors.
Try it out today!
April 14, 2025
Go Deeper in Your Analysis with Additional Grouping Levels
You've asked and we answered! Additional levels of grouping are now available within basic tools to extract even more information from your data.
This update improves:
- Box Plots
- Bar Charts
- Pareto Charts
- Process Capability (compares two groups)
Check it out today!
February 6, 2025
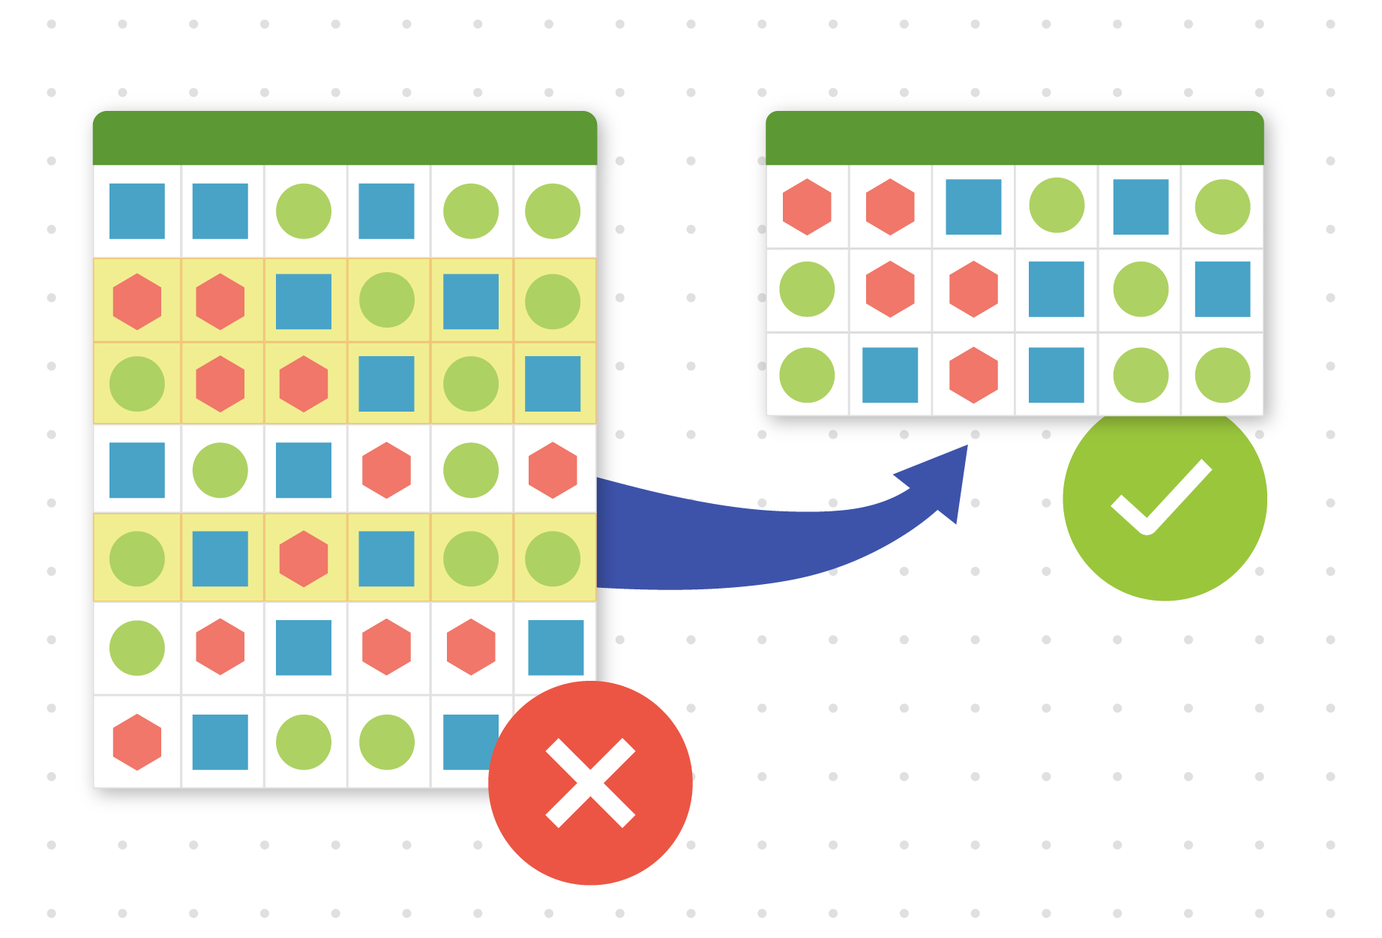
Have a Large Dataset? Let EngineRoom Take Care of It with Sampling!
We've made working with large datasets possible by introducing automatic random sampling!
- When your dataset is too large, we'll ask if we can randomly sample a subset of your data.
- The sample will maintain statistical integrity, ensuring accurate results.
- You can now work with large datasets that were previously rejected, making it possible to analyze them without blockers.
You can now explore and analyze large datasets like never before in EngineRoom!
January 20, 2025
New Tools, New Languages
EngineRoom has added two new Hypothesis Tests!
- Chi-Square Goodness of Fit Test: Understand whether your observed counts of categories fit an expected distribution of categories.
- 1 Sample Poisson Rate Test: Compare the observed rate to a theoretical rate when your data fits a Poisson distribution.
In addition, we have expanded EngineRoom's language offerings to include Italian and Polish.
October 25, 2024
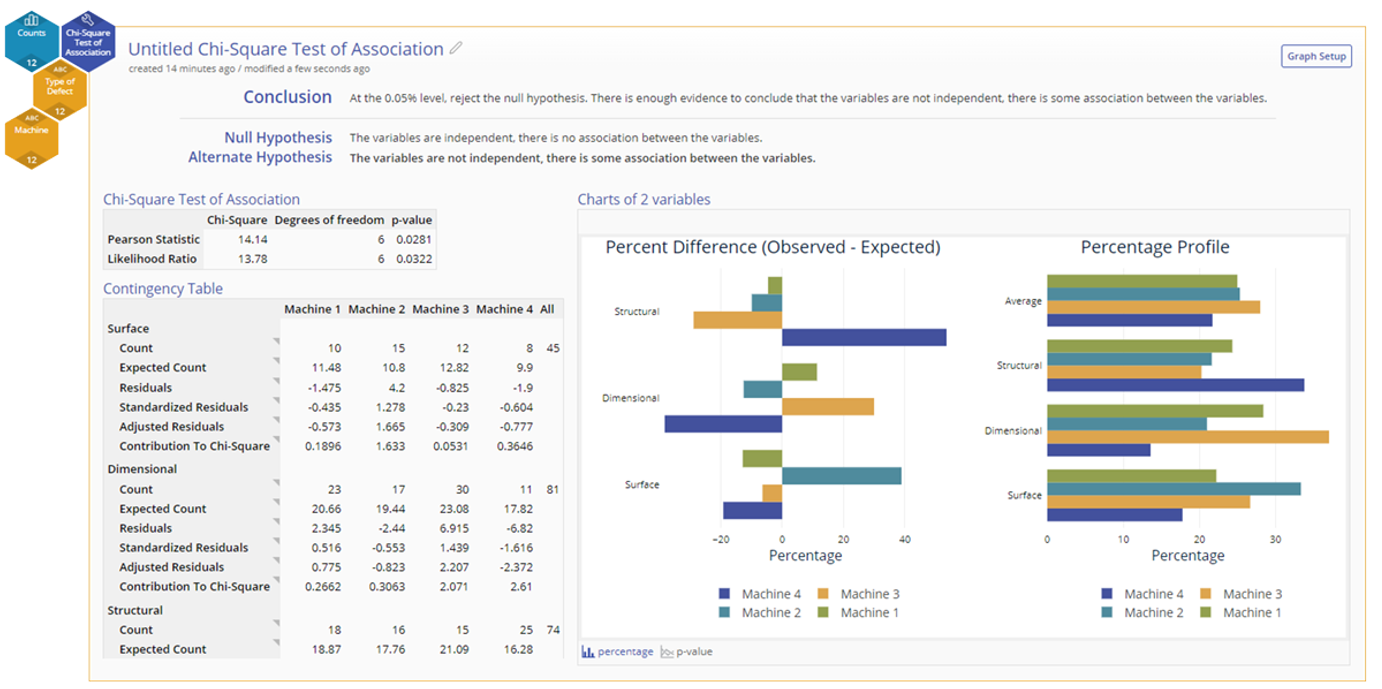
Chi-Square Test of Association for Testing Independence
The Chi-Square Test of Association, also called Contingency Table, allows you to test the independence of two categorical variables based on the expected counts of those categories in your dataset.
This new Hypothesis Test offers new insights when you have counts of data rather than just measurements. Check it out today!
October 24, 2024
New Measurement System Analysis Tools
EngineRoom continues to expand the number of problems it can help solve. With the addition of two new Measurement System Analysis tools, you can better analyze the accuracy and precision of your measurement devices.
- Type 1 Gauge Study: Check a measurement device for bias by measuring a reference part with a known measurement value
- Linearity and Bias Study: Check a measurement device for bias across its measurement range by measuring several parts and understanding the bias for each level.
With these two tools you'll be better able to understand your measurement devices, check their accuracy, and interchange gauges when necessary.
July 31, 2024
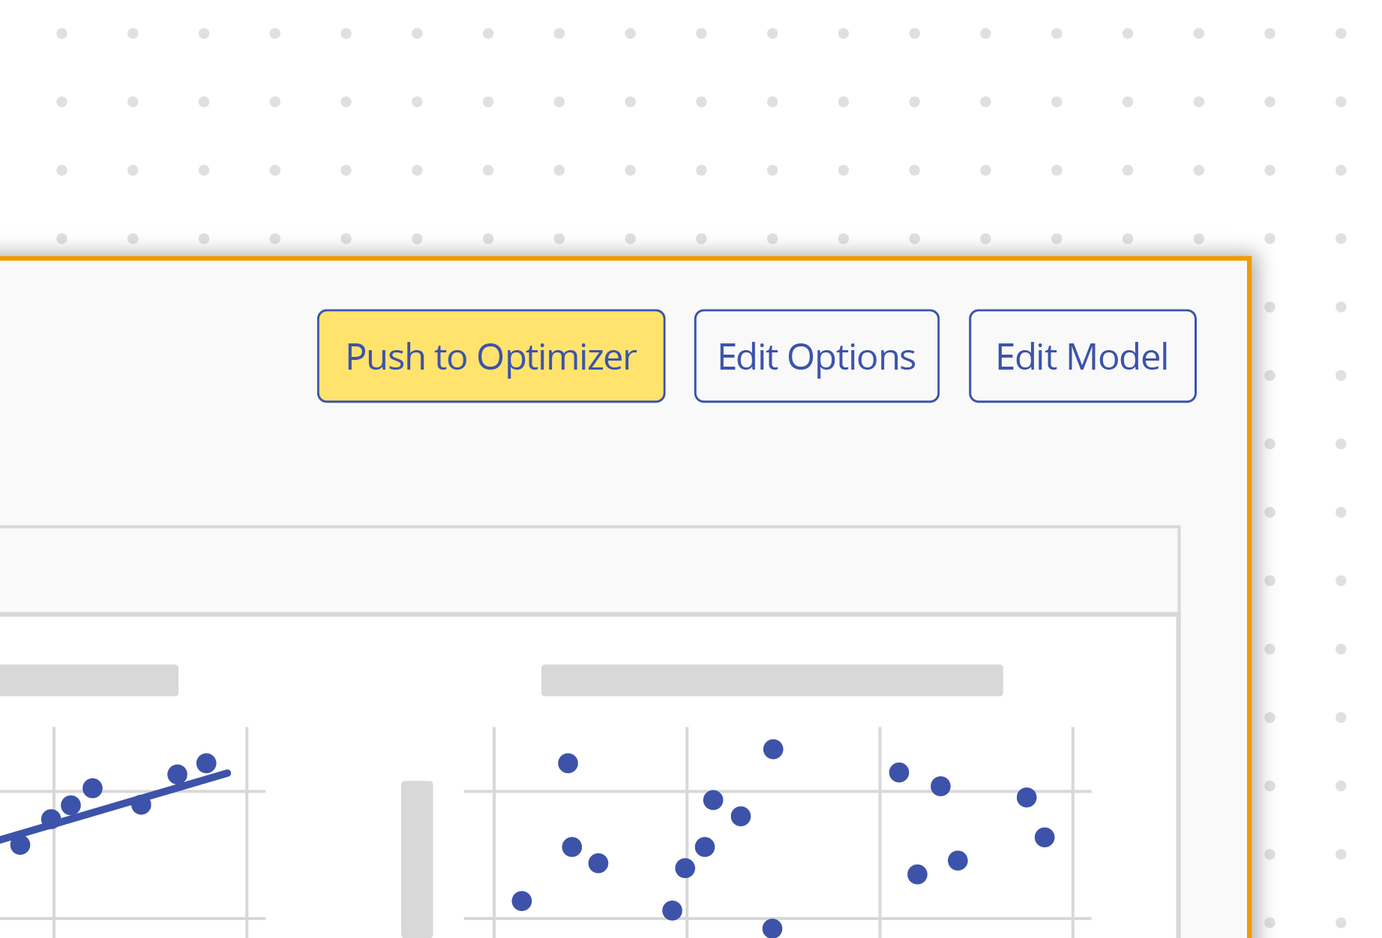
DOE Support Added to Response Optimizer
We're excited to announce a major upgrade to the Response Optimizer! Our latest update now includes robust support for optimizing models generated from the Design of Experiments (DOE) tool. This enhancement allows you to maximize, minimize, or hit target values that include interaction terms that may be present in your DOE results.
- Response Optimizer now works with Simple Regression, Multiple Regression, and DOE models.
- Determine the optimal input values to achieve Maximum, Minimum, or Target outcomes.
- Easily set specific input values to calculate the desired output result.
We're committed to enhancing your experience and ensuring you get the most from your analysis.
July 16, 2024
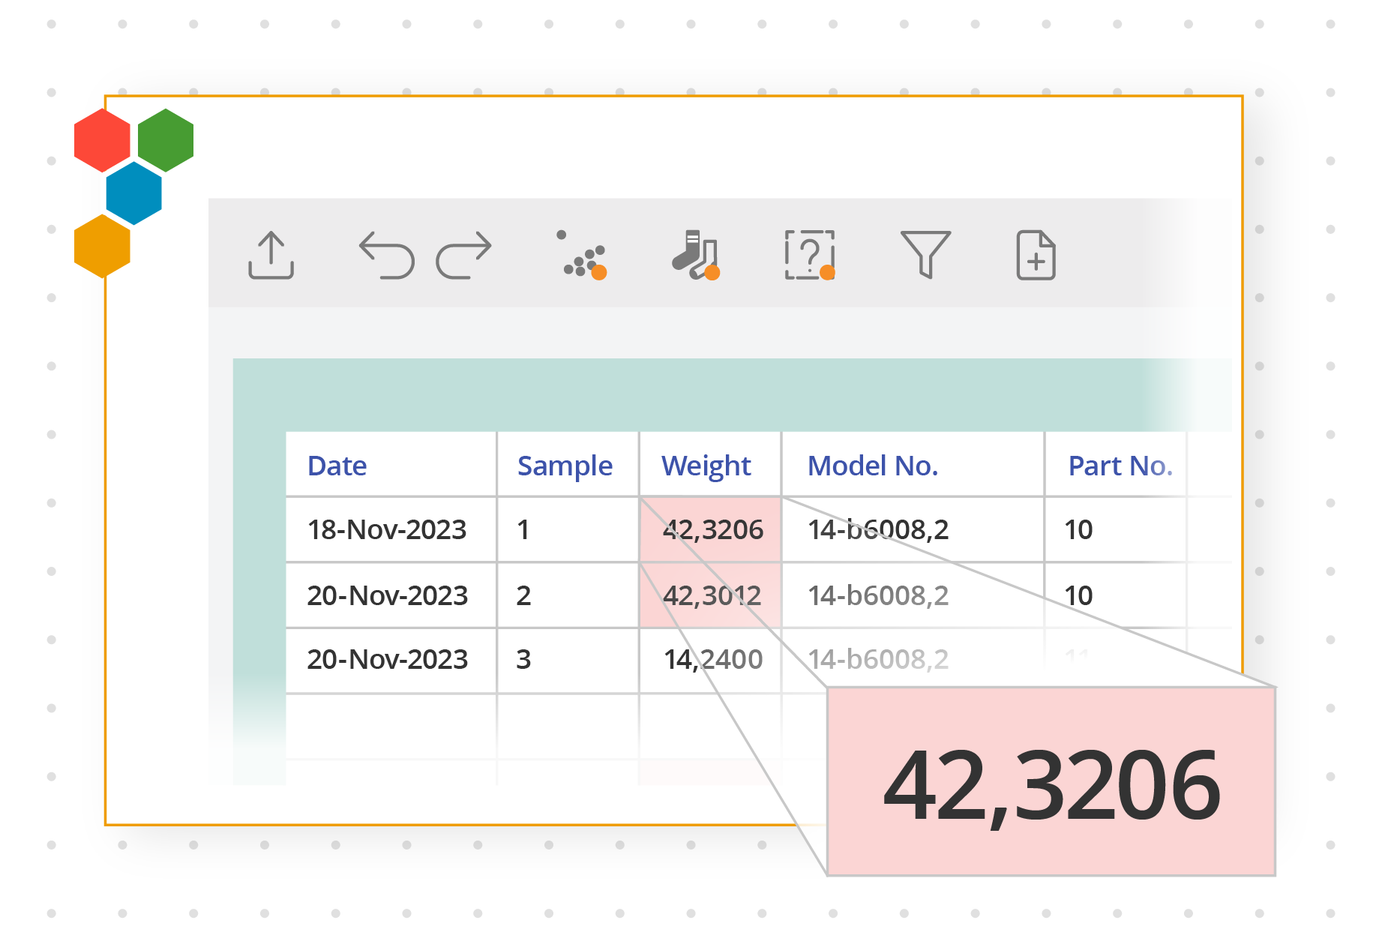
Expanding Globally with Comma-Separated Decimals
Introducing a powerful update in the latest EngineRoom release: now, seamlessly calculate data using comma-separated decimals—a format widely used across many countries.
Simply adjust your decimal separator in the User menu at the top-right of your screen. This change will impact both your data sources and the results in your studies.
June 18, 2024
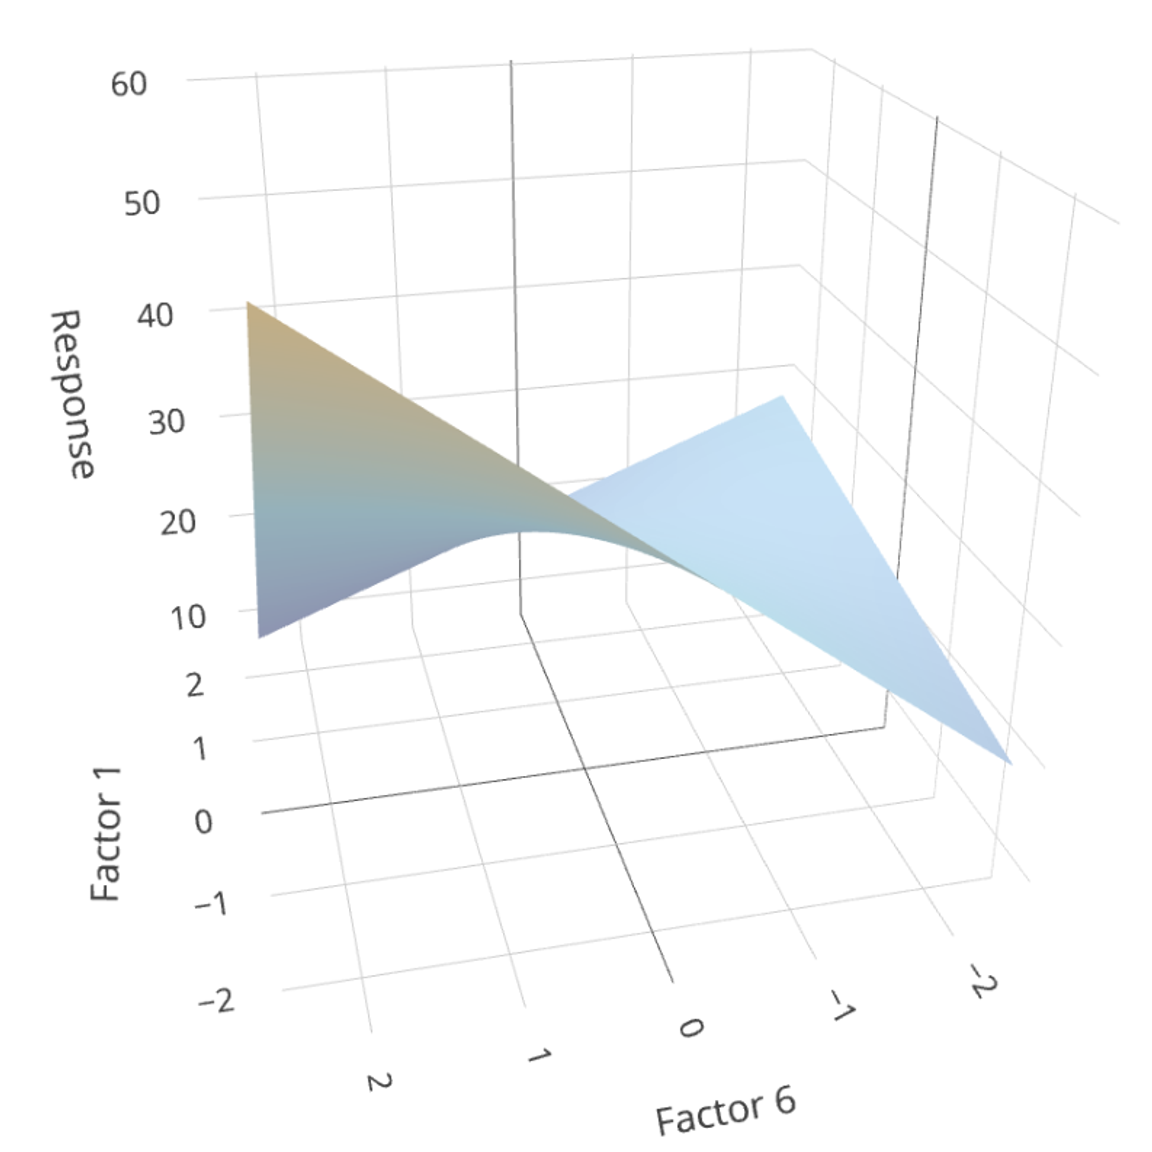
Calculate Curvature in DOE
We have added Response Surface Methodology to our DOE tool, allowing you to model non-linear effects on a continuous response. This new design expands the types of experiments you can run using EngineRoom!
You now have:
- Central Composite Designs available in EngineRoom
- Non-linear main effects graphed the Main Effects plots
- Contour and Surface Plots for visualizing interactions of non-linear effects on the response
In addition, find these updated DOE features:
- Cube Plot layout: Updated for clarity when there are more than 3 factors
- New Statistics: Added PRESS and Predicted R Squared to the output
Expand your capabilities by using EngineRoom's new upgrades to DOE!

May 16, 2024
Introducing Hexie, Our Stats and Process Improvement Wingbot!
Hexie is here to answer questions like:
- What tool would be useful for my situation?
- Can you explain this process improvement concept?
- What does this statistic represent?
- And more!
Hexie is a Large Language Model and was released in Beta mode. Find Hexie in the lower-right corner of your EngineRoom screen.
January 25, 2024
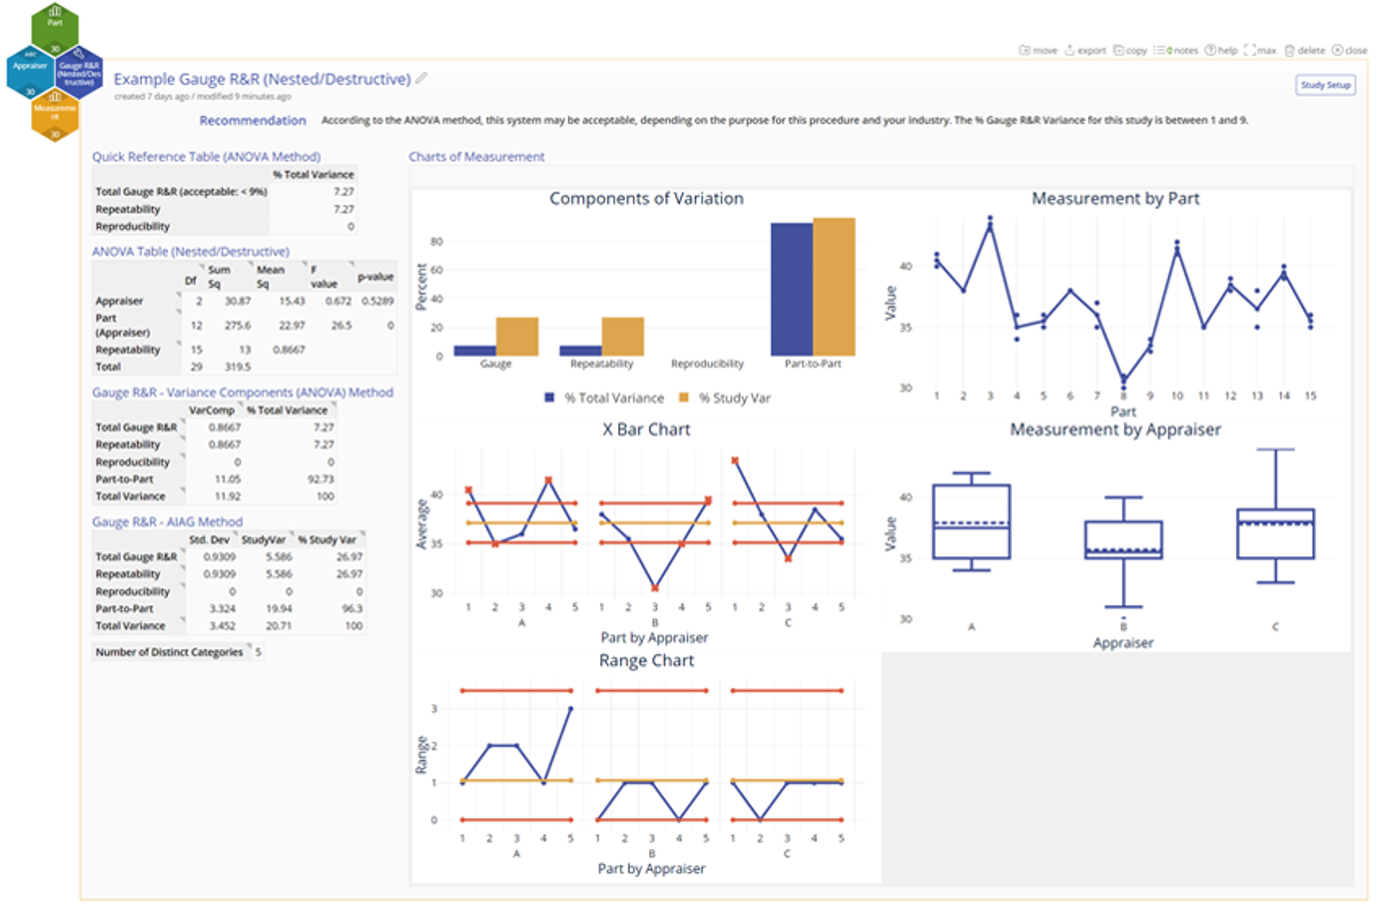
Gauge R&R for Nested/Destructive Cases
EngineRoom's latest tool helps analyze your Measurement System when the parts are destroyed or modified during measurement, such as car crash tests or opening a bag of chips.
- Differentiates measurement variation due to operators, parts, and gauge.
- Correctly accounts for the nesting of the parts within operators (that is, parts aren't repeated between operators as in the regular/crossed case).
Try it out in EngineRoom!
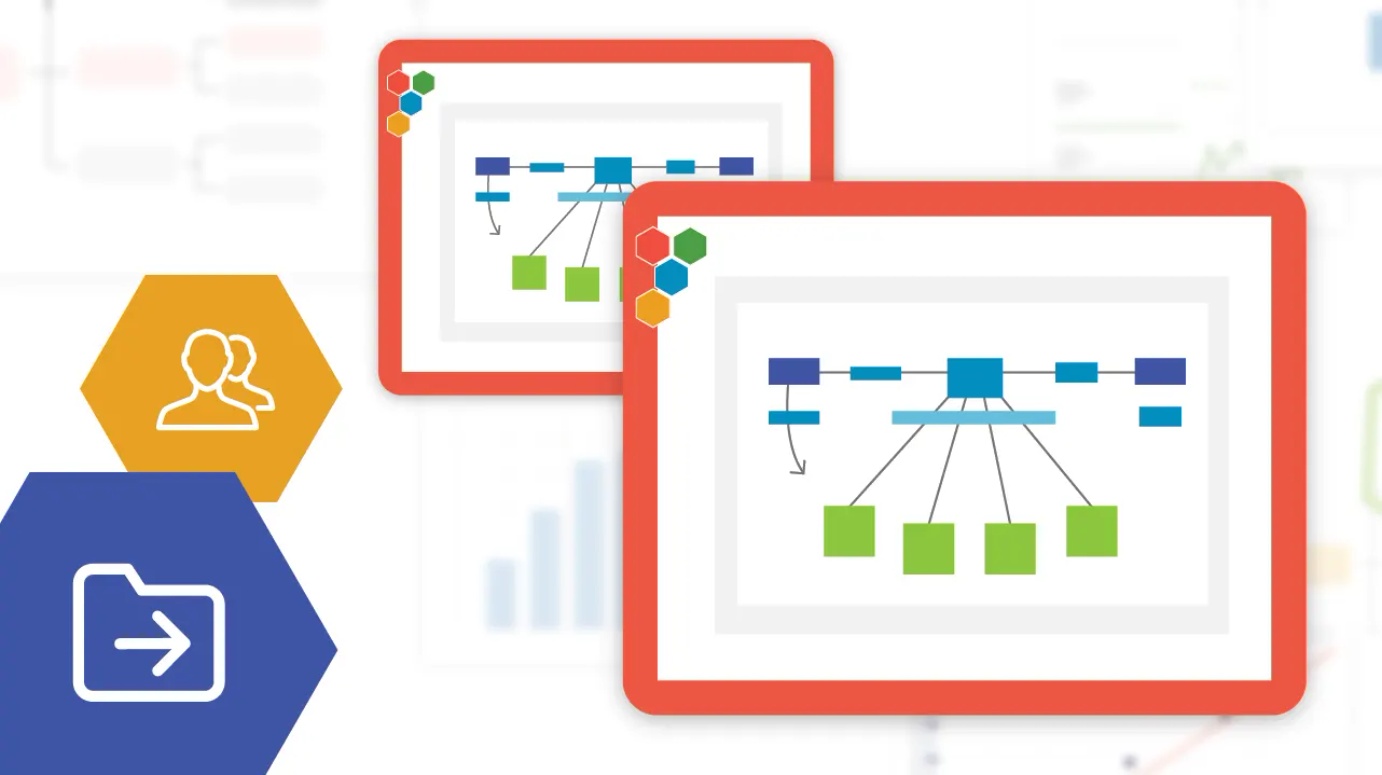
January 24, 2024
Moving Stats Studies to Consolidate Projects
EngineRoom released a new feature to help consolidate projects and keep work together! Previously this was only available on Documentation Templates, Diagrams, and Process Playground Models, but now moving studies between projects also applies to Statistical Analysis tools.
- At the top of every Statistical Analysis study there is the ability to move the study to another project.
- When the study is moved, the associated data is copied over with it.
- This is especially powerful with the copy feature to copy and retain information in multiple projects!
We continue to listen to your feedback in building features that make it easier for you to use EngineRoom. Let us know what you think!
November 16, 2023
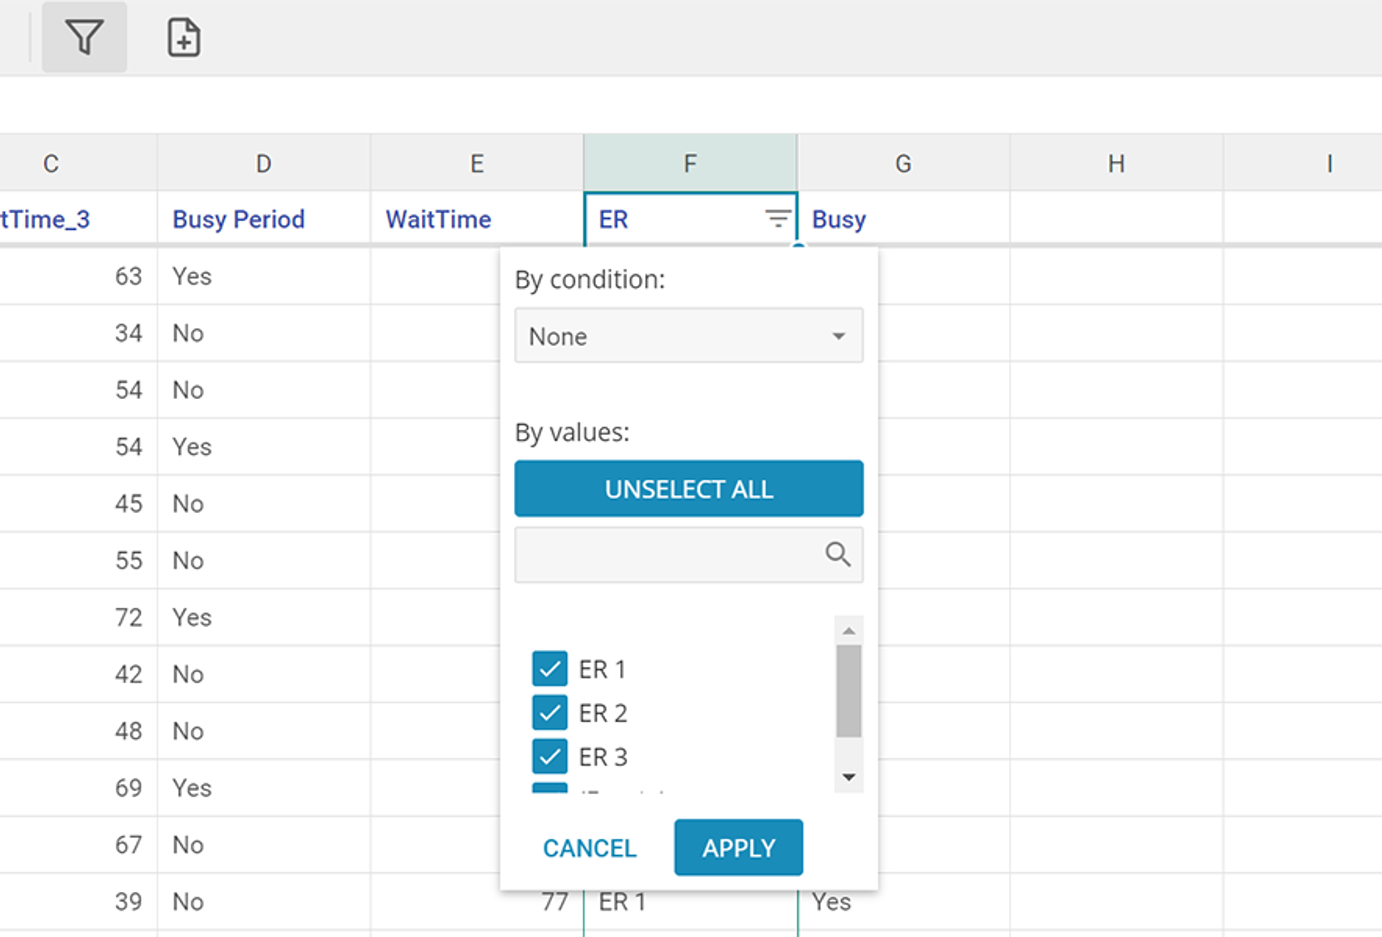
Divide and Conquer: Visualizing Groups of Data
Have you ever wanted to dive deeper into a specific group of data? With the new data editor Filter feature, you can effortlessly narrow down your data source to focus on specific information that matters most to you. Then create a new data source using just the filtered records, allowing you to isolate and work on exactly what you need, without altering your original data.
- Filter and create a copy of filtered data available in the toolbar
- Filter by multiple criteria to set up your data source how you'd like it
- Create a copy to separate your data for use in EngineRoom studies
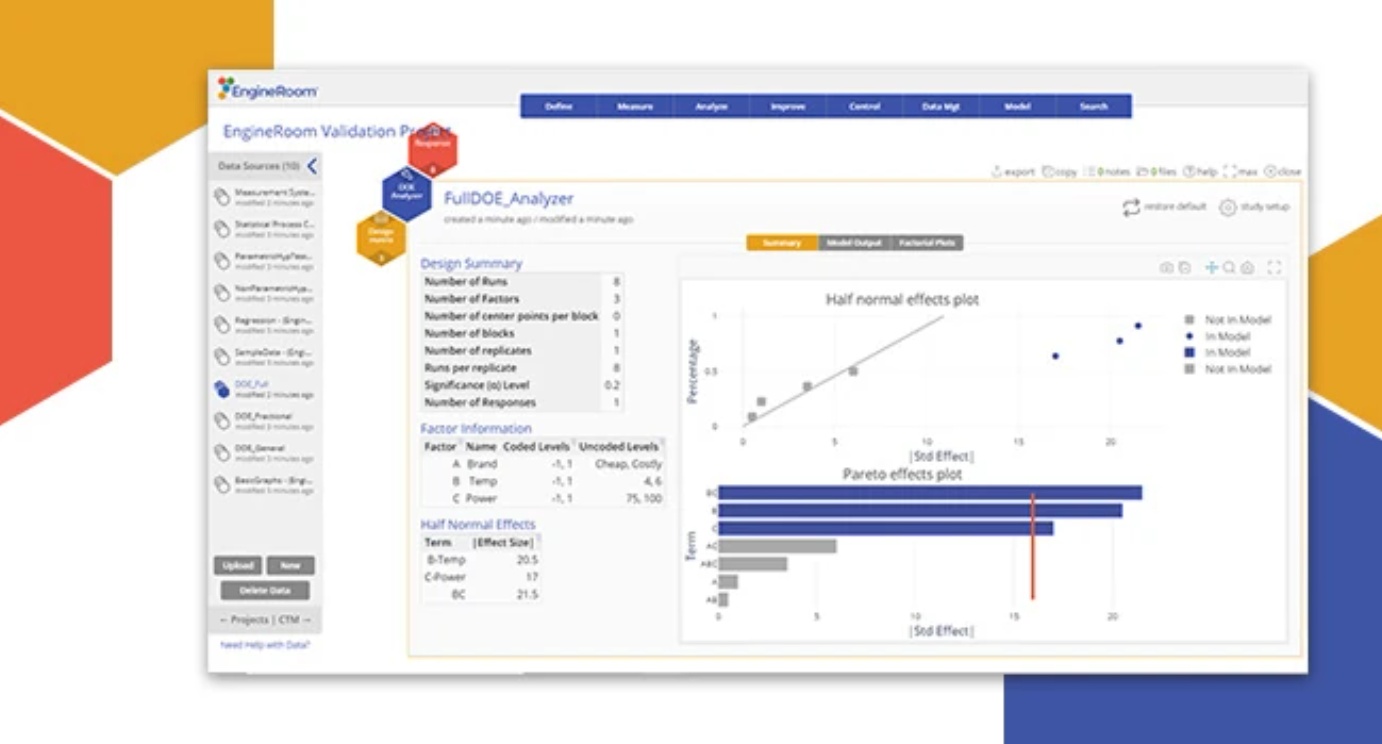
October 3, 2023
DOE (Design of Experiments) got an update!
Simplify the transition from design creation to implementation to analysis with:
- A single tool to reduce friction between creating and analyzing a design
- A simplified design experience to reduce steps and keep the information you care about front-and-center
- A conclusion statement to help you understand your output
- A reorganized results screen that presents your model first and still allows for easy exploration
More updates coming - including pushing to Response Optimizer! In the meantime, please continue to give us feedback. Note: The Design wizard and DOE Analyzer tools are available as legacy tools. They will be retired on December 31, 2023.
September 8, 2023
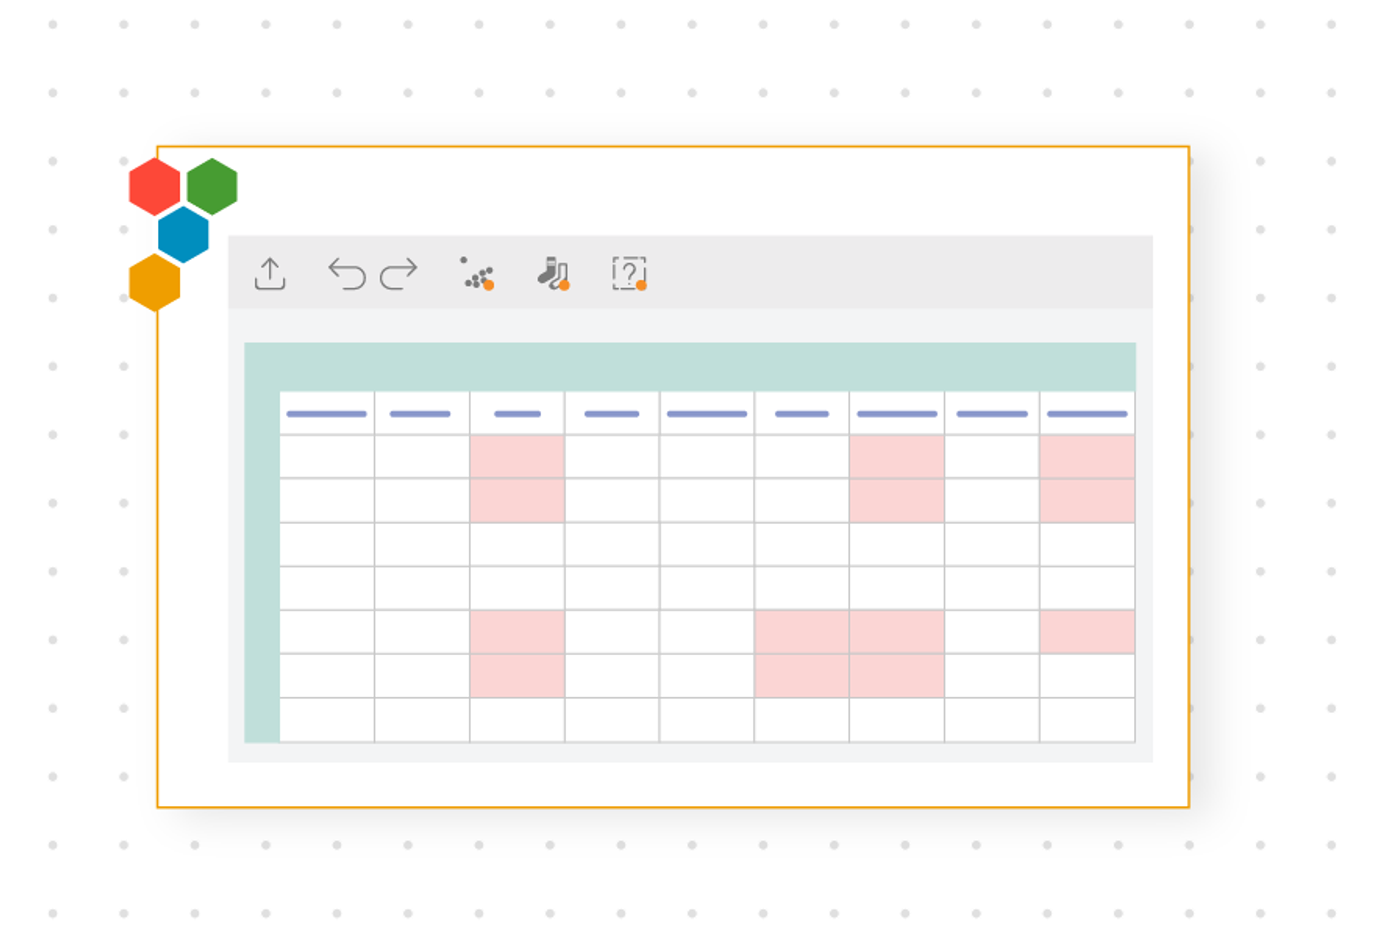
Unveiling our Brand New Data Editor
Our new and improved Data Editor brings new functionality:
- Autosaving updates to your data source
- Consolidating the data cleaning tools in one place and at-a-glance alerts if something is detected
- Copying data down a column
- Basic function support
We hope that by improving the Data Editor, you'll have a smoother experience when editing your data in EngineRoom!
June 2, 2023
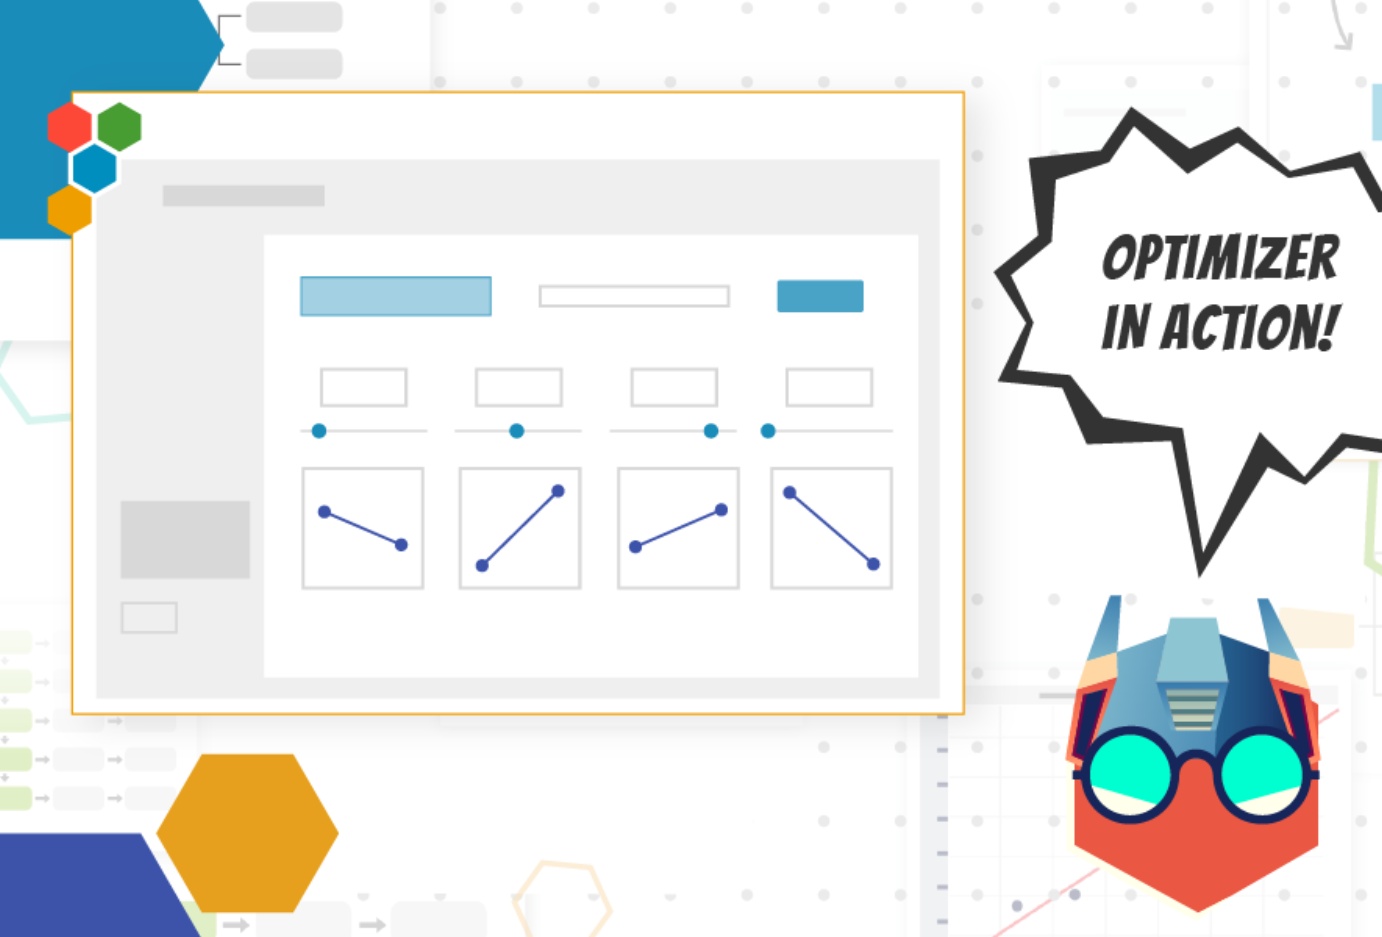
Have you tried our Response Optimizer?
- Calculate the output of a regression equation by setting the values of the inputs.
- Find the input values that achieve the optimal result (choose from Maximum, Minimum, or set your own Target value).
- To add an equation, build out it out in the tool or push from a Simple or Multiple Regression.
- JUST ADDED: Now add multiple output values and optimize them simultaneously.
Log in to EngineRoom and try it out today!
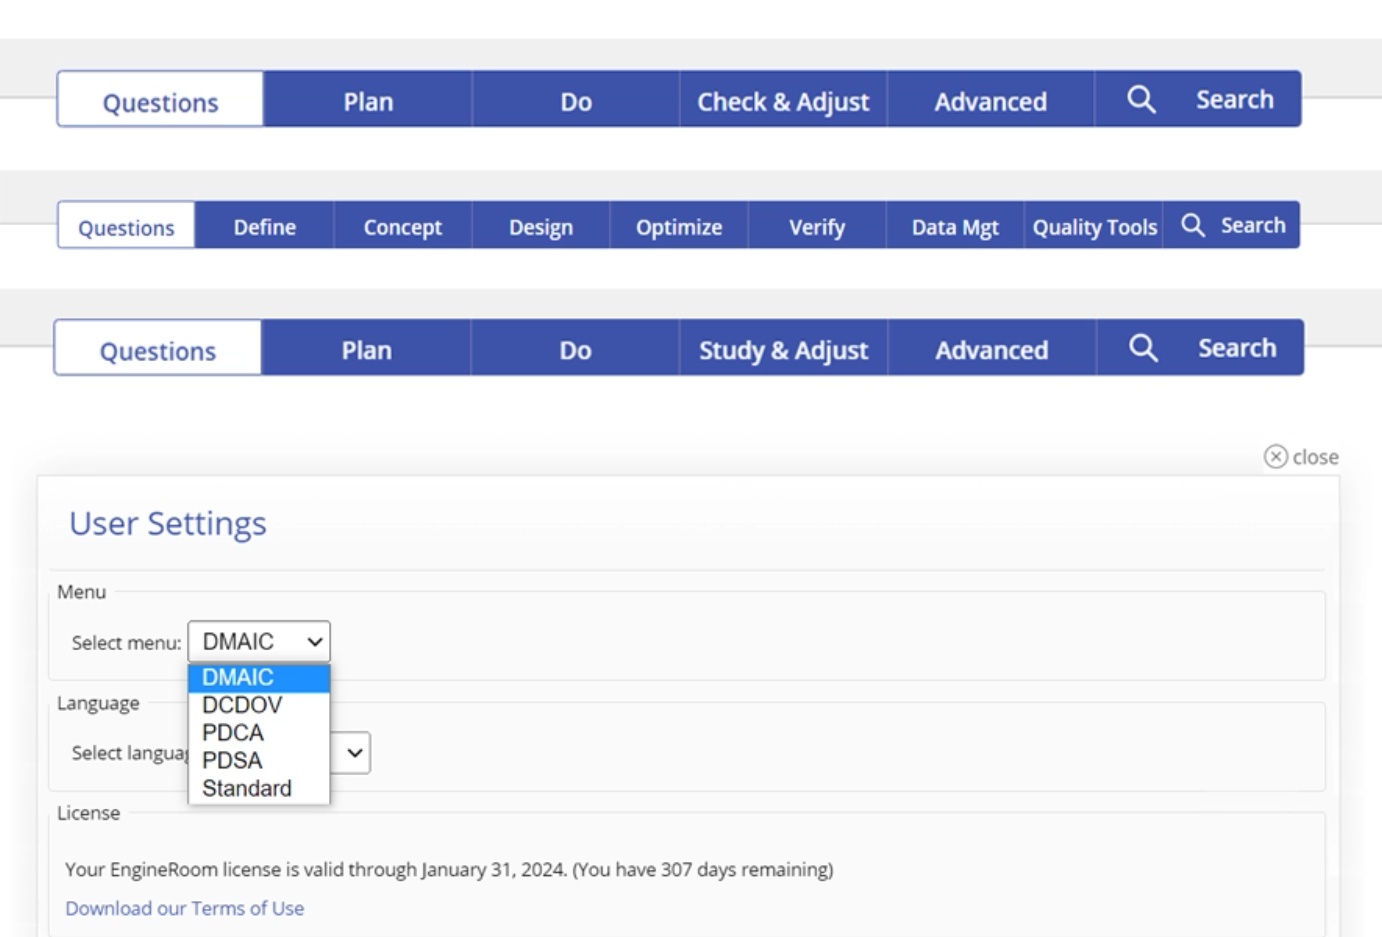
March 31, 2023
New Roadmaps in EngineRoom!
There isn't a single way to solve problems in continuous improvement; that's why EngineRoom is getting new roadmaps for your projects! We're excited to roll out this new feature that allows you to use the roadmap that best identifies and corrects your problem. The new roadmaps are:
- DCDOV (Define, Concept, Design, Optimize, Verify)
- PDCA (Plan, Do, Check, Act/Adjust)
- PDSA (Plan, Do, Study, Act/Adjust)
These additional options allow you to customize EngineRoom for your organization. Log in to your account today to see how you can now match EngineRoom to your organization's roadmap.
February 24, 2023
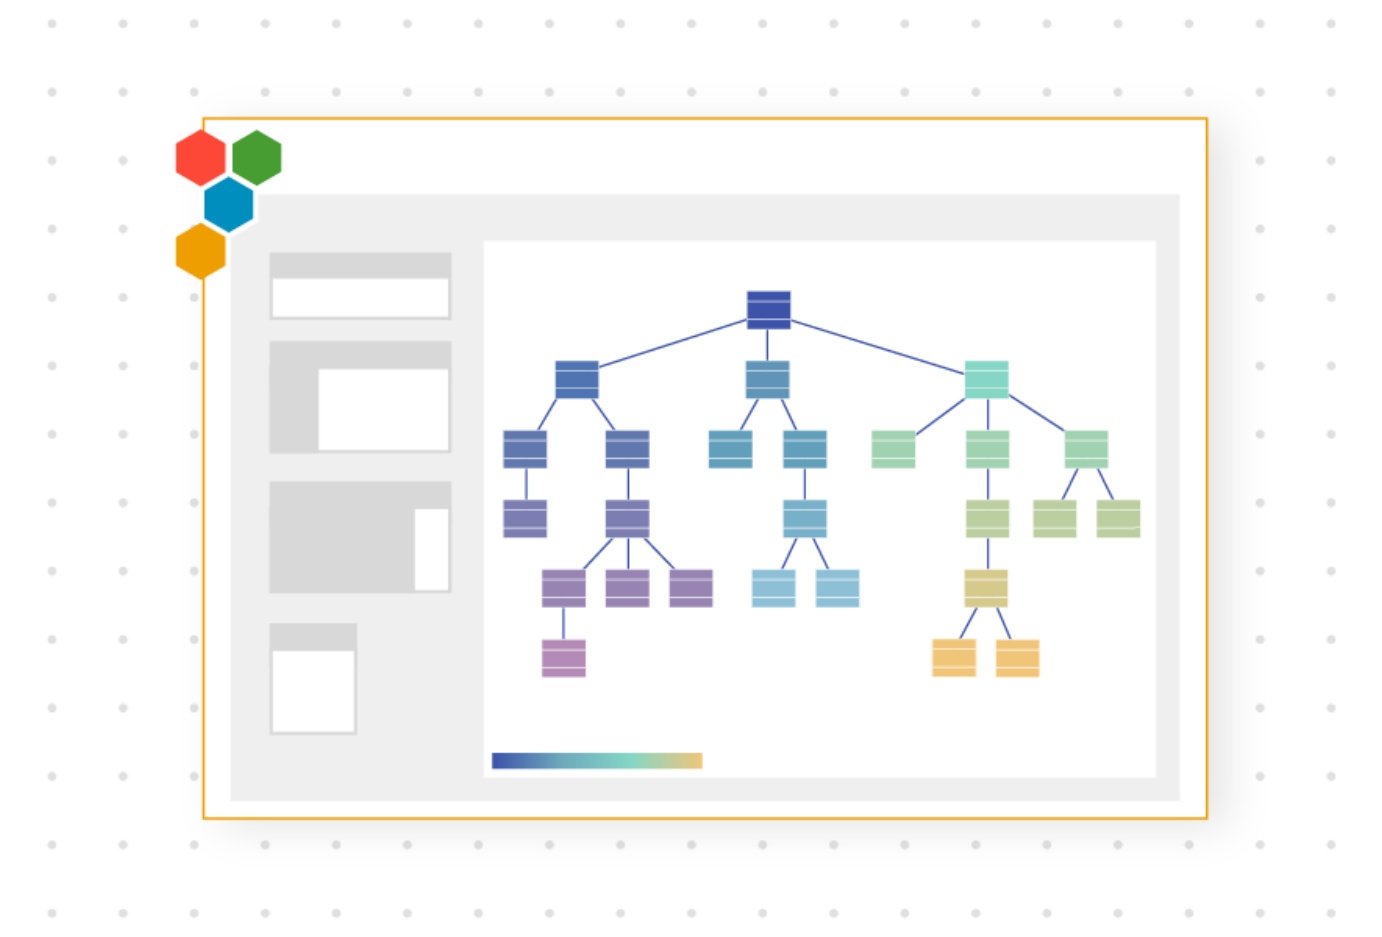
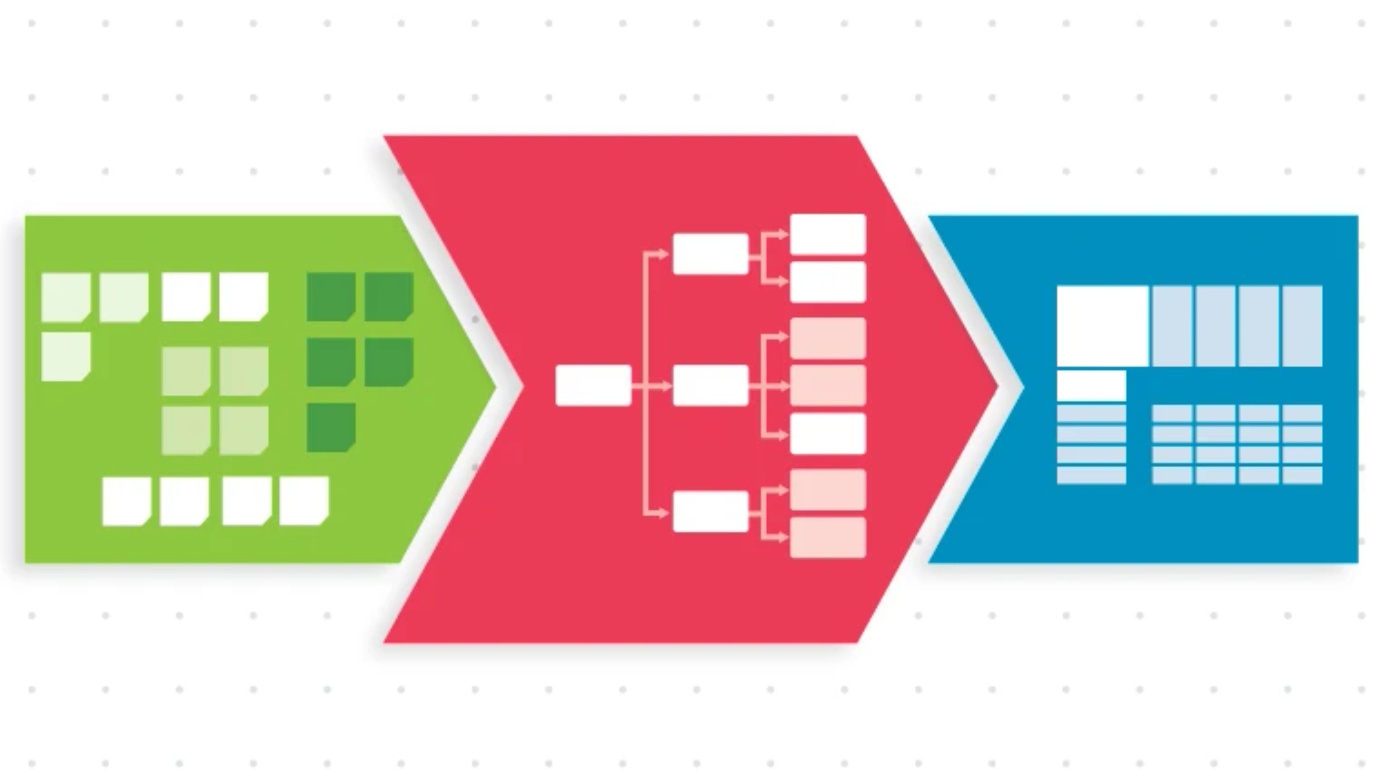
New! EngineRoom's first Machine Learning tool: Classification and Regression Tree
EngineRoom is proud to release our first Machine Learning tool. The Classification and Regression Tree is a foundational analysis tool that enables you to:
- Predict the output of a given set of inputs using the tool's easy-to-use and exportable Decision Tree Visualizer
- Understand which features, or inputs, have the most effect on the prediction of your outputs
- Understand both categorical outputs (classification) and continuous outputs (regression)
This tool is user-friendly and easy to implement, making it the perfect choice for understanding root causes or identifying patterns.
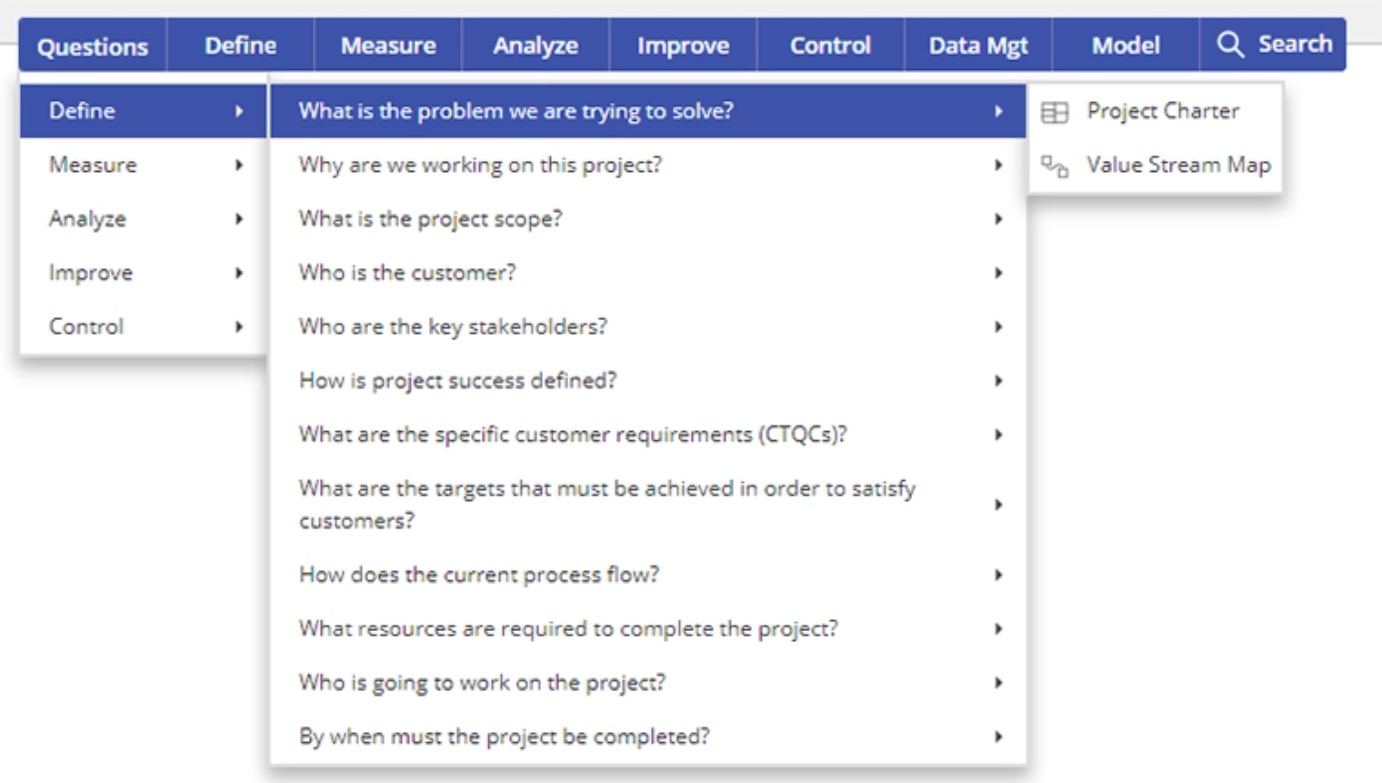
January 20, 2023
Solving 'What Do I Do Next?'' - EngineRoom's New Critical Questions Menu
Start your project off on the right foot with EngineRoom's Critical Questions menu. This new dropdown puts essential questions front-of-mind to help you know what to do next in your project.
- View potential questions to answer in a given DMAIC phase
- Get suggestions for tools that will help answer that question
- Open those tools directly from the menu
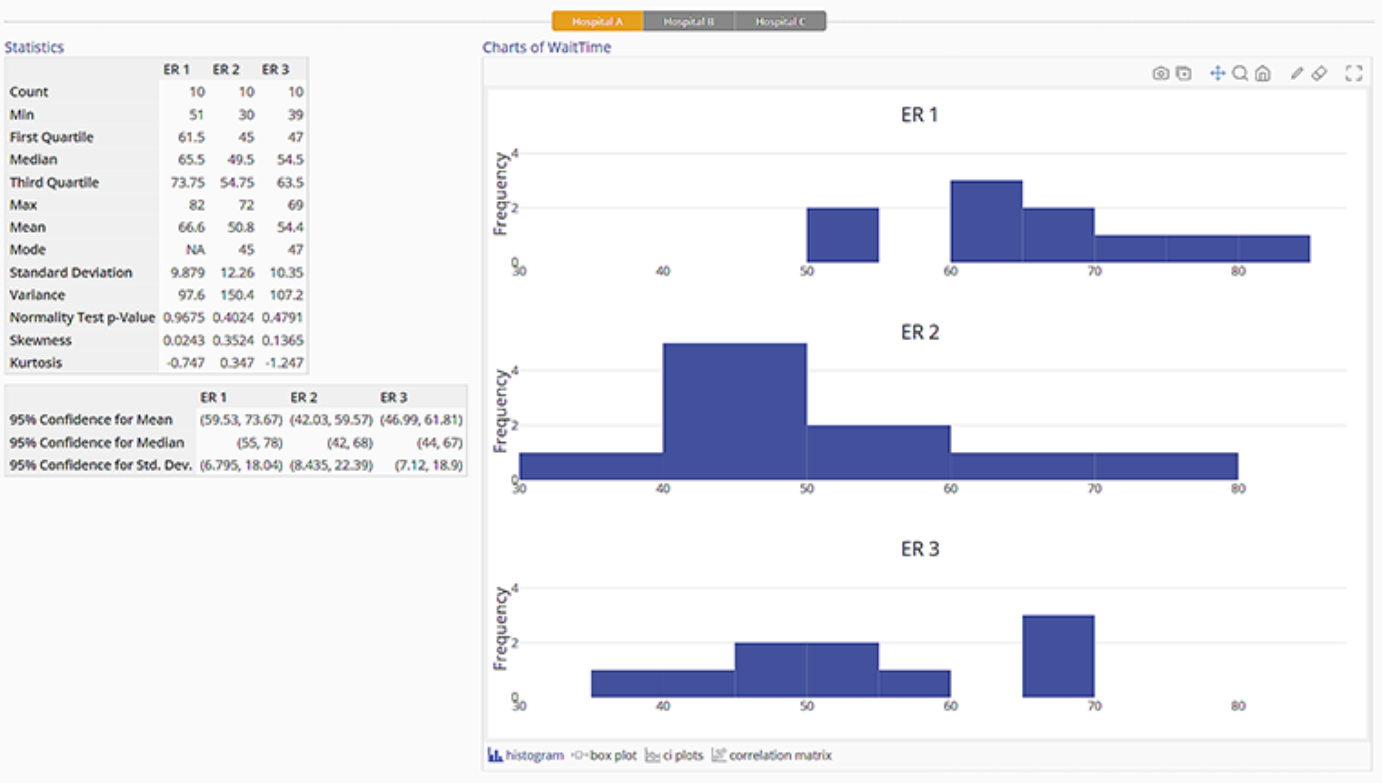
August 2, 2022
Quickly Explore Your Data with Graphical Summary and Distribution Identification
Graphical Summary:
- Generate statistics such as Count, Quartiles, Mean, Mode, Confidence Intervals, and more.
- Includes histograms, box plots, confidence interval plots, and correlation matrices in one tool.
- Divide your data into groups up to 2 levels. For example, compare how long Step 1, Step 2, and Step 3 take across Plant A, Plant B, and Plant C.
Distribution Identification:
- Quick reference slide shows you the best fitting distribution.
- Dig deeper by looking at the full output.
July 8, 2022
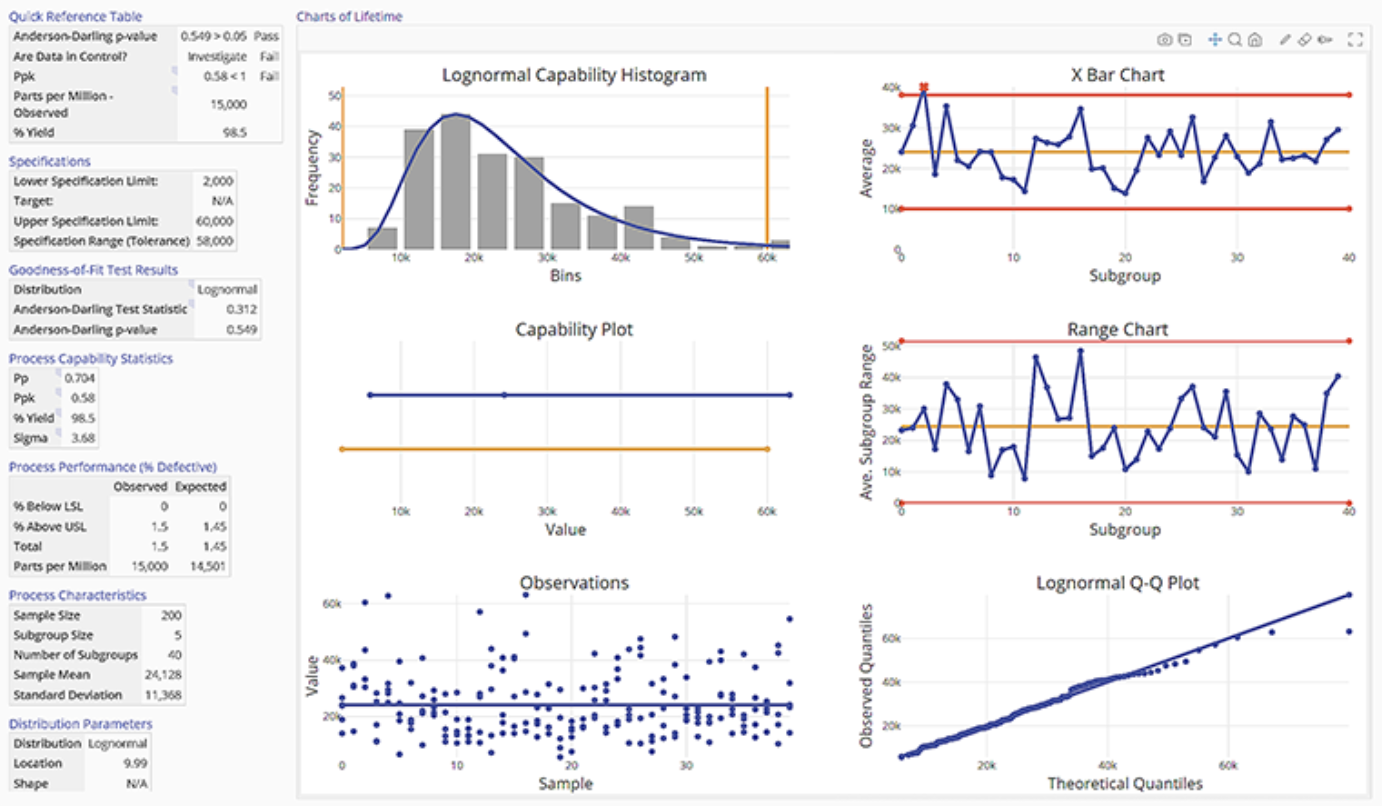
New Process Capability Tools for Non-Normal Data
EngineRoom is introducing two new statistics tools to enable Process Capability for Non-Normal Data. Find them in the Measure menu or Quality Tools menu under 'Non-Normal Process Capability.'
- Non-Normal Process Capability - Continuous: Run a Process Capability two ways — fit a distribution or use raw data by selecting Empirical Analysis.
- Non-Normal Process Capability - Discrete: Use counts of data as input to the Process Capability, whether it fits a Binary or Poisson distribution.
June 30, 2022
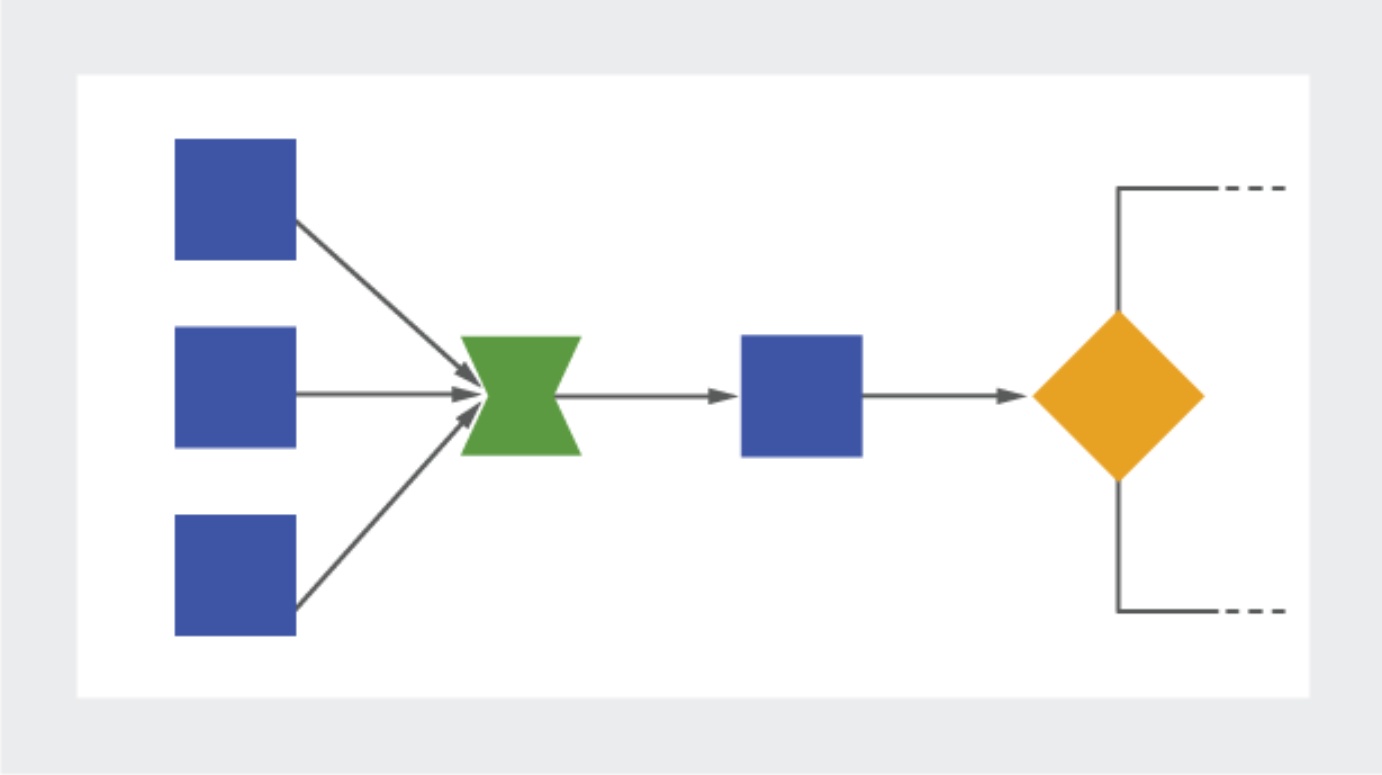
New Process Playground Block for Batching Different Items
The new FlexiBatch Block in Process Playground adds power to your process modeling with new functionality.
- Model cases such as shipping containers, trucks, trailers, heat-treat ovens, warehouse shelving, and more.
- Set "Equivalent Units" for items to group them based on a defined Total Volume, Weight, Length, Number, or other metric.
- FlexiBatch differs from a Batch — a Batch groups together many of the same item, while the FlexiBatch groups together many different items.
- FlexiBatch differs from a Kit — a Kit has a defined number for each item in the group, while the FlexiBatch has an undefined number for each item in the group.
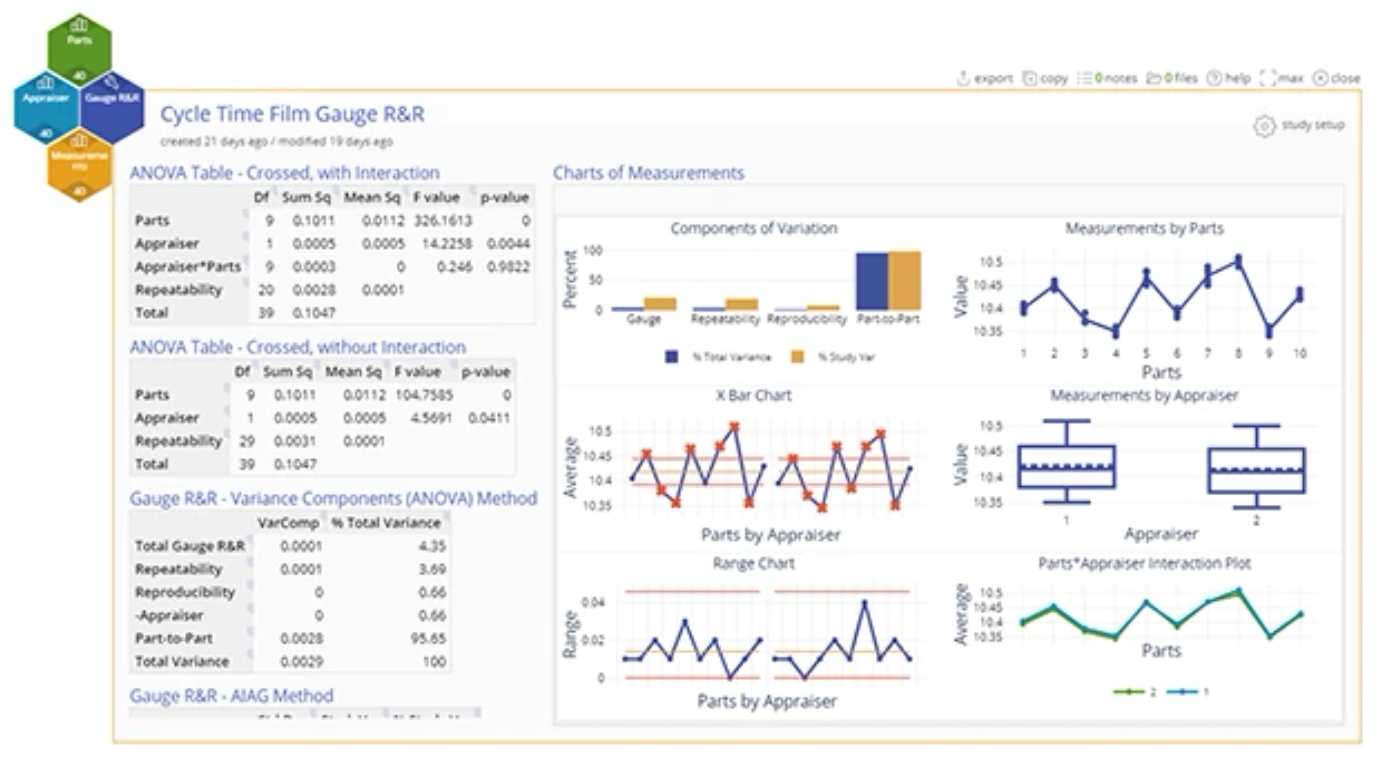
April 6, 2022
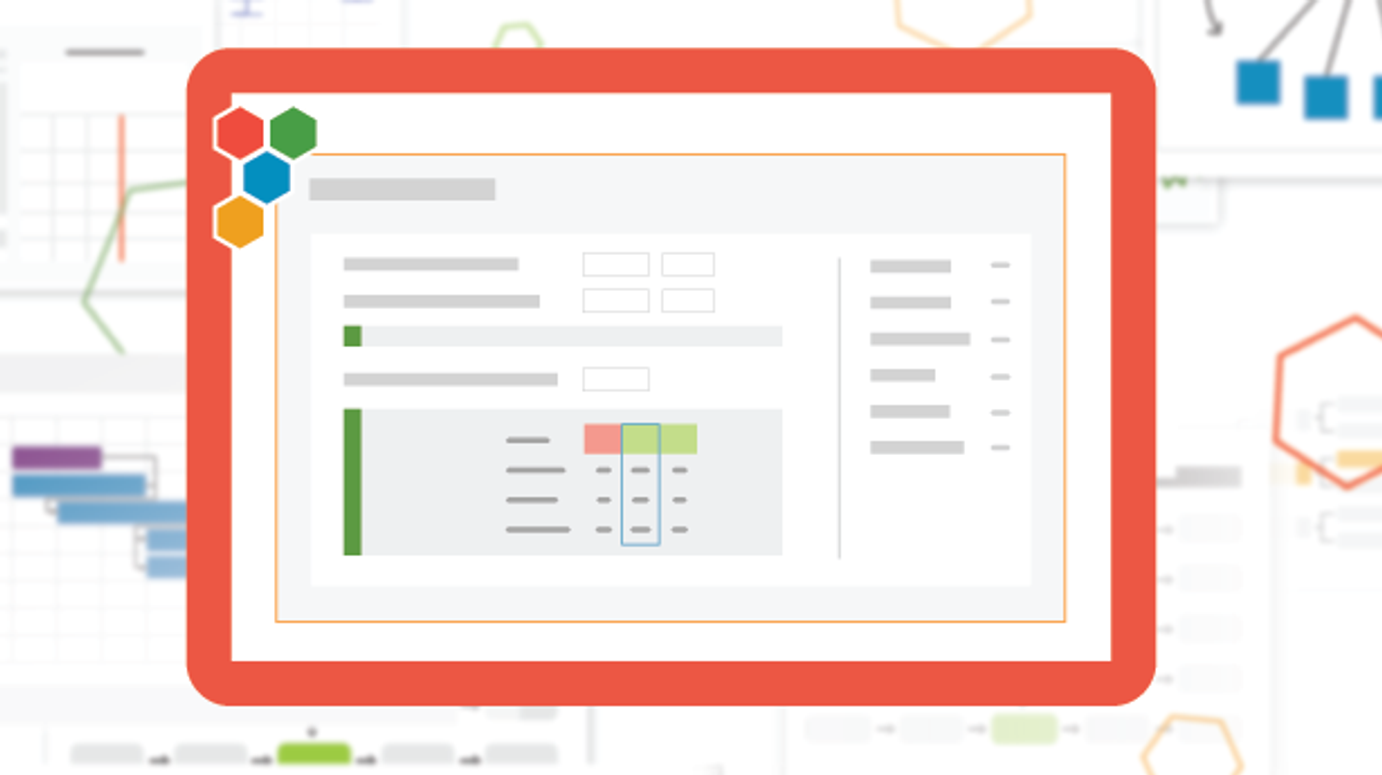
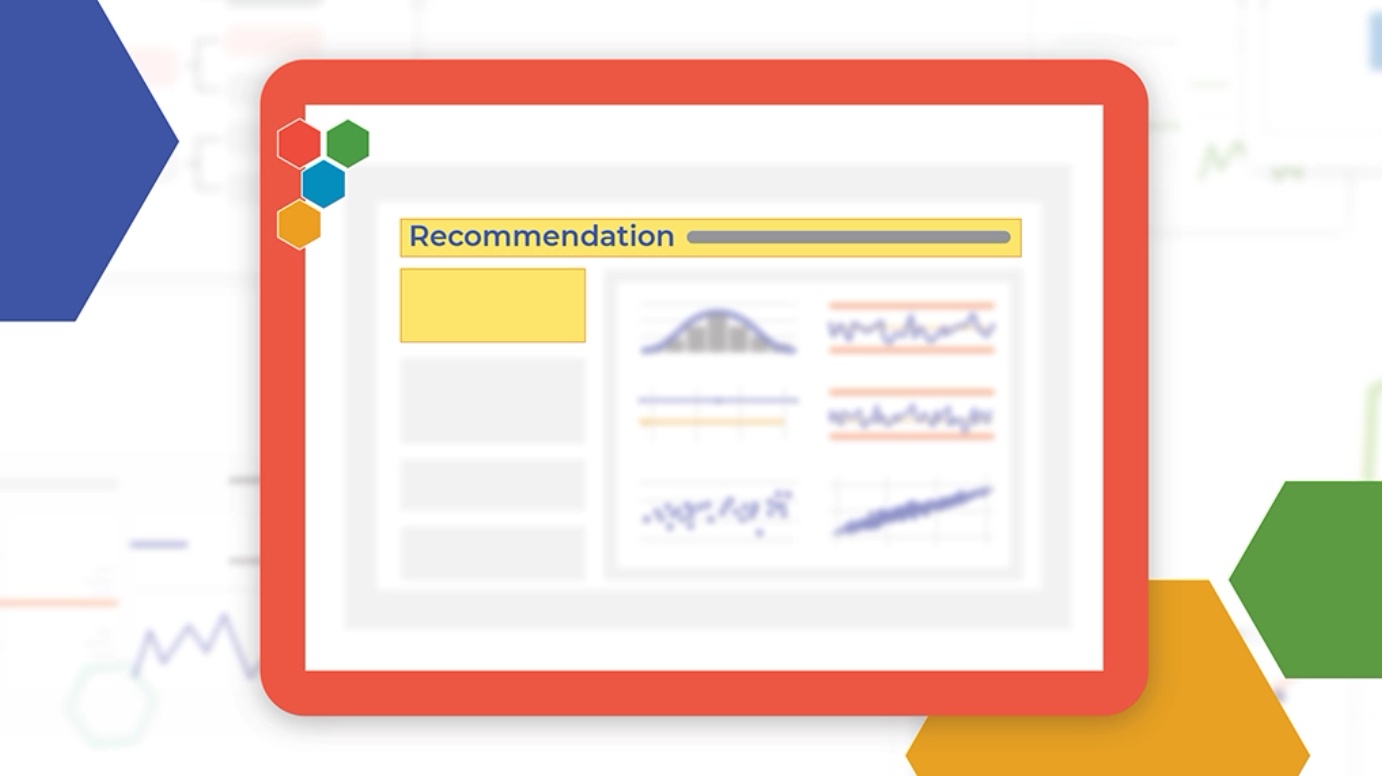
Study Interpretation Made Easy
Interpreting results in a Process Capability, Gauge R&R, and Attribute Agreement Analysis study just got even easier with these new references:
- Quick Reference Table: This practical implementation pulls the most relevant data from your study into a single table at the top of your output.
- Recommendation: The study now presents a simplified text recommendation on the output based on new user inputs.
We're making it easier to analyze and interpret your data by organizing and presenting the most relevant information to your study front and center.
February 18, 2022
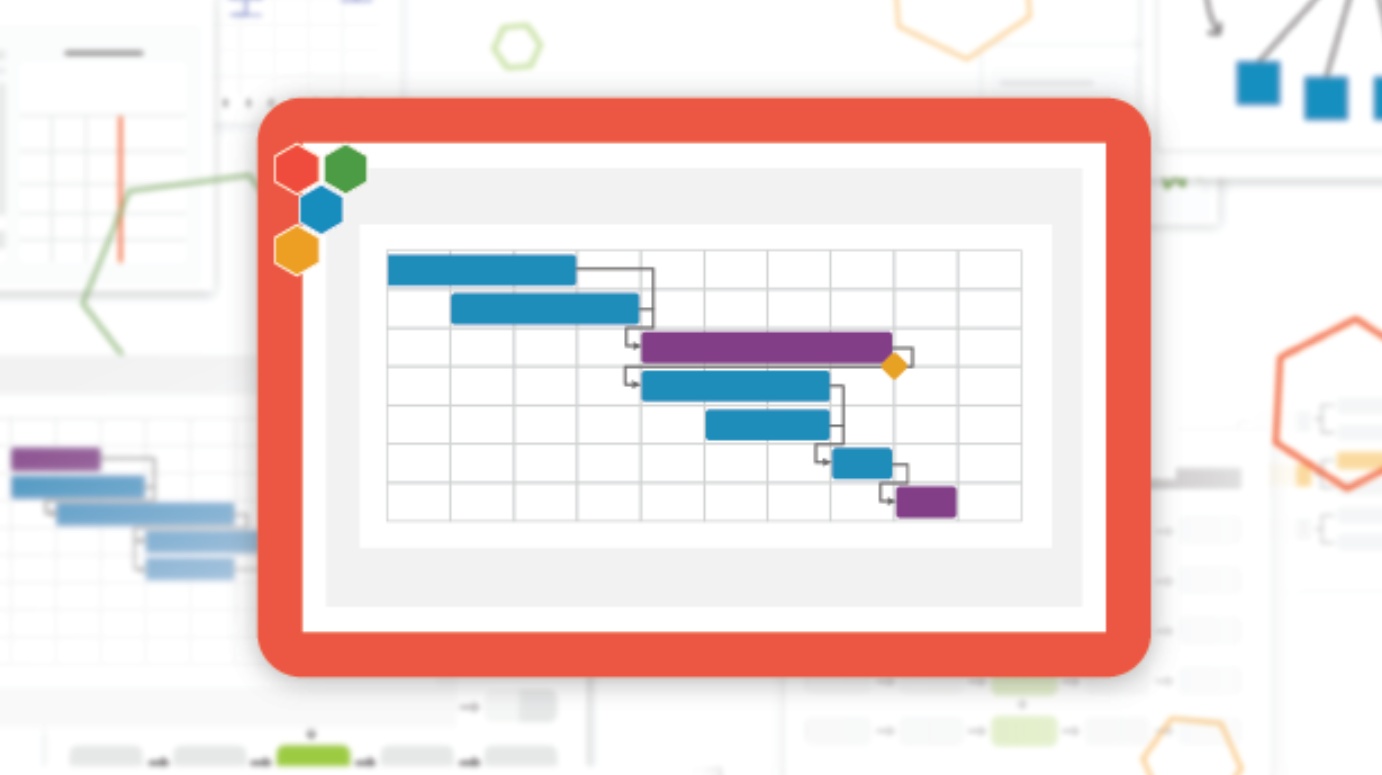
'Gantt' Stop 'Til You Get Enough!
Visualize your project timelines with a slick update to our Gantt Chart. Easily map out dependencies, see potential conflicts, and manage time to completion for all your projects. Organize your task list by dragging and dropping and nesting tasks that are grouped together. Documenting your project plan has never been this easy. We "Gantt" wait for you to try it!
January 19, 2022
Reinventing the 5-Why Template
Classic or Simplified? Wherever you start, enjoy complete flexibility in defining your 'Whys', documenting countermeasures, and annotating! Keep it super 'Simple' with a 5-Why diagram and reserved spaces for countermeasures or choose 'Classic' for a more in depth analysis. Bonus: it integrates into our project tracking software, TRACtion!
- Simplified: a diagram that puts the 5 Why front and center with defined boxes for temporary and permanent countermeasures
- Classic: what you get in the simplified version + defined boxes for dates, verification, and checking for regression over time
October 25, 2021
Manage Your Diagrams Your Way
- Copy Your Diagram — create a replica of your current diagram
- Move Your Diagram — change the project where you can access the diagram
- Send Your Diagram — create a copy of your diagram to send to another user in your company
- Share Your Project — our current sharing feature, just in another convenient spot
September 29, 2021
Software Validation Kit Released to Support Documentation Needed For FDA Compliance
We recognize that your company may operate in a regulated environment, and agencies like the FDA need more than just "our word" when it comes to validation. To this end, we put together a software validation kit to make it simple for your IT department to run a validation test on EngineRoom. The kit includes documentation on our development process, our security practices, datasets from NIST and corresponding EngineRoom output images. The best part: you will have all of this preloaded into EngineRoom along with the corresponding instructions.

June 24, 2021
Innovative VOC Chain Updates to Support Your Design Process
Move seamlessly from brainstorming on an Affinity Diagram to defining CTQCs. Then select your design using Cause & Effect Matrix, Basic QFD, or Pugh Analysis before validating your design with the new scorecard. Your information will auto-populate the next template to reduce work and potential for mistakes. Login to see these new features for yourself!
- Pugh Analysis tool updated.
- New Design Scorecard introduced.
- Data can now be automatically passed from Affinity Diagram to CTQC, Cause & Effect, Basic QFD, Pugh Analysis, and Design Scorecard.
April 6, 2021
Sharpen Your Picture
Tell your story in your own way. Choose the styling and colors that best fit your data visualization. We fine tuned EngineRoom's charts to provide high resolution output that goes from number crunching to presentation in a couple quick clicks. Look sharp, be sharp.
December 10, 2020
Instructor Slide Sets
Introduce your students to all the process improvement tools with a step-by-step tour of how to use each tool in EngineRoom. No need to prepare extra class materials — slide sets are available for commonly used Lean and DMAIC tools. If students have questions when they're practicing or later doing project work, they can access the in-product User Support that includes video tutorials and the same step-by-step instructions.
October 30, 2020
Voice of the Customer (VOC) Chain of Custody
The revamped VOC tools—Affinity Diagram, CTQC, and Cause & Effect Matrix—help you to better analyze customer feedback and take action with confidence and clarity. We've also added a new feature that unifies these tools and creates a smooth flow of trackable information. A VOC roadmap now appears in the top corner of these new studies, signaling the passage of information from one study to the next.
- In an Affinity Diagram, click the CTQC icon to pass your category names as drivers.
- In a CTQC Diagram, click the Cause and Effect Matrix icon to forward the CTQCs.
October 30, 2020
Folders for Studies
Have a long list of studies? Organize your studies into folders to make them more accessible and visible. Name your folders according to your project phases, types of information, teammates, or other categories of your choice.
May 14, 2020
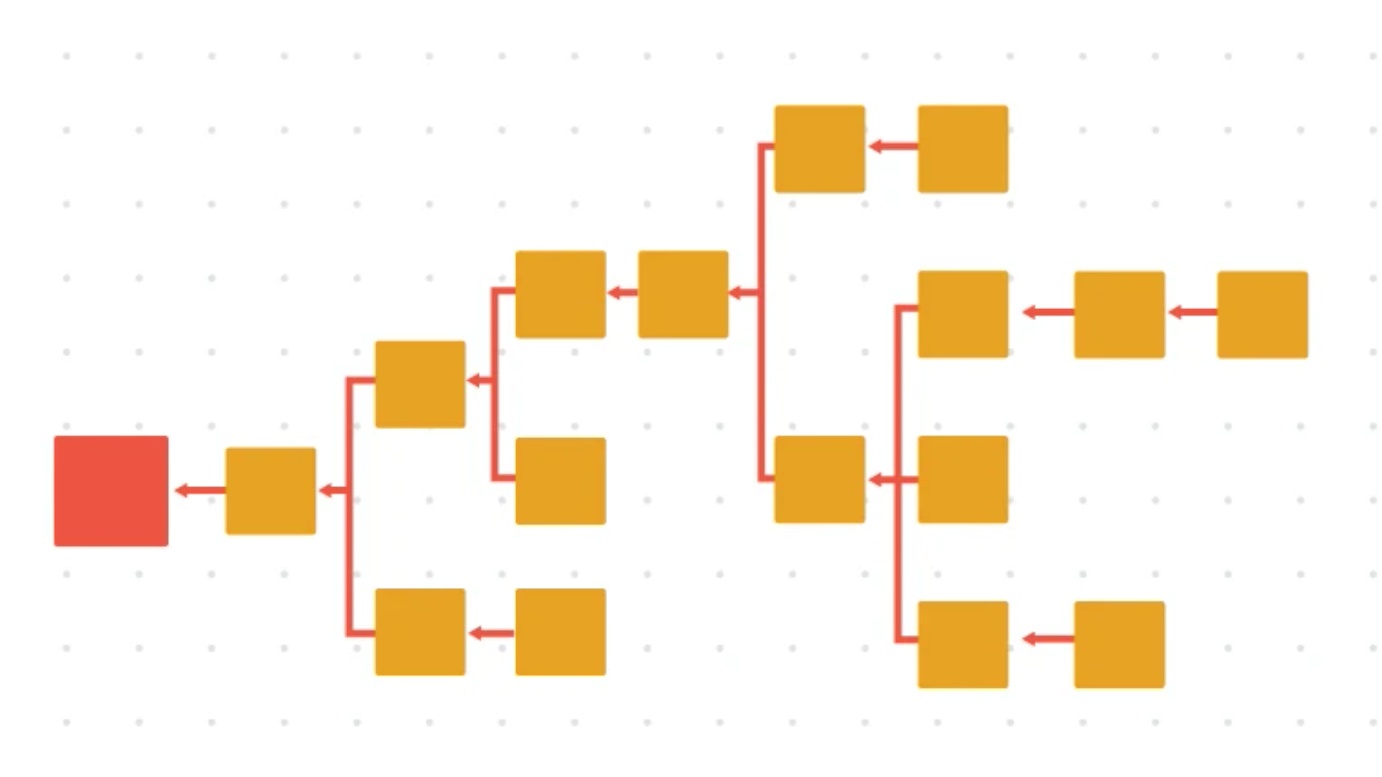
New Tool Added: Root Cause Tree
Identify the Special Case causes that affect the outcome and communicate them efficiently and effectively. Our Root Cause Tree allows you to brainstorm and build diagrams quickly, ready for projects and presentations alike.
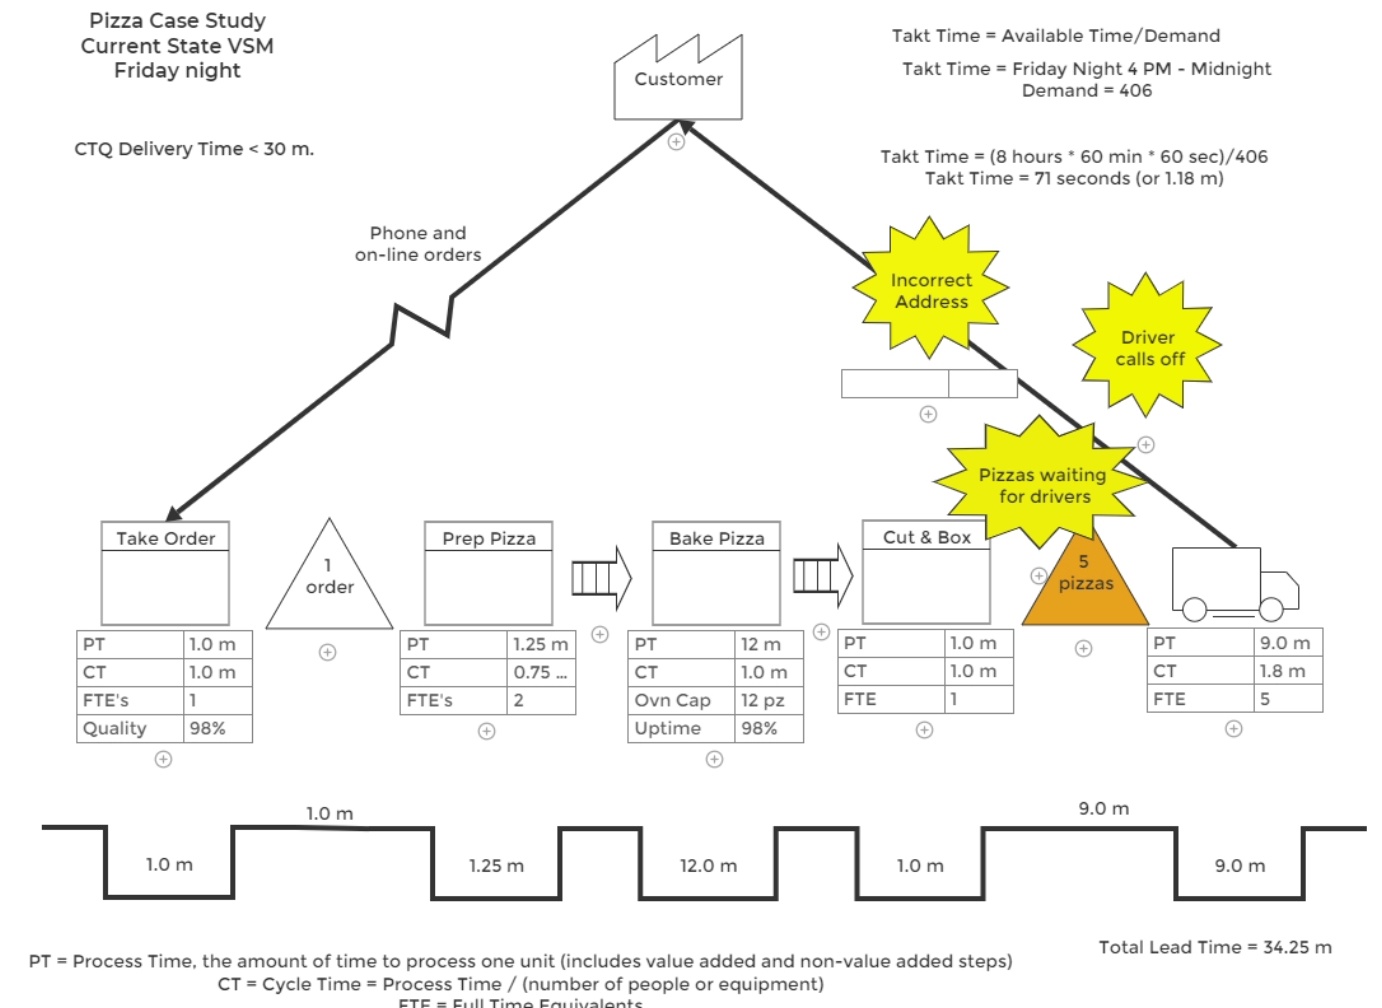
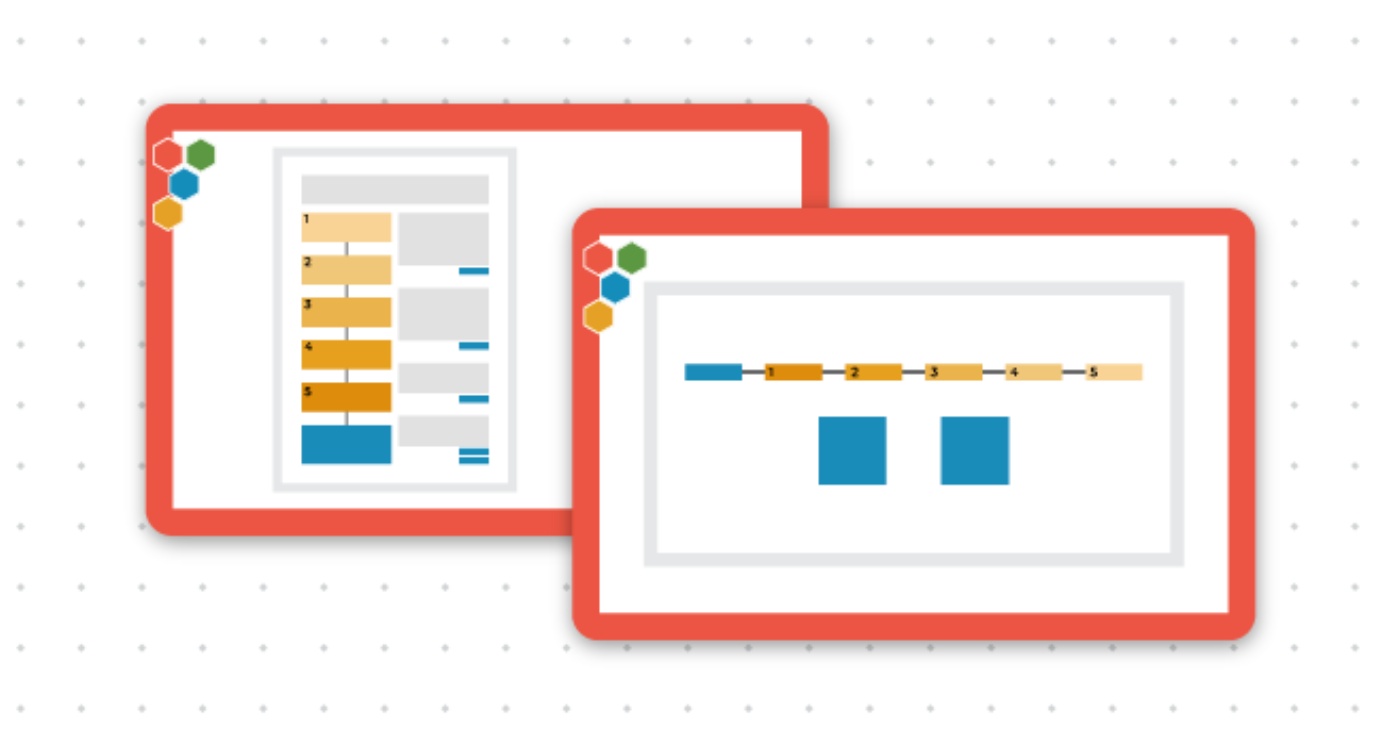
February 21, 2020
Value Stream Maps Updated: From Messy Sketch to Polished Deliverable
Your working draft can now be presentation-ready with these new enhanced features.
- See the big picture of your process on the new expanded work area.
- Create data blocks with pre-formatted objects paired with the specific process step.
- Build the timeline quicker and cleaner. Easily adjust it as your map changes.
- Add pizzazz with additional formatting options for all shapes and text.
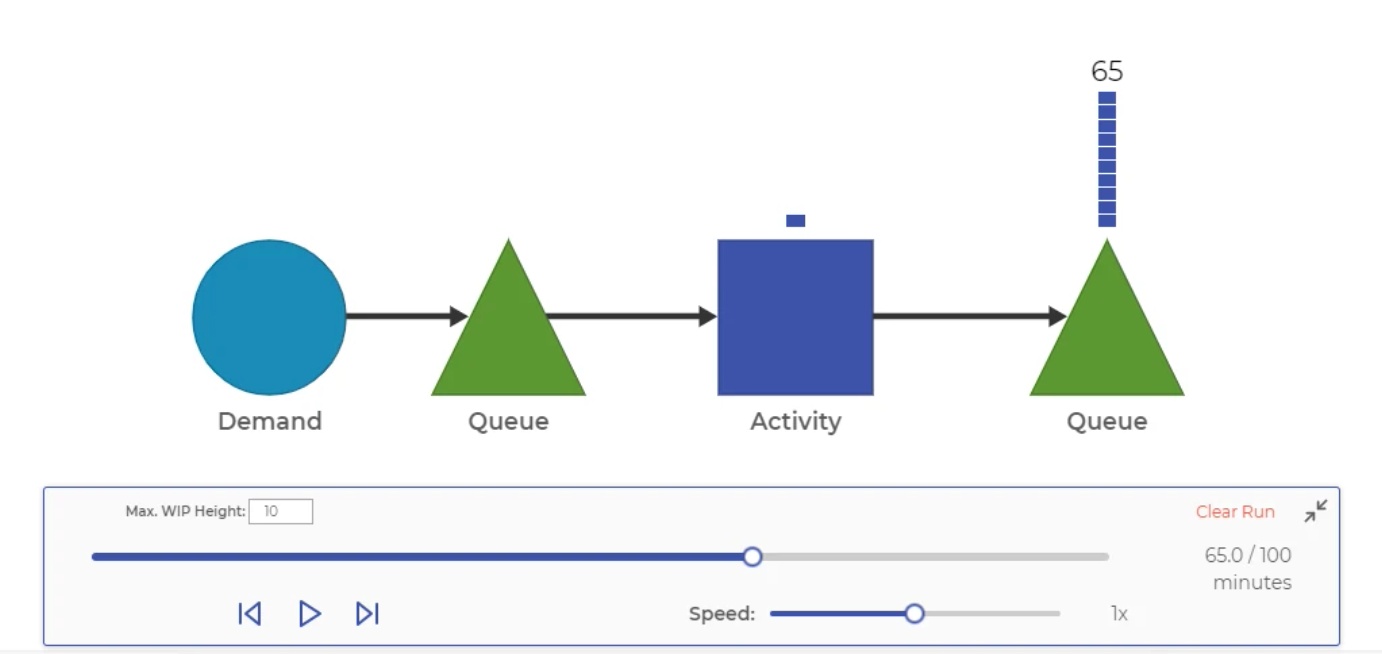
December 12, 2019
Process Playground Added to EngineRoom!
We're proud to introduce the new and improved Process Playground, an online discrete event simulation and process modeling tool, now available in EngineRoom.
Test before you invest with by creating a virtual prototype of your process and experiment with solutions, without the real-life cost.
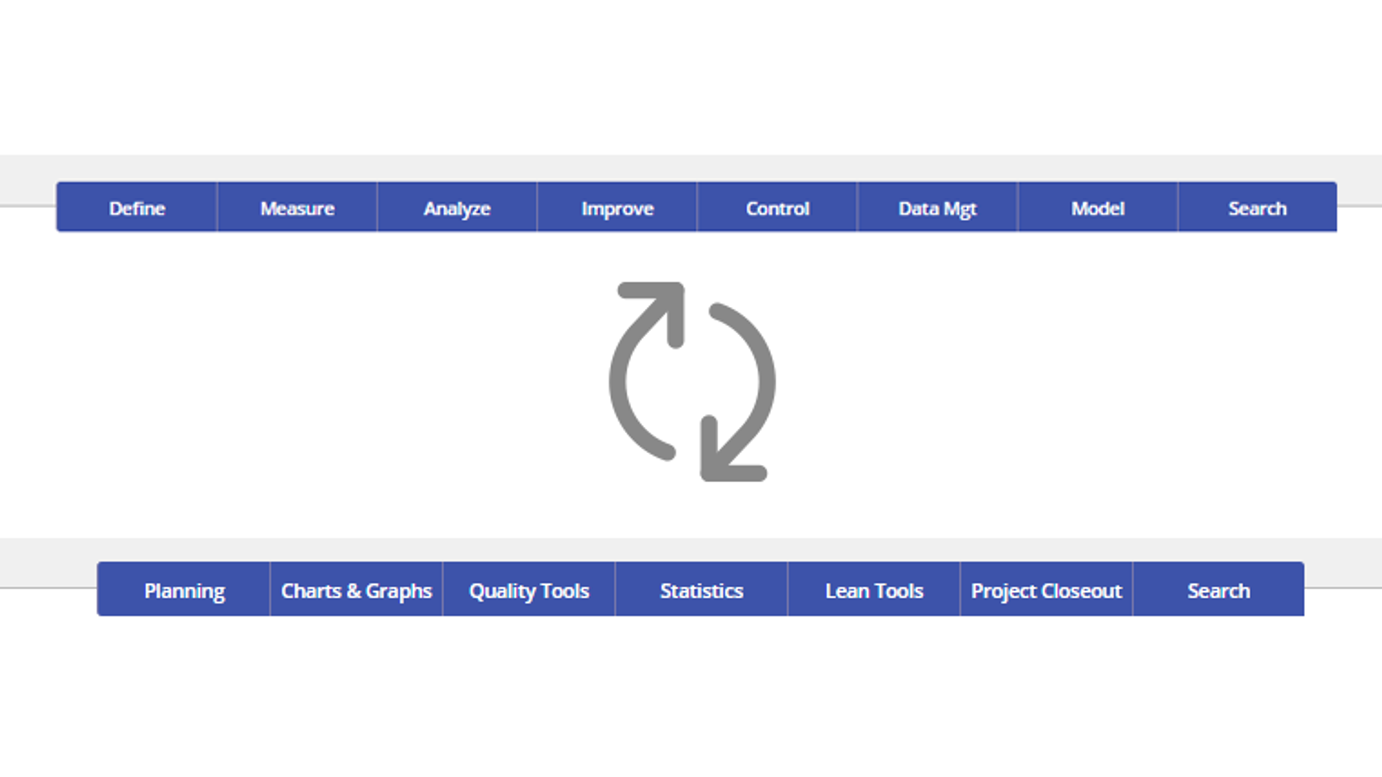
November 19, 2019
DMAIC and Standard: Switch Between Menu Types
Choose how you want your tools organized.
The default DMAIC menu organizes tools by phase of a DMAIC project. The new Standard menu organizes the EngineRoom toolbox by function, including Planning, Statistics, Lean Tools, and more.
Go to the User menu in the upper-right corner of EngineRoom to change your menu type. Same tools, new format.
August 27, 2018
Error-proofing Added to Data Editor
EngineRoom helps you get it right the first time. When you upload your data, empty data cells will be highlighted in red. You can also have EngineRoom check for numeric outlier values and inconsistencies in data type (numeric, text, or date). Identify potential issues early and proceed with confidence.
August 1, 2018
Guided Mode for Analytical Studies
EngineRoom just got smarter! Guided mode is now available for charts, graphs, and statistical tools. Now, even if you haven't used a particular tool for a long time, you can proceed efficiently and confidently. We'll lead you through step-by-step from entering the right data to making sure you've considered the available options.
April 26, 2018
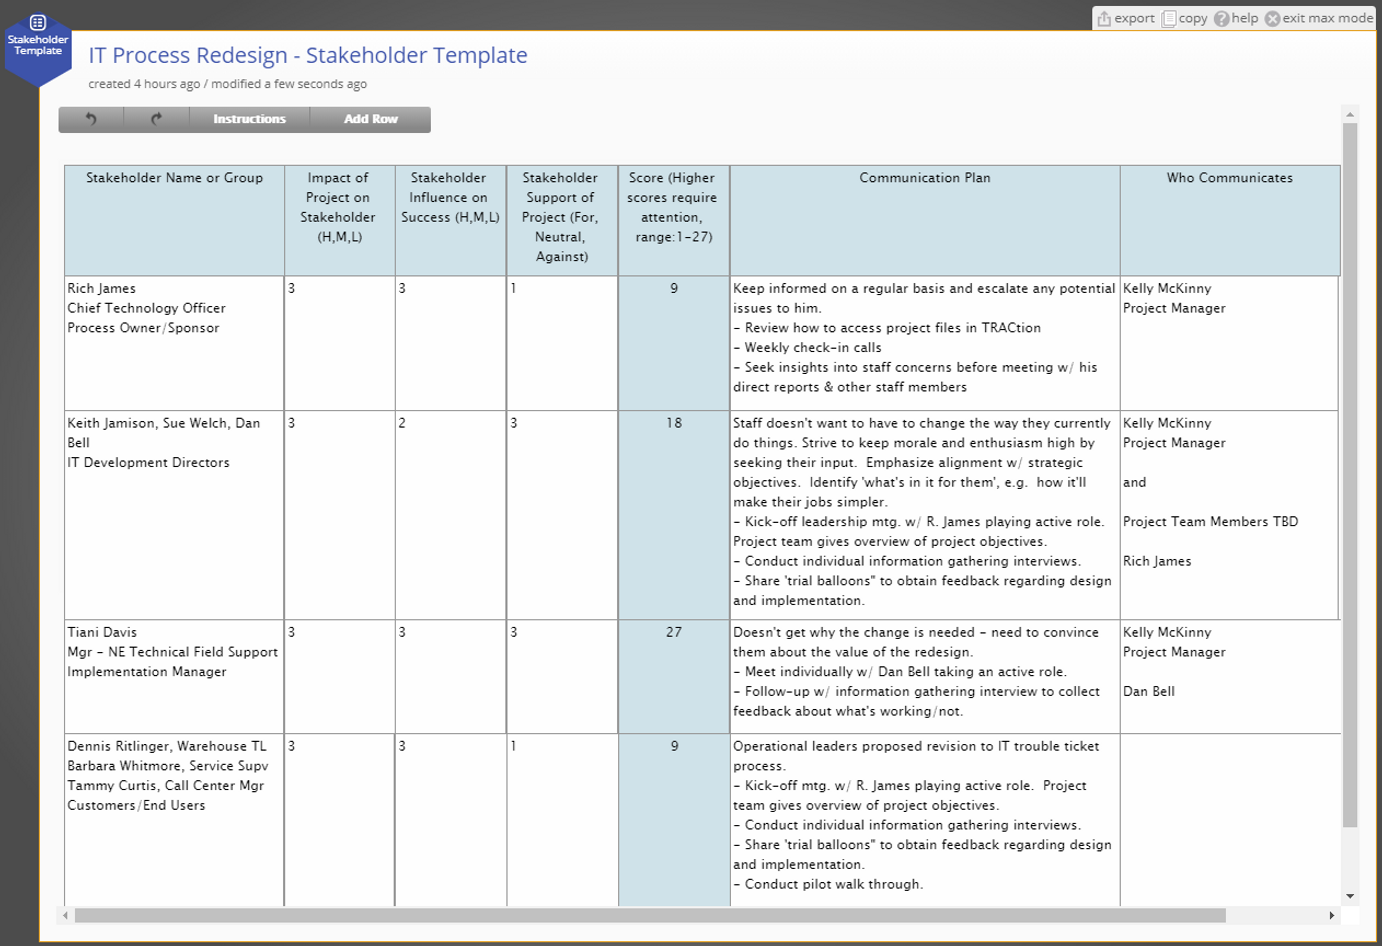
Stakeholder Analysis Template
Develop a plan to keep stakeholders actively engaged to ensure projects are successful and the changes are sustained. This template guides you to identify both internal and external stakeholders and then to create a communications plan for the project's duration.
December 15, 2017
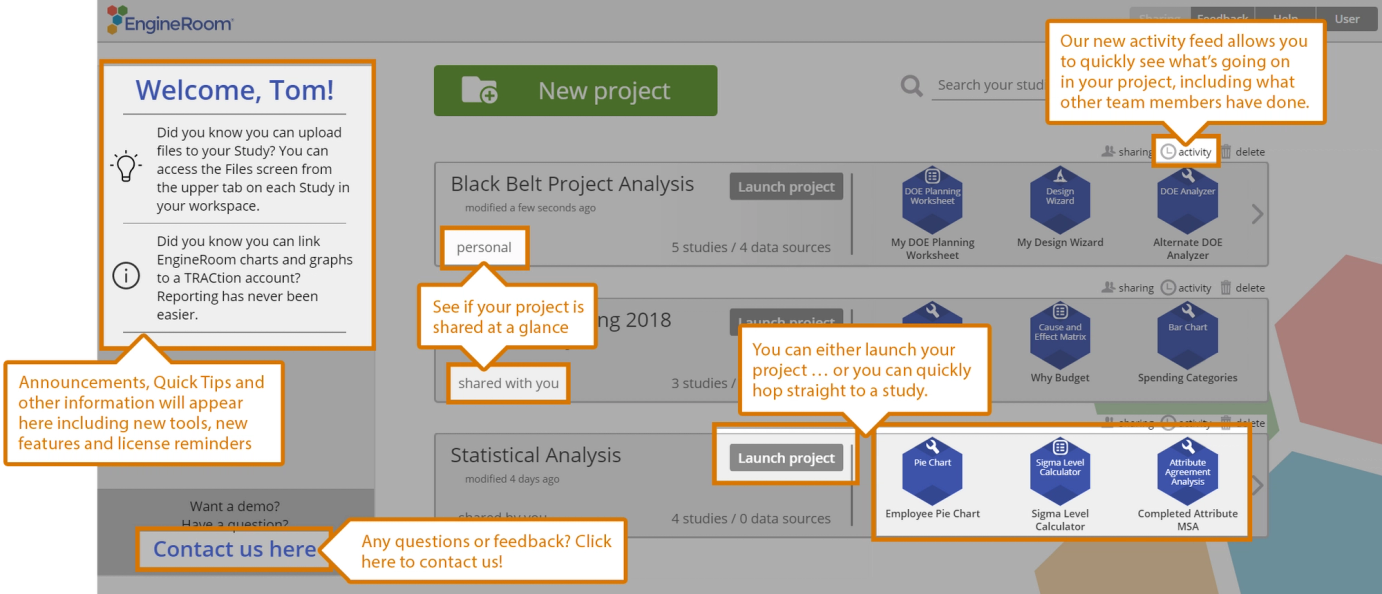
Redesigned Landing Page
Choose how you want your tools organized.
Take a look at the new landing page that provides a master view of your project work. It's a more visual way to display your project list and provides quicker, more visible access to your studies. There is also a new section for announcements, reminders, and helpful information.
October 25, 2017
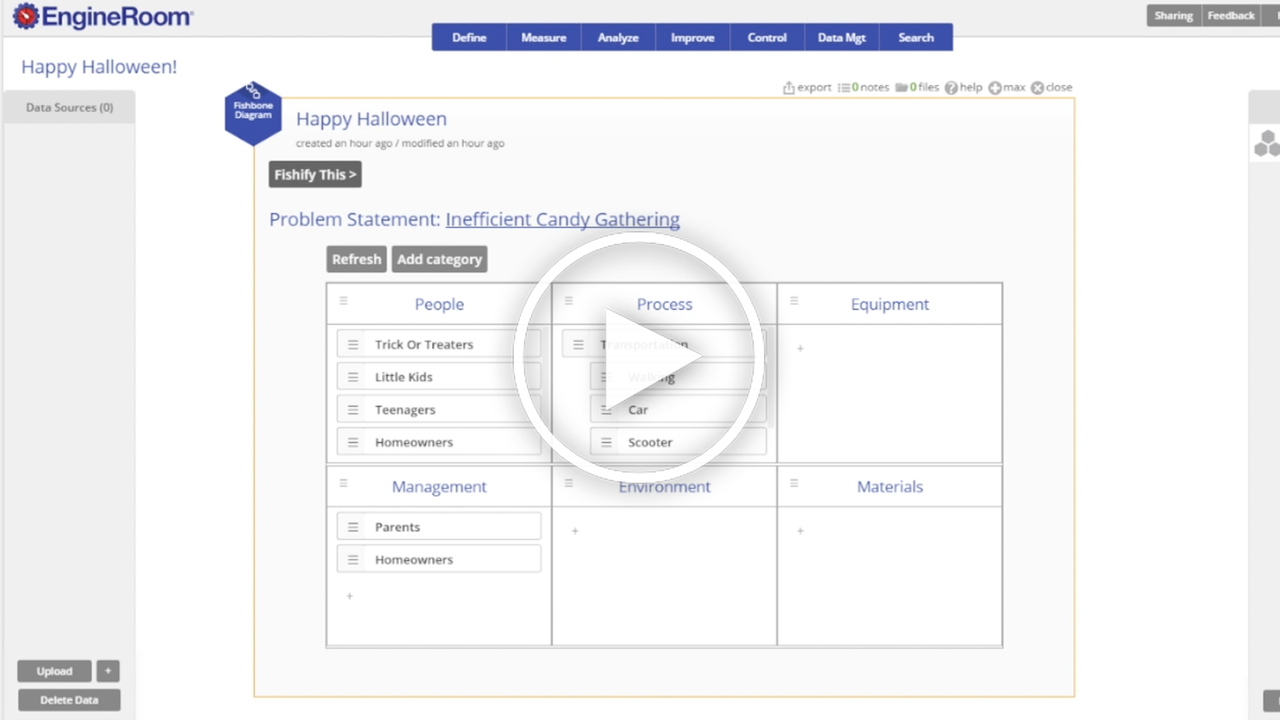
Improved Fishbone Diagram
See how to capture possible root causes and then easily print, export, and share your brainstorming with EngineRoom's updated fishbone diagram. (Also called Ishikawa or Cause & Effect Diagram.)
June 15, 2017
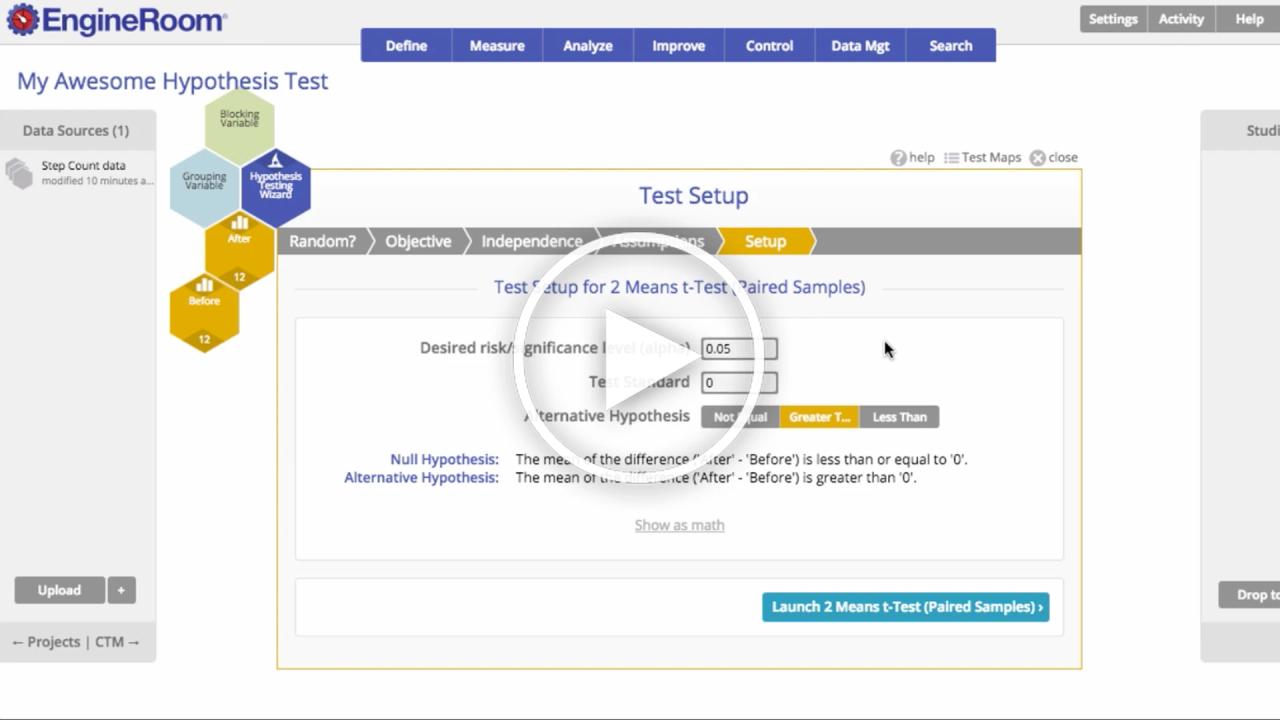
New and Improved Hypothesis Testing Wizard
Take a look at the updates to EngineRoom's Hypothesis Testing Wizard. It streamlines the basic steps to help you setup and run tests with confidence, whether it's your first hypothesis test or you're a frequent user.