Simulation Widget
Dashboard View
Some courses are enhanced with a practice simulation, like St. Sigma. In these cases, the Simulation widget will be included in the dashboard. It will be found in the bottom row between Course Engagement and the Student panel.
Expanded View
Scores
The expanded view of the Simulation widget is split into 2 sections: Scores and Tollgate Stats.
The widget will open to the Scores section by default. Here you will find the scores by phase for each user in the dashboard.
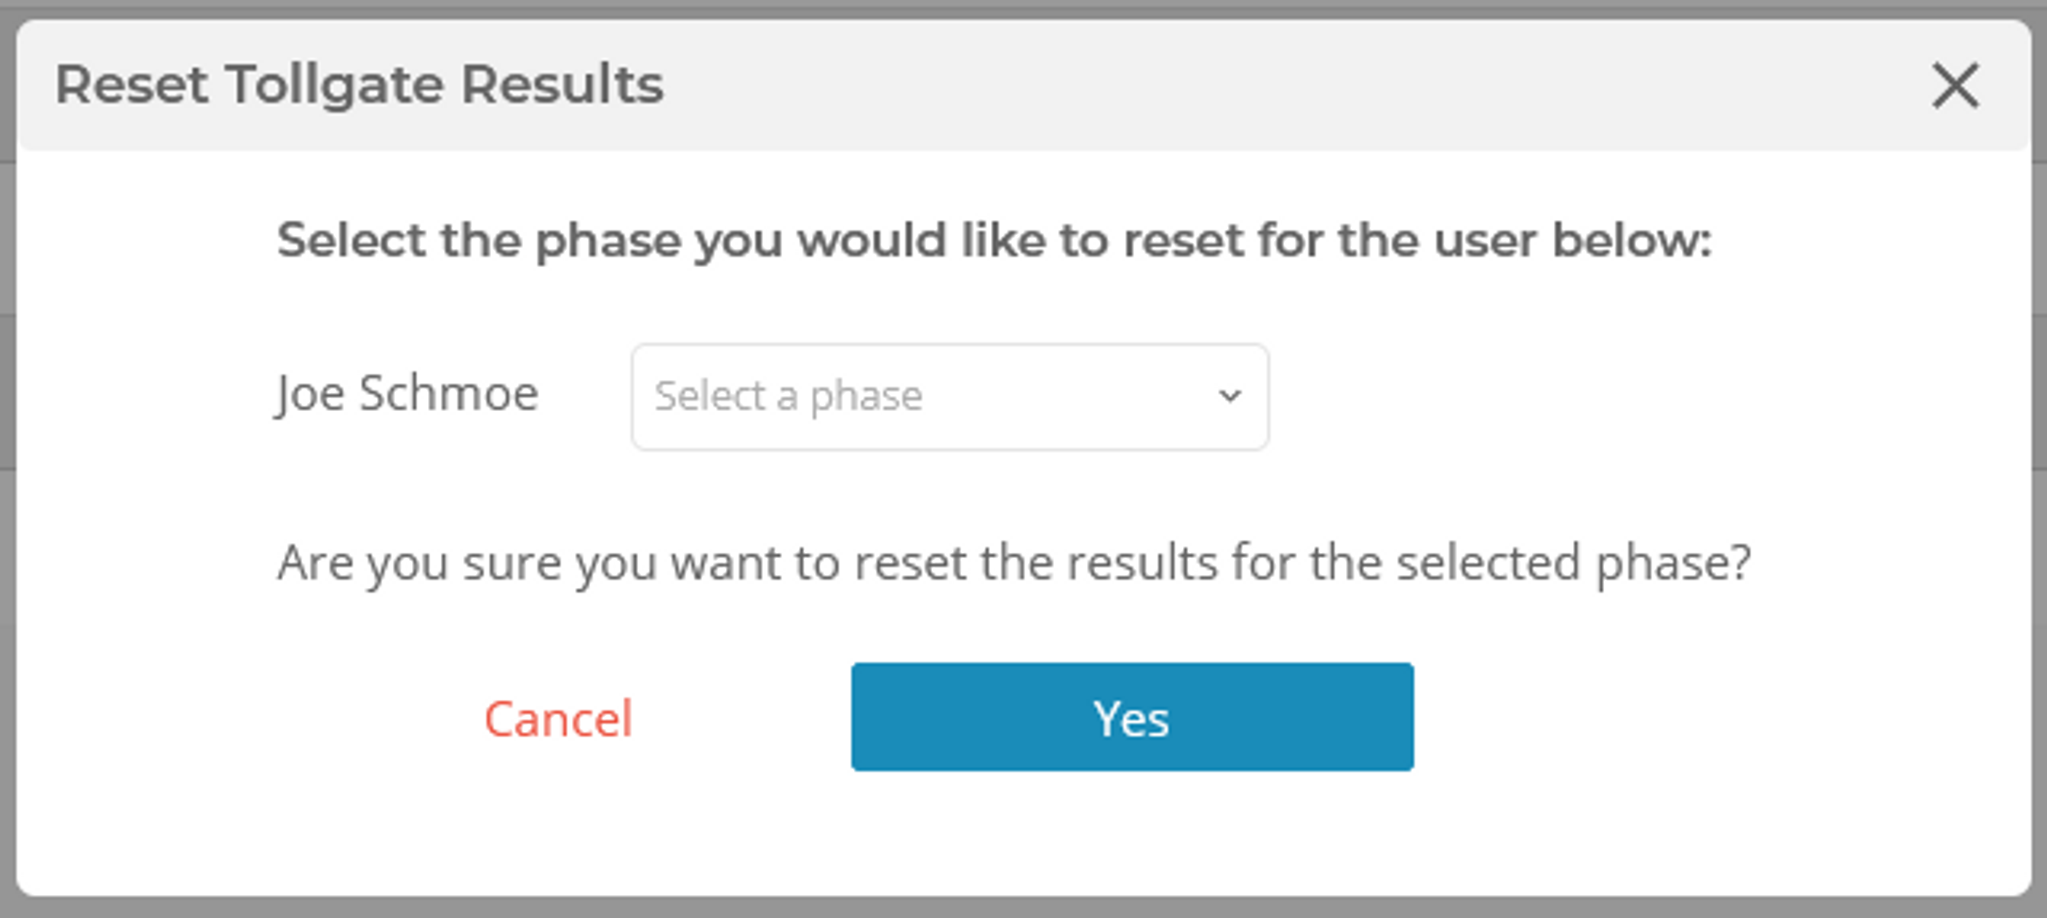
You can reset any phase for users by clicking the "reset" button on the right. A modal will pop up for you select the phase you wish to reset.
Refresh the tollgate question results at any time by clicking the icon in the top right corner.
Tollgate Stats
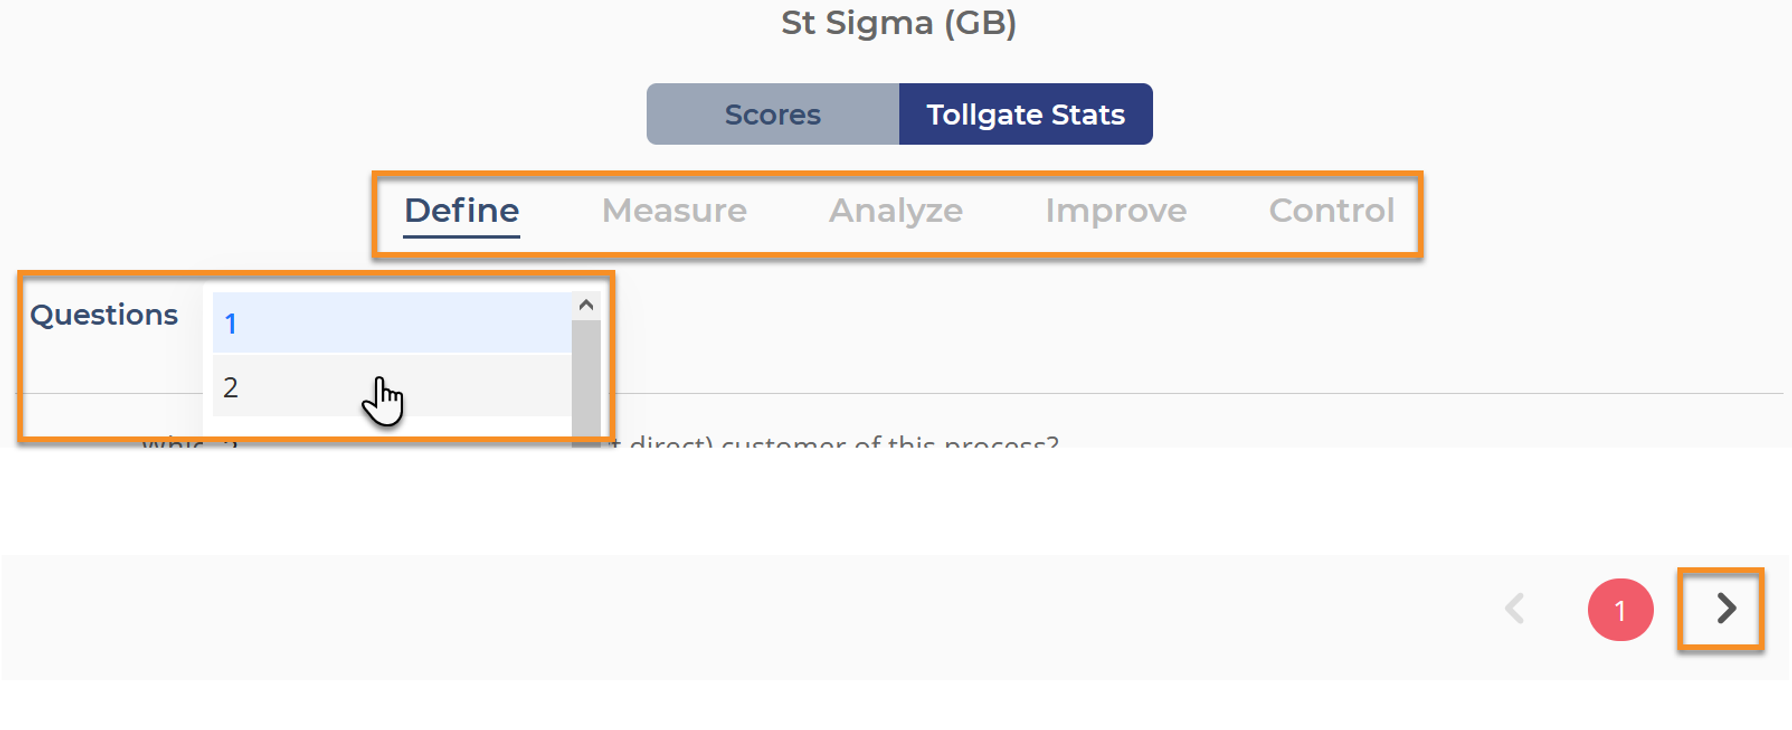
Click the "Tollgate Stats" button at the top of the Simulation widget to switch pages.
This section will allow you to review the tollgate questions and see how each user answered them. You can navigate through the questions by phase (using the phase names at the top), selecting the question from the drop down below the phase names, or click the next arrow in the lower right corner.
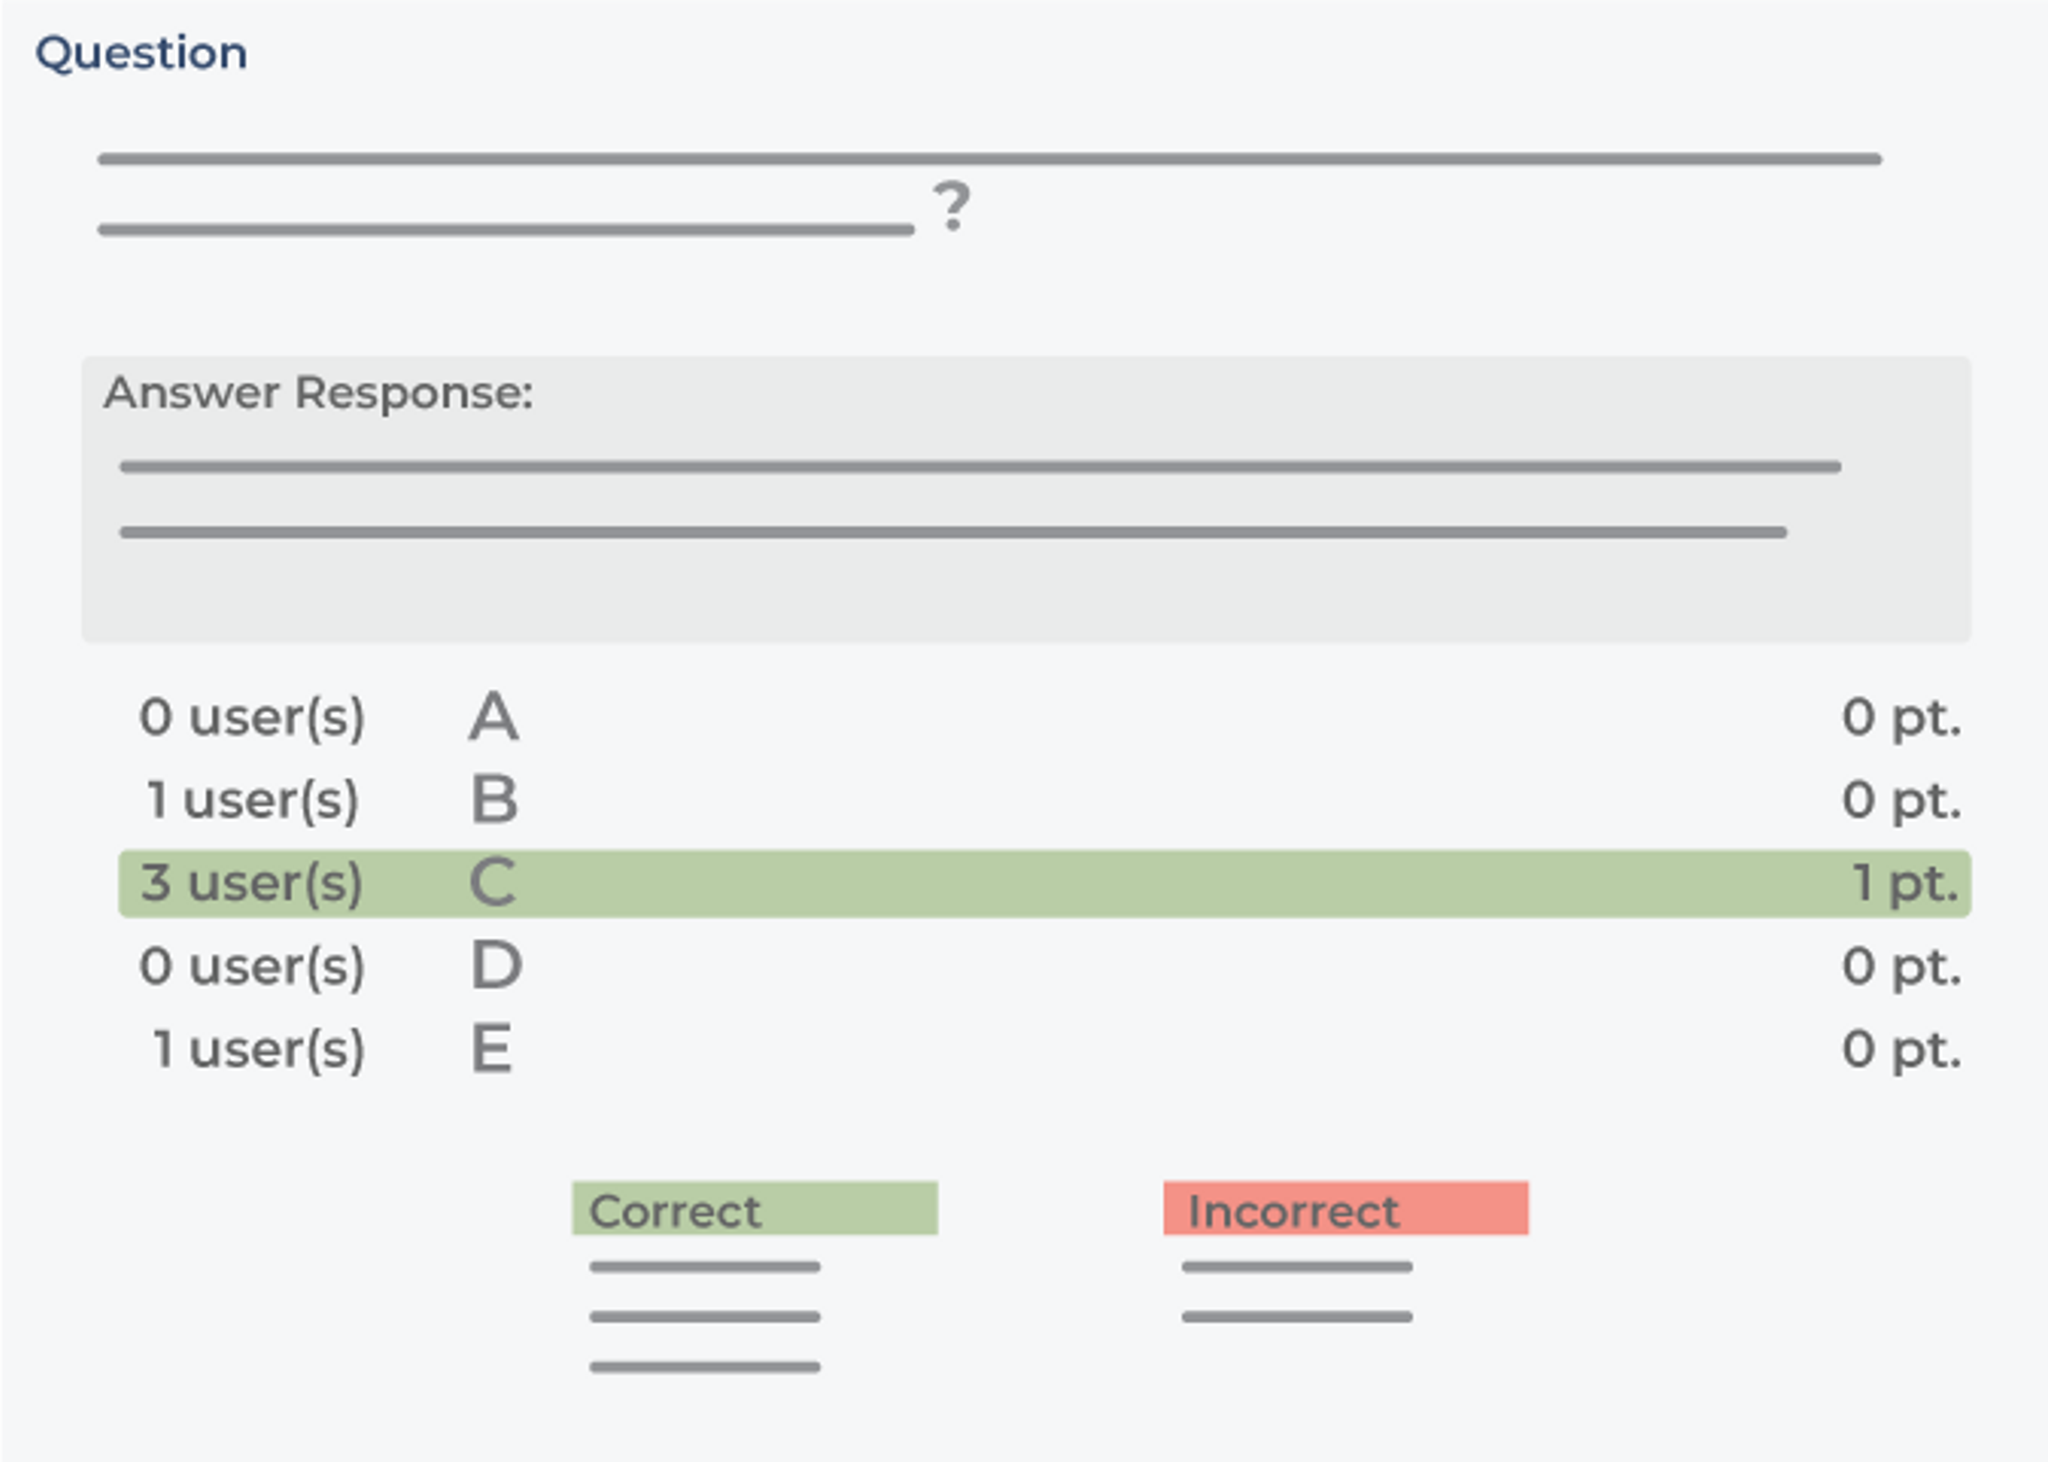
For multiple choice questions, the number of students who answered each option will be on the left and the number of points given for each response is on the right.
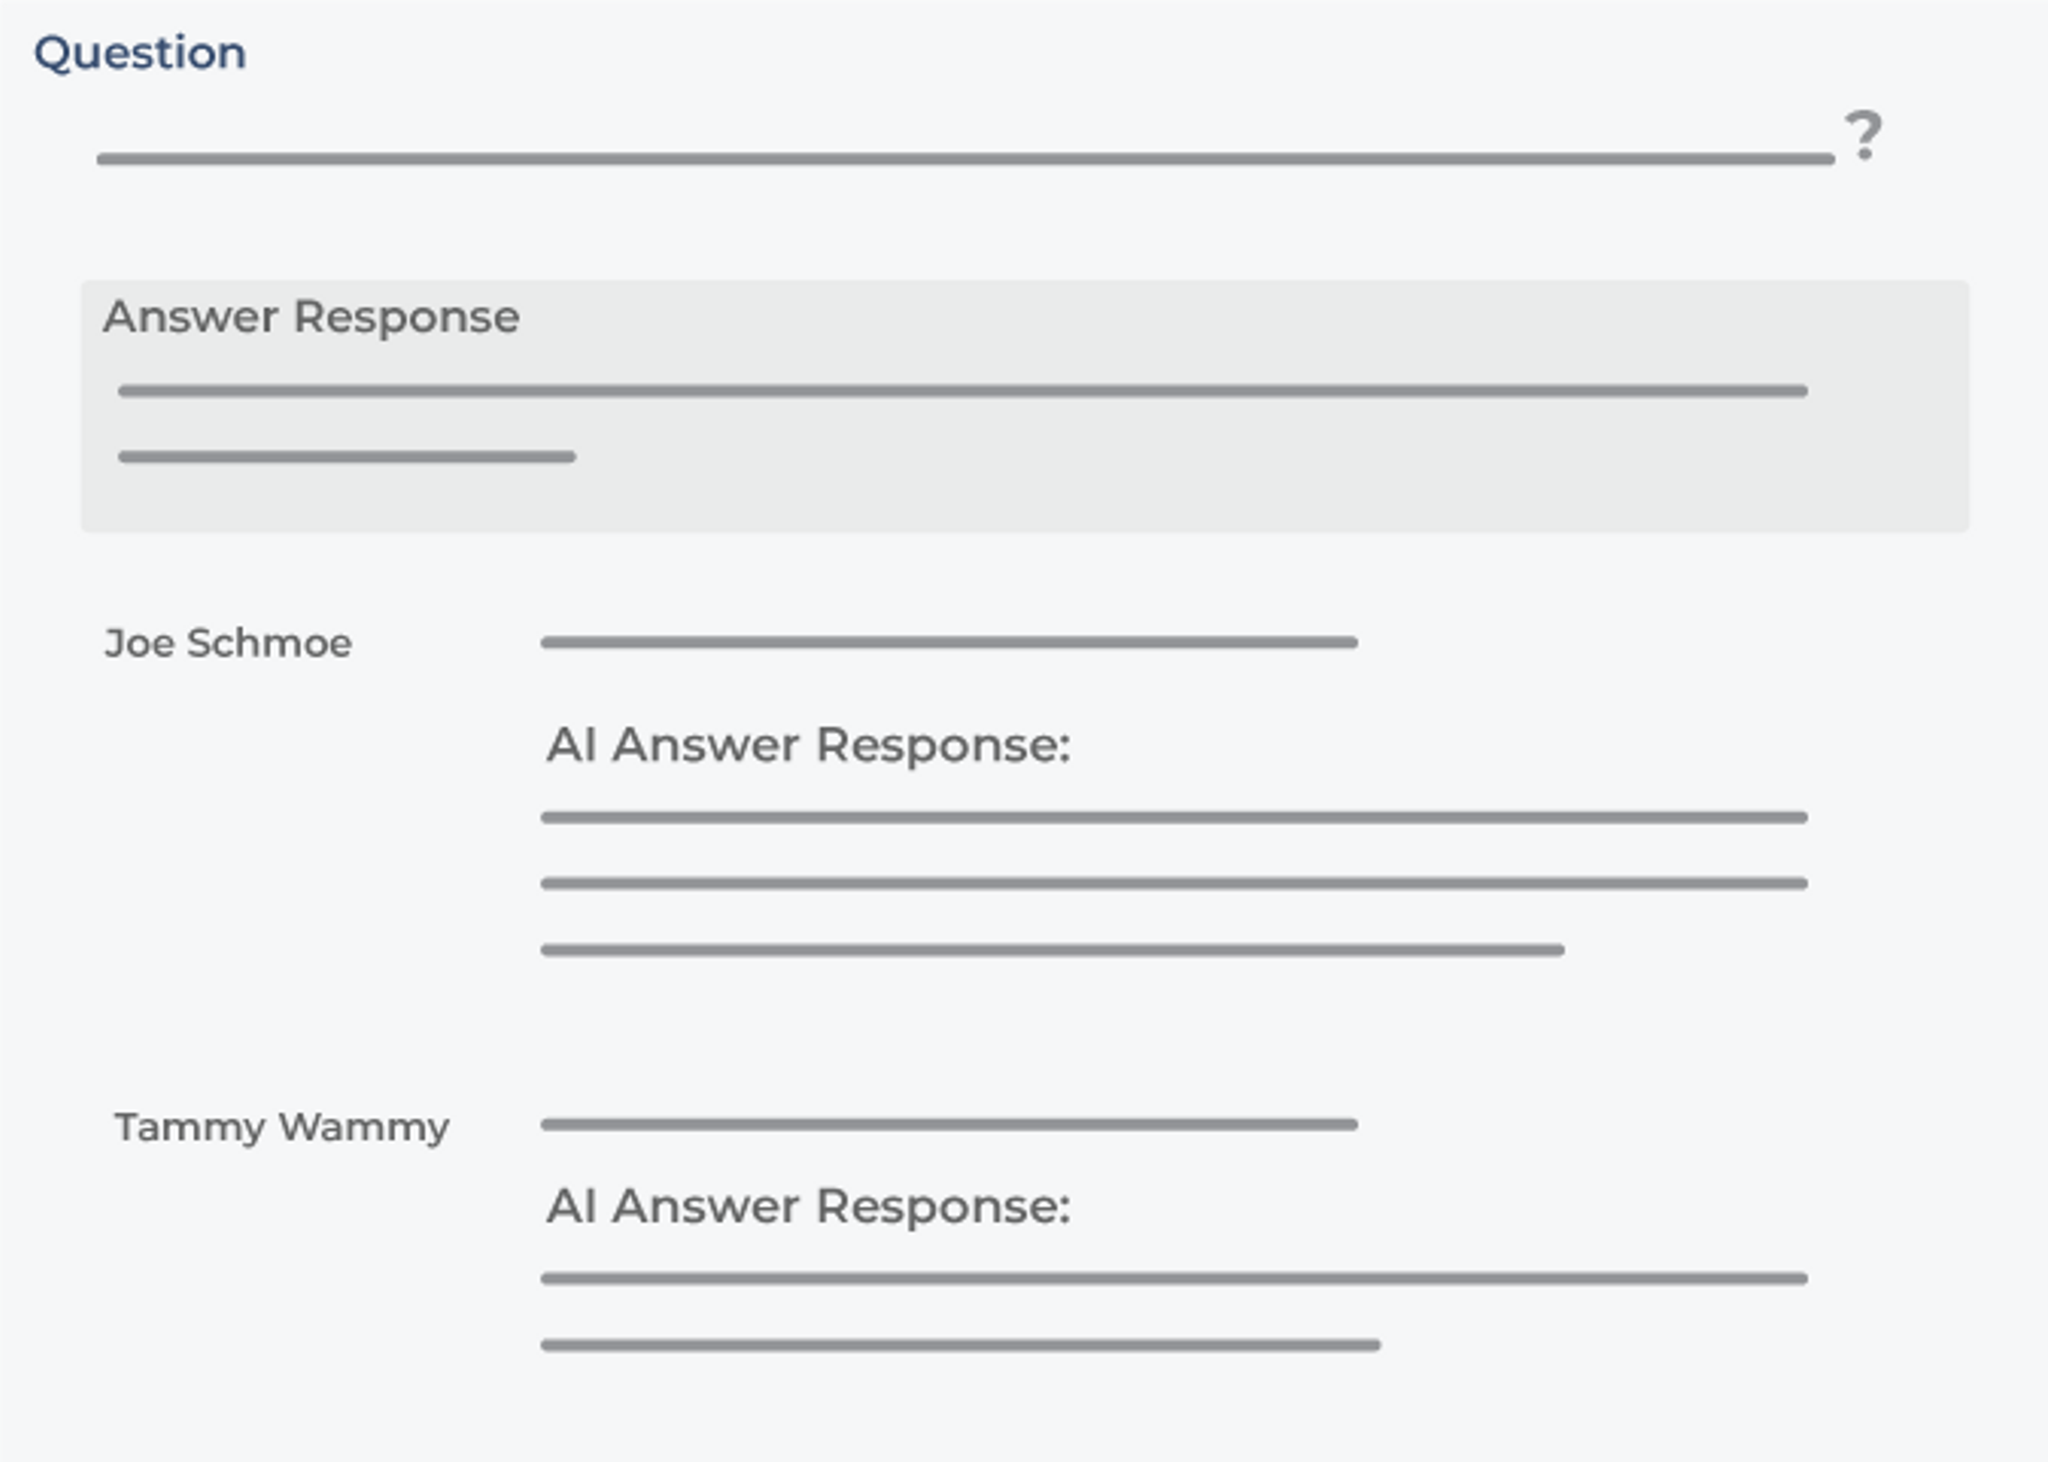
Open-ended questions will display the student's name, their response, and the AI generated response they were given.
Was this helpful?


