Value-added Flow Chart
The value-added flow chart is a mechanism to improve cycle times and productivity by visually separating value-adding from non-value-adding activities. The process is very straightforward, as outlined below:
- List all of the steps in a process from beginning to end.
- Create a diagram with a box for every step, in sequence.
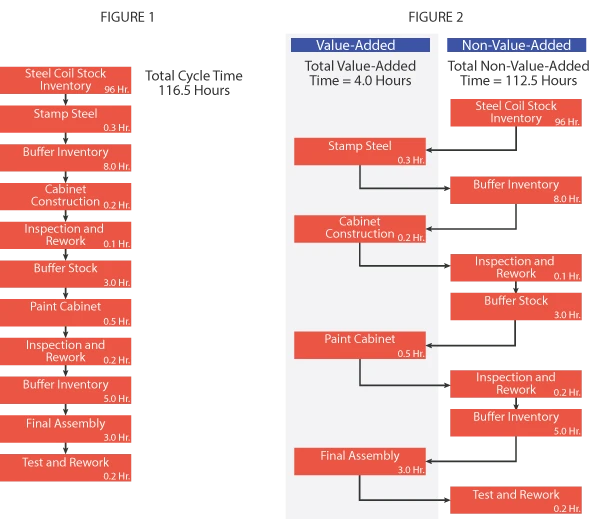
- Calculate the time currently required to complete each step of the process, and add that time to the box - See FIGURE 1 below.
- Add the time in each box to yield the Total Cycle Time.
- Identify those steps that do not add value to the process. Non value-added operations include: inspection, test, rework, set-up, inventory buffers, product movement other than customer delivery - any activity that does not improve the form, fit, or function of the product on the first pass through the process.
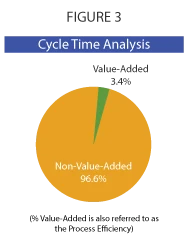
- Move the boxes representing non-value-added processes to the right of the value-adding steps -see FIGURE 2 below.
- Add the time in each of the non-value-added processes to yield the Non-Value-Added Cycle Time. This is the waste that could be eliminated if only value-added steps were performed.
- Add the time in each of the value-added process to yield the Value-Added Cycle Time.
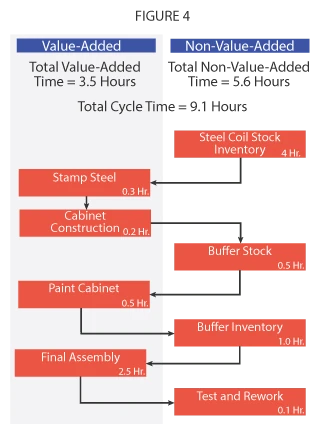
- Calculate the percentage of the Total Cycle Time that is a function of Non-Value-Added operations. You may wish to construct a pie chart to communicate the analysis - see FIGURE 3 below.
- Identify the target process configuration using benchmarking and best-in-class analysis.
- Diagram the target process and determine the Total Target Cycle Time - see FIGURE 4 below.
- Analyze the Non-Value-Added steps to identify actions to reduce or eliminate these operations.
- Analyze the Value-Added steps to identify improvement opportunities and implement actions to reduce the cycle time.
- Diagram the improved process, compare to the target process, and identify gaps for further improvement actions on an ongoing basis until the target is achieved.
Summary
Value Added Flow Charts give teams vision into where processes are creating value and where potential improvement efforts should be targeted. The charts are effective at showing current state and improvements resulting from projects. Teams can understand the value of process steps and identify waste in various forms. The tool is a corner stone of any process improvement toolbox.