Six Sigma Conversion Table
A Six Sigma conversion table is a tool for translating defect rates (defects per million opportunities or DPMO) into corresponding Sigma levels.
There are a few key factors to know that will help you understand this tool better. These include:
- Sigma Levels and what they indicate
- Defects Per Million Opportunities (DPMO)
- Yield
- How to calculate Sigma levels
- Process Capability Index (Cpk) and how it relates to Sigma level and DPMO
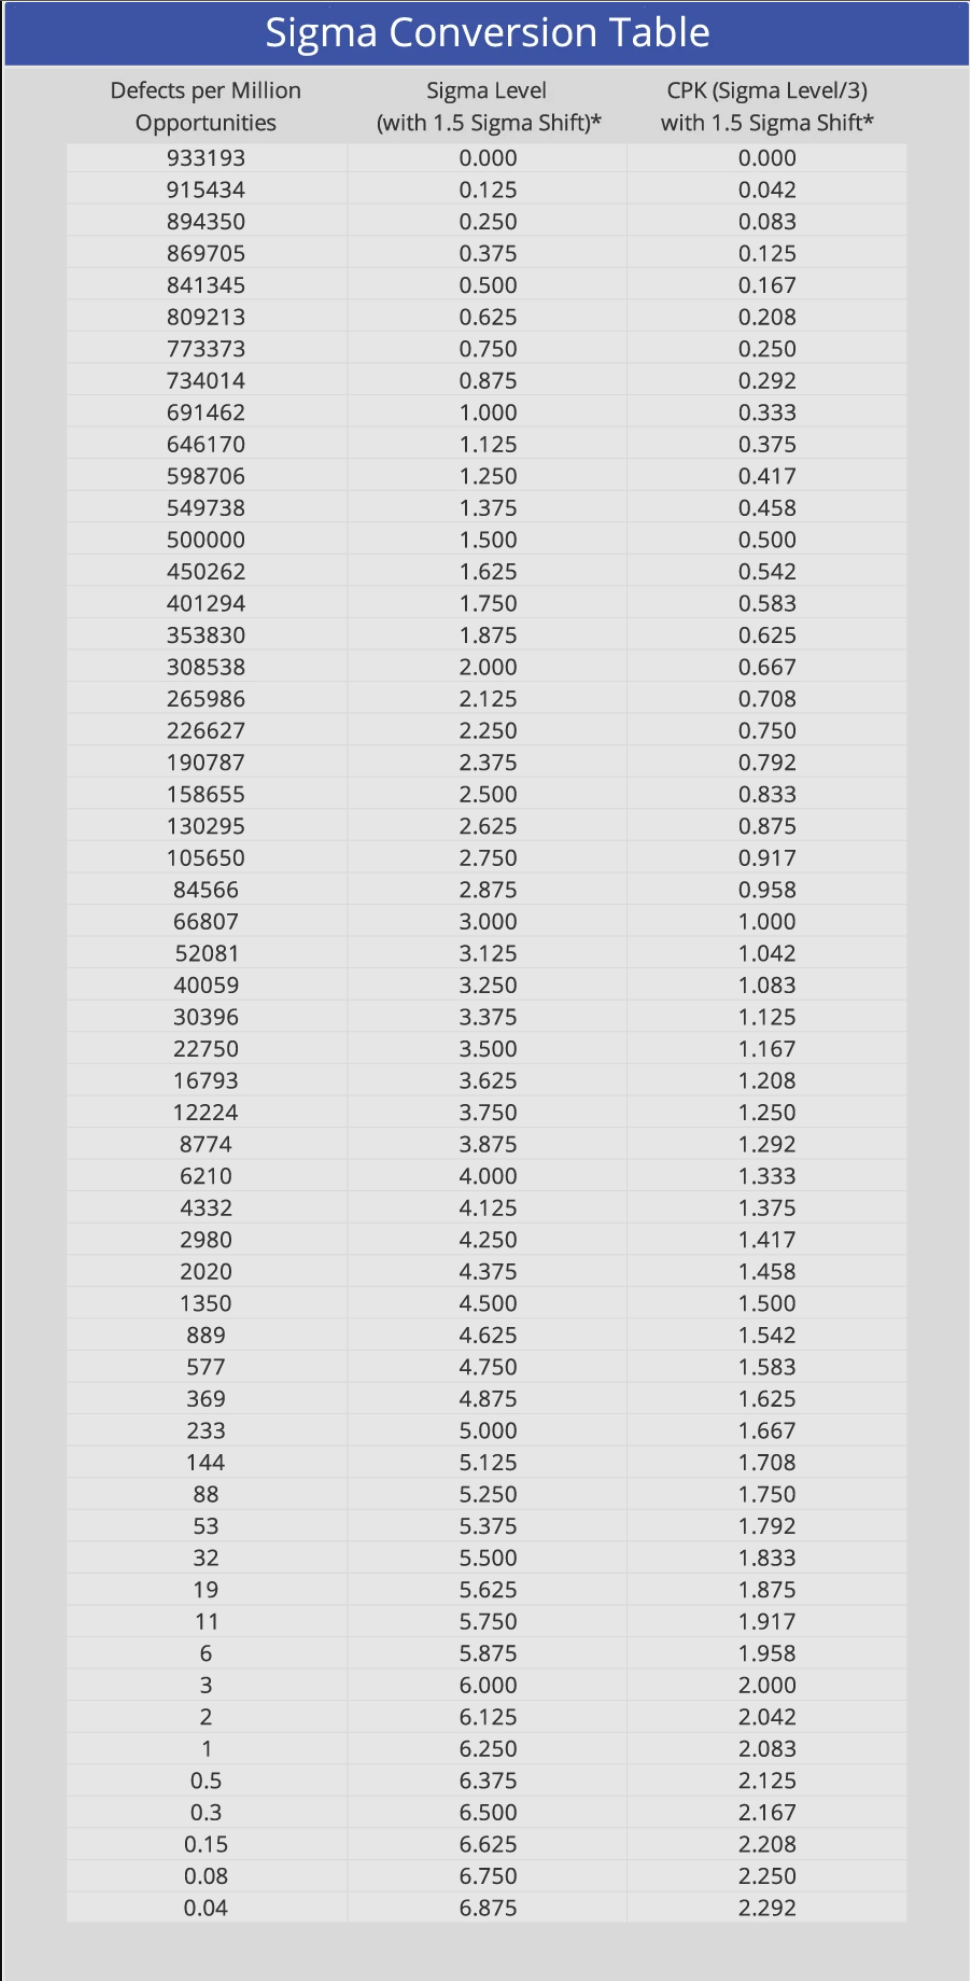
* The table assumes a 1.5 sigma shift because processes tend to exhibit instability of that magnitude over time. In other words, although statistical tables indicate that 3.4 defects / million is achieved when 4.5 process standard deviations (Sigma) are between the mean and the closest specification limit, the target is raised to 6.0 standard deviations to accommodate adverse process shifts over time and still produce only 3.4 defects per million opportunities.
What is Defects Per Million Opportunities (DPMO)?
Defects Per Million Opportunities (or DPMO) is a metric that quantifies the number of defects (any process output that does not meet customer requirements) in a process per one million opportunities where a defect could occur. By calculating DPMO, businesses can pinpoint how often a process fails to meet the desired quality standards.
What Do Sigma Levels Indicate?
The Sigma level indicates the capability and quality of a process to produce output within specified limits.
Sigma levels provide a statistical measure of process capability. Ranging from 1 Sigma to 6 Sigma, each level indicates the degree of defects within a process:
1 Sigma: A process with very poor quality, with approximately 690,000 defects per million opportunities (DPMO).
2 Sigma: Still poor quality, with about 308,000 DPMO.
3 Sigma: Moderate quality, about 66,800 DPMO, which translates to 93.32% yield.
4 Sigma: Good quality, roughly 6,210 DPMO or 99.38% yield.
5 Sigma: Excellent quality, approximately 233 DPMO or 99.977% yield.
6 Sigma: Excellent quality, 3.4 DPMO, corresponding to a yield of 99.99966%. This metric is the target level for Six Sigma projects.
What is Yield?
Yield represents the percentage of units produced correctly without defects on the first attempt. High yield rates signify efficient processes with minimal waste and maximum quality.
Why are Sigma Levels and DPMO Important?
Both sigma levels and DPMO are integral when implementing effective quality control and continuous improvement processes. They help set targets, measure performance, and drive strategic decisions.
Understanding and improving Sigma levels and DPMO is vital for several reasons:
Business Efficiency: Higher Sigma levels mean fewer errors and less waste, leading to more efficient operations.
Customer Satisfaction: Quality products and services boost customer satisfaction and loyalty.
Profitability: Improved quality and efficiency can significantly impact the bottom line.
These metrics are indispensable in the Six Sigma methodology, aiding businesses in assessing and enhancing their process performance.
Organizations should always strive for a Six Sigma level of quality. It might seem like 99.97%, 99.38%, or even 93.32% is “good enough” (after all, those would all be considered ‘A’s’ in school, a metric that everyone was raised to believe is the best). However, when it comes to improving quality, our products, technology, and expectations of product safety are too complex to allow much room for error.
Here are some examples to give perspective:
- Approximately 4 million babies are born in the U.S. annually. If the probability of taking home the correct baby was only 99.9%, then 4,000 families would leave with the wrong baby each year.
- On an annual basis, approximately 17,000,000 cars and trucks are sold in the U.S. At a quality level of 99.9% on seat belt attachments, consumers would experience 17,000 missing seat belt bolts annually.
- For those undergoing surgery in the U.S., a 99.9% quality level would yield 70,000 patients annually with surgery performed on the wrong part of their body.
How Do You Calculate Sigma Level?
- Identify all Defects and Opportunities
- Calculate Defects Per Million Opportunities (DPMO):
- DPMO is calculated using the formula: DPMO = (Total Defects/Total Opportunities) X 1,000,000
- Use EngineRoom’s Sigma Level calculator, or the Sigma Conversion Table (see above).
What is the Process Capability Index?
The Process Capability Index (Cpk) is a statistical measure used in quality control and process improvement to assess a process's capability to produce products or services within the specification limits. It quantitatively assesses how well a process meets customer or design specifications.
Choosing the Right Sigma Conversion Table Software
Problems within an organization can stem from various sources. That’s why it is essential to pinpoint the issues contributing the most to these problems and find the resolutions that would yield the highest impact. EngineRoom’s Sigma Level Calculator makes it simple to understand where an organization stands in its quality journey, whether it is starting with raw defect data or already aggregated information.
Users can input the number of defects and other critical variables, or the DPMO directly, to see how these translate into Sigma levels. The calculated Sigma levels can then be compared to determine the areas with the highest potential for improvement. EngineRoom’s Sigma Level Calculator tool provides a critical measure of your process to provide a clear path to next steps, enhancing the problem-solving cycle.
How Does CpK Relate to Sigma Level and DPMO?
CpK and Sigma levels assess different aspects of process performance, providing a comprehensive view of quality and capability. CpK indicates the process's capability, which can then be translated into a Sigma level using the conversion table.
See a Sigma Level Calculator example in EngineRoom:
Summary
Businesses can dramatically enhance their operational efficiency, product quality, and customer satisfaction by calculating and analyzing metrics like DPMO, sigma level, yield, and CpK. While the initial resource cost of statistical process control can be substantial, the return on investment gained from the information and knowledge the tool creates proves to be a successful activity time and time again.