Process Flow Chart
Definition
The Process Flow chart provides a visual representation of the steps in a process. Flow charts are also referred to as Process Mapping or Flow Diagrams. Constructing a flow chart is often one of the first activities of a process improvement effort, because of the following benefits:
- Gives everyone a clear understanding of the process
- Helps to identify non-value-added operations
- Facilitates teamwork and communication
- Keeps everyone on the same page
There are many symbols used to construct a flow chart; the more common symbols are shown below:

If you have Microsoft Word or Excel, you can access a gallery or symbols in the Autoshapes function, together with a description of their use. The next step is to identify the process steps and link them together with direction arrows.
Example
The following is an example of a very simple flow chart for the process of getting out of bed in the morning:
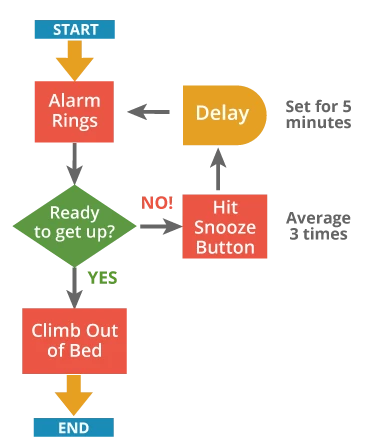
You can make a flowchart more useful by adding information beside the boxes. This flow chart gives a better description of the process when you know that the snooze bar gets hit three times, postponing the inevitable by five minutes each time.
For a more detailed flow chart example, see the Statistical Process Control module from the Toolbox.
Or checkout the detailed tutorial below that shows how to use the Process Flow Chart Tool in EngineRoom:
Process Flow Chart Tutorial
As you develop your flow charting skills, look for feedback loops and indirect consequences. In that way, you will move toward System Diagrams, which identify inter-relationships between activities in addition to the process flow. Constructing a complicated process in a team setting requires communication, and can build team understanding.
MoreSteam Hint: You can add metrics to help evaluate how much value is added (or subtracted!) at each step - time, cost, defects - and create a Value Added Flow Chart by doing so.
Summary
The process flow chart tool can greatly improve any process improvement project by increasing understanding the flow of information, people, and resources. The more data the map incorporates into the design the more beneficial the map will be to your efforts.


