Measurement System Analysis (MSA)
Purpose
The purpose of Measurement System Analysis is to qualify a measurement system for use by quantifying its accuracy, precision, and stability. If measurements are used to guide decisions, then it follows logically that the more error there is in the measurements, the more error there will be in the decisions based on those measurements.
An example from industry serves to illustrate the importance of measurement system quality:
A manufacturer of building products was struggling to improve process yields, which had a significant impact on product cost. Experience indicated that there were several process and environmental characteristics that influenced the process yield. Data were collected on each of the variables believed to be significant, followed by regression and correlation analysis to quantify the relationships in statistical terms.
The results showed no clear correlation between anything - in spite of years of anecdotal evidence to the contrary! In fact, the underlying strong correlation between variables was confounded by excessive error in the measurement system. When the measurement systems were analyzed, many were found to exhibit error variation 2-3 times wider than the actual process spread. Measurements that were being used to control processes were often leading to adjustments that actually increased variation! People were doing their best, making things worse.
As you can see from this example, Measurement System Analysis is a critical first step that should precede any data-based decision-making, including Statistical Process Control, Correlation and Regression Analysis, and Design of Experiments. The following discussion provides a broad overview of Measurement System Analysis.
Characterization
A measurement system can be characterized, or described, in five ways:
Location (Average Measurement Value vs. Actual Value):
- Stability refers to the capacity of a measurement system to produce the same values over time when measuring the same sample. As with statistical process control charts, stability means the absence of "Special Cause Variation", leaving only "Common Cause Variation" (random variation).
- Bias, also referred to as Accuracy, is a measure of the distance between the average value of the measurements and the "True" or "Actual" value of the sample or part. See the illustration below for further explanation.
- Linearity is a measure of the consistency of Bias over the range of the measurement device. For example, if a bathroom scale is under by 1.0 pound when measuring a 150 pound person, but is off by 5.0 pounds when measuring a 200 pound person, the scale Bias is non-linear in the sense that the degree of Bias changes over the range of use.
Variation (Spread of Measurement Values - Precision):
- Repeatability assesses whether the same appraiser can measure the same part/sample multiple times with the same measurement device and get the same value.
- Reproducibility assesses whether different appraisers can measure the same part/sample with the same measurement device and get the same value.
The diagram below illustrates the difference between the terms "Accuracy" and "Precision":
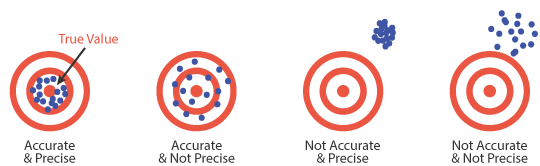
Efforts to improve measurement system quality are aimed at improving both accuracy and precision.
Requirements
Following are general requirements of all capable measurement systems:
- Statistical stability over time.
- Variability small compared to the process variability.
- Variability small compared to the specification limits (tolerance).
- The resolution, or discrimination of the measurement device must be small relative to the smaller of either the specification tolerance or the process spread (variation). As a rule of thumb, the measurement system should have resolution of at least 1/10th the smaller of either the specification tolerance or the process spread. If the resolution is not fine enough, process variability will not be recognized by the measurement system, thus blunting its effectiveness.
Measurement Systems Analysis Fundamentals
- Determine the number of appraisers, number of sample parts, and the number of repeat readings. Larger numbers of parts and repeat readings give results with a higher confidence level, but the numbers should be balanced against the time, cost, and disruption involved.
- Use appraisers who normally perform the measurement and who are familiar with the equipment and procedures.
- Make sure there is a set, documented measurement procedure that is followed by all appraisers.
- Select the sample parts to represent the entire process spread. This is a critical point. If the process spread is not fully represented, the degree of measurement error may be overstated.
- If applicable, mark the exact measurement location on each part to minimize the impact of within-part variation (e.g. out-of-round).
- Ensure that the measurement device has adequate discrimination/resolution, as discussed in the Requirements section.
- Parts should be numbered, and the measurements should be taken in random order so that the appraisers do not know the number assigned to each part or any previous measurement value for that part. A third party should record the measurements, the appraiser, the trial number, and the number for each part on a table.
Stability Assessment
- Select a part from the middle of the process spread and determine its reference value relative to a traceable standard. If a traceable standard is not available, measure the part ten times in a controlled environment and average the values to determine the Reference Value. This part/sample will be designated as the Master Sample.
- Over at least twenty periods (days/weeks), measure the master sample 3 to 5 times. Keep the number of repeats fixed. Take readings throughout the period to capture the natural environmental variation.
- Plot the data on an x̄ & R chart - consult the Statistical Process Control section of the Toolbox and calculate control limits.
- Evaluate the control chart for statistical control. Again, consult the Statistical Process Control section of the Toolbox for assistance with this assessment.
Bias Assessment
1. Subtract the reference value x̄ to yield the Bias
2. Calculate the Bias Percentage:
3. Analyze the results. If there is a relatively high value, examine the following potential root causes:
- Appraisers not following the measurement procedure
- An error in measuring the Reference Value
- Instability in the measurement. If the SPC chart shows a trend, the measurement device could be wearing or calibration could be drifting
Repeatability and Reproducibility Assessment (Gauge R&R):
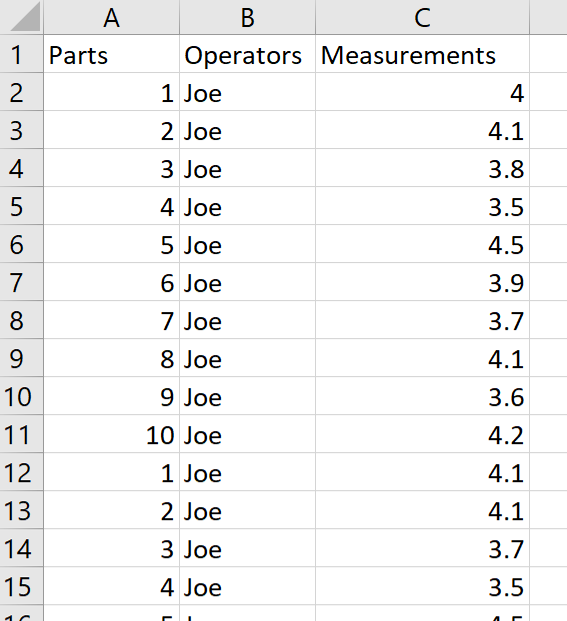
This discussion refers to the data sheet sample shown in the image below. Follow the steps to conduct a Gauge R&R study:
- Set the number of appraisers (operators), trials, and parts, which may vary from study to study. A rule of thumb is 2-3 appraisers, 2-3 trials, and 5-20 parts (with 10 being typical). In this example we will use 2 appraisers, 3 trials, and 10 parts.
- Identify 2-3 appraisers who are all trained in the proper measurement procedure – our example has three appraisers.
- Create a data collection spreadsheet and record the important background information (Gauge Name, Type, Characteristic being measured, Date of MSA, etc.). Also record any specification limits (Lower and Upper) or the Tolerance range (Upper minus Lower specification limit). Our example uses a specification of 4mm +/- 0.75mm. So the Lower specification = 4 – 0.75 = 3.25 mm and the Upper specification = 4 + 0.75 = 4.75 mm. This corresponds to a Tolerance of 1.5 mm.
- Select parts that represent the entire range of process variation. If the parts don't vary as much as the process, the gauge error will be overstated.
- Assign each part a number from 1-10 in such a way that the appraisers cannot identify the parts as they take the measurements.
- Start with one appraiser and measure each of the ten parts in random order. A third party should record the results of the trial. Proceed to the other appraisers, following the same process. Then repeat the process for the remaining trials.
- Record the measurements as shown in the data sheet below. One column contains the part numbers, a second column contains the Appraiser names/IDs and a third column contains the part measurements made by the appraisers across all trials.
The Gauge R&R output includes six charts. First, check the Range and Averages charts:
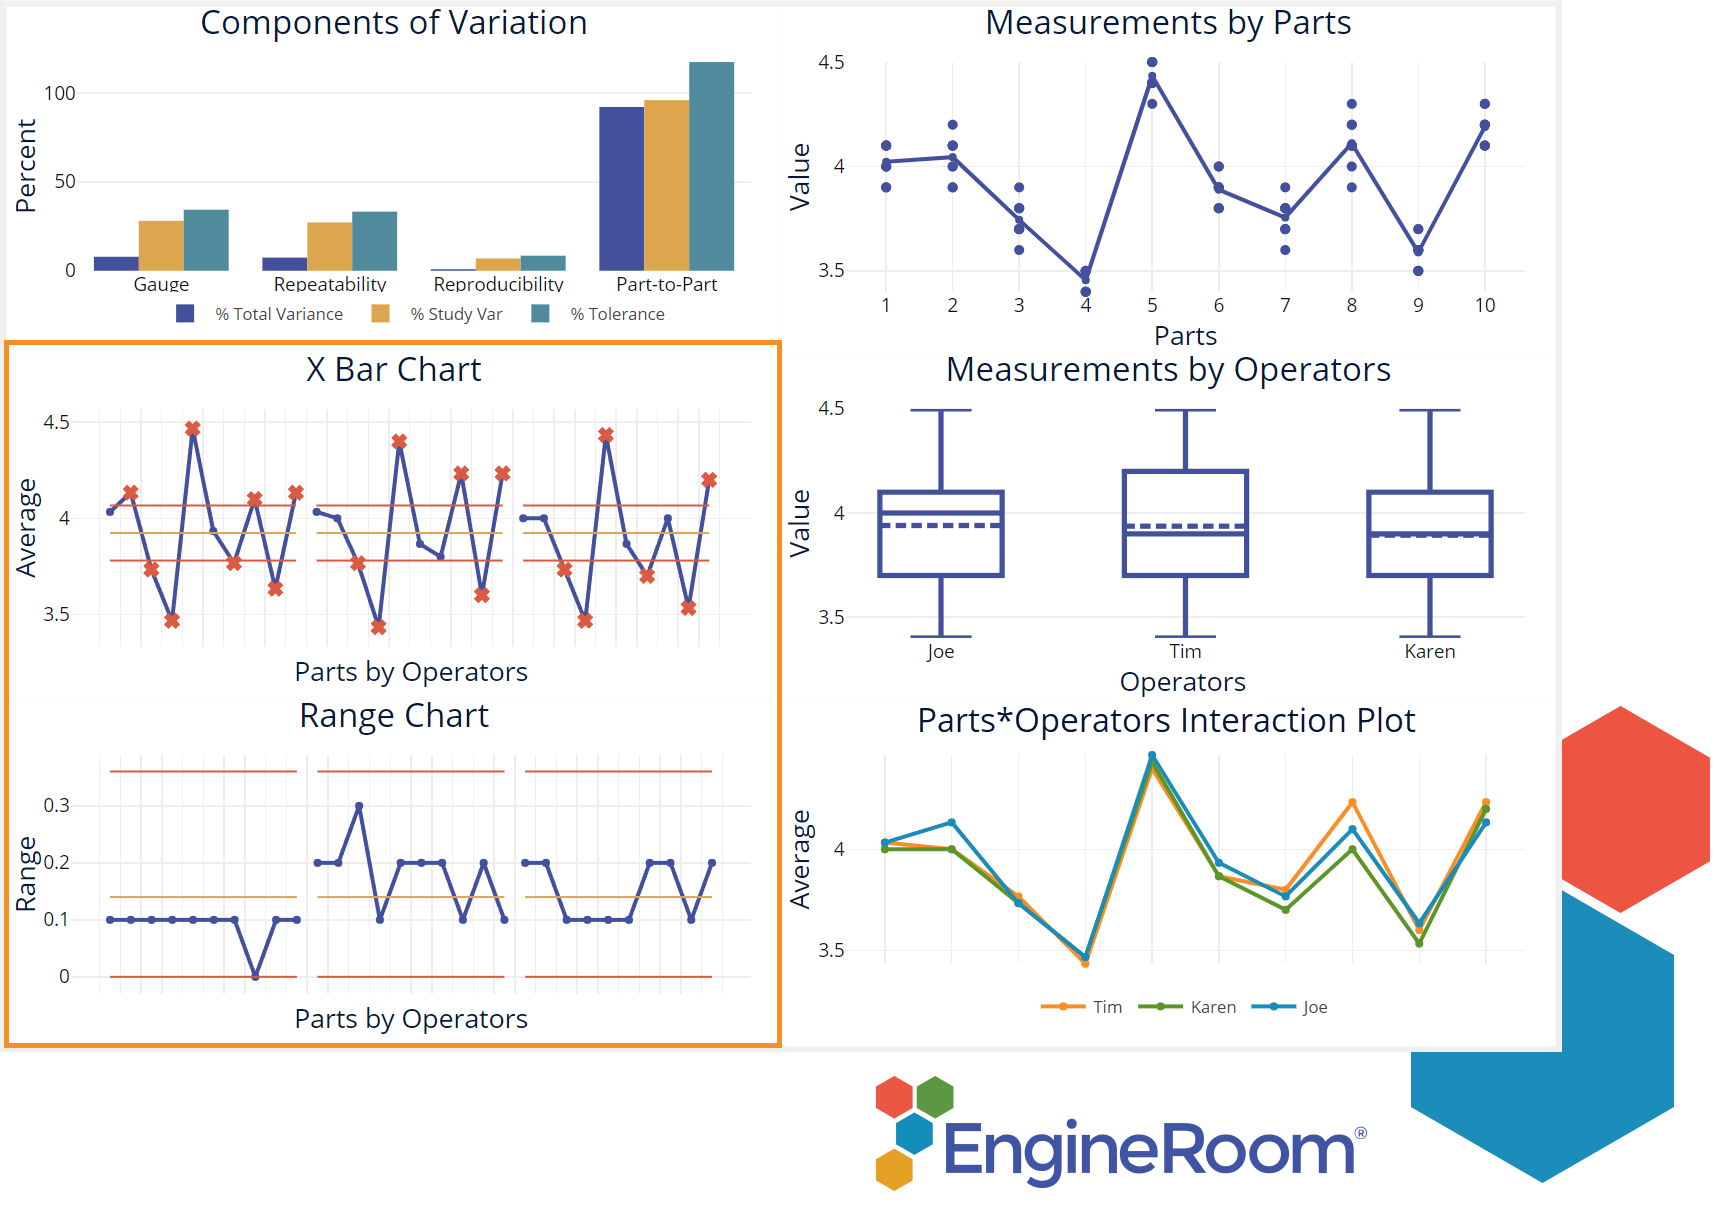
The Range control chart on the left shows the ranges of measurements taken by each operator on each of the 10 parts. This chart must be in control if the appraisers are measuring parts in the same way and with similar variation. Too few unique values represented may also indicate problems with gauge resolution (discrimination, or the ability of the gauge to distinguish among parts.)
The Xbar Chart above that shows the average of measurements (over multiple trials) taken by each operator on the 10 parts. The area between the control limits represents the measurement error, so we want to see plot-points outside the limits.
The remaining 4 charts are shown here:
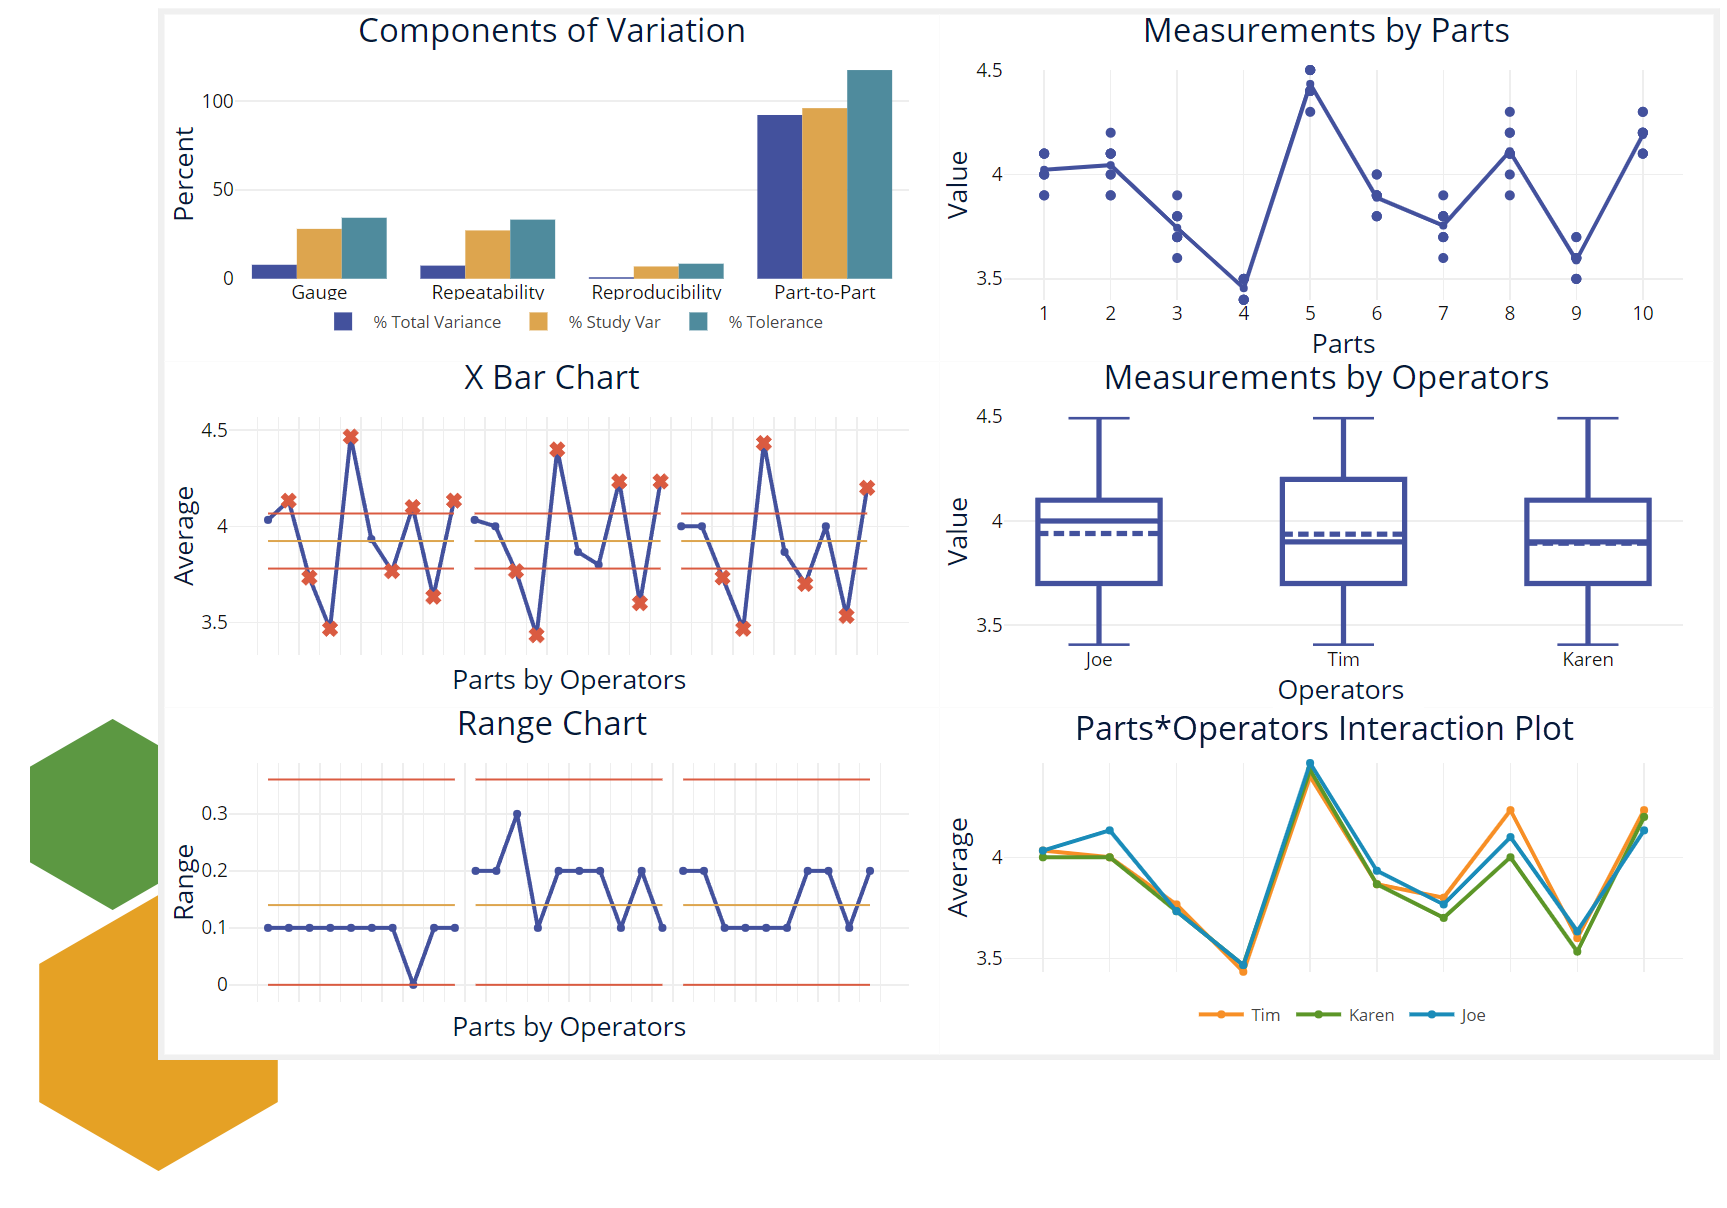
The Components of Variation graph gives the breakdown of Total Variation, Study variation and Tolerance into their components: Repeatability, Reproducibility and Part-to-part. For a good measurement system, the Part-to-part variation should have the tallest bars indicating variation among parts is the biggest component. The Data by Parts and Data by Appraisers graphs show the variability among parts and within the appraisers, respectively. The Parts by Appraiser Interaction graph indicates whether appraisers are measuring consistently across all parts – if they are, the graph will reflect this with lines that are parallel to each other.
Next, consider the numeric output. EngineRoom uses the Analysis of Variance (ANOVA) method to estimate and evaluate the variance components.
The ANOVA table is shown below:
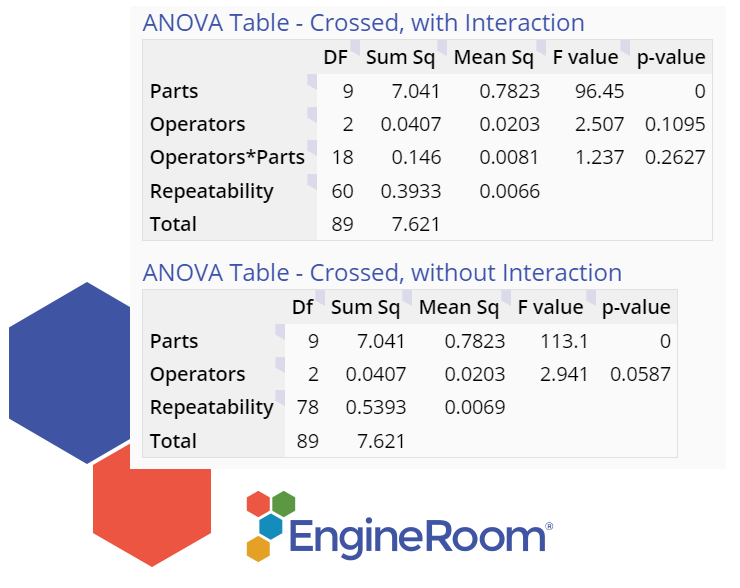
Because the Part by Appraiser interaction is not significant, it is excluded in the second ANOVA table. A good measurement system should have a significant p-value (see last column) only for the Parts.
Finally, the Gauge R&R tables:
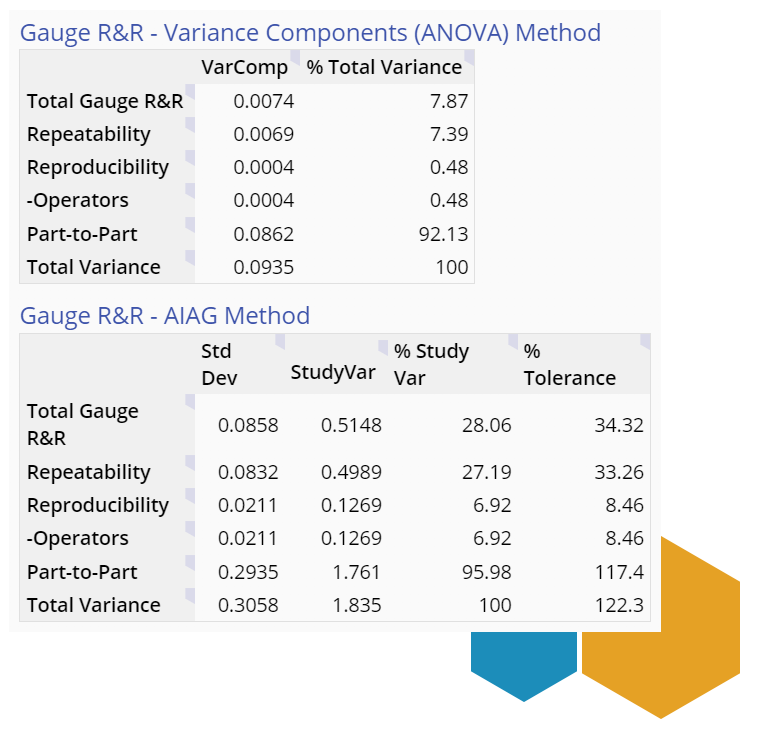
Note: The %Tolerance column is displayed only if you entered at least one specification limit or a tolerance value, and an additional %Process Variation column (not shown here) is displayed only if you entered a Historical Standard Deviation value in the study settings.
The ‘% Total Variance’ column shows that repeatability and reproducibility (Total Gauge R&R) variation make up about 8% of the total variation, while the parts make up the remaining 92%.
The guidelines for interpreting these numbers is shown:
| %Gauge R&R compared to Total Variation | Decision/Conclusion |
|---|---|
| %Gauge R&R compared to Total Variation : GRR ≤ 1% | Decision/Conclusion: The measurement system is acceptable. |
| %Gauge R&R compared to Total Variation : 1% < GRR ≤ 9% | Decision/Conclusion: The measurement system may be acceptable based on other considerations (cost to switch, type of application, etc.) |
| %Gauge R&R compared to Total Variation : 9% < GRR | Decision/Conclusion: The measurement system is not acceptable. |
Thus, our results based on %Contribution indicate the gauge is acceptable.
The (Automotive Industry Action Group) AIAG guidelines for interpreting the results from the %Study Variation and %Tolerance columns are as follows:
| %Gauge R&R (GRR) | Decision/Conclusion |
|---|---|
| %Gauge R&R (GRR): GRR ≤ 10% | Decision/Conclusion: The measurement system is acceptable. |
| %Gauge R&R (GRR): 10% ≤ GRR ≤ 30% | Decision/Conclusion: The measurement system may be acceptable based on other considerations (cost to switch, type of application, etc.) |
| %Gauge R&R (GRR): 30% < GRR | Decision/Conclusion: The measurement system is not acceptable. |
The ‘% Study Var’ and ‘% Tolerance’ columns use the standard deviation estimates of the components instead of the variances, so the components do not add up to 100%. For this reason, the values in those columns are not true proportions, and should be interpreted with care. In this case,
- The ratio of Total Gauge R&R to Total Study Variance is 28% so the gauge is borderline acceptable for the study, but
- The ratio of Total Gauge R&R to the tolerance is 34% so the gauge is not acceptable for meeting customer requirements.
If the measurement system has error in excess of 30%, the first step to improve results is to analyze the breakdown of the error (gauge R&R) source. If the largest contributor to error is Repeatability, then the equipment must be improved. Likewise, if Reproducibility is the largest source of error, appraiser training and adherence to procedures can yield improvement.
You can download the data for the gauge R&R study here.
MoreSteam Hint: If the measurement system is not capable (error above 30%), error can be normalized by taking multiple measurements and averaging the results. This can be time consuming and expensive, but it can be used to provide reliable measurement data while the measurement system process is being improved.
Further Analysis
For additional information on Measurement System Analysis, consult the following:
- An excellent statistics handbook is available free online from a partnership of SEMATECH and NIST (National Institute of Standards and Technology - U.S. Commerce Department) here
- You can purchase an excellent guide to Measurement System Analysis (MSA) for a nominal charge from the Automotive Industry Action Group, or by calling (248) 358-3570. The AIAG also offers publications on other topics:
- QS-9000
- Advanced Product Quality Planning (APQP)
- Failure Mode and Effects Analysis (FMEA)
- Statistical Process Control (SPC)
- Juran's Quality Handbook (Juran's Quality Handbook, 5th Ed) by Joseph M. Juran (Editor), A. Blanton Godfrey (Editor), A. Blanford Godfrey ISBN: 007034003X
Choosing the Right MSA Software
Getting results on a continuous improvement initiative means starting with an accurate, data-rich picture of the current state. Without it, teams risk making decisions that can make problems worse - even if data might point toward progress. By using EngineRoom’s measurement systems analysis tools early on in the DMAIC process, you can be assured that the data you gather in future steps are accurate and reliable.
EngineRoom’s Attribute Agreement Analysis and Gauge R&R tools offer user-friendly routes for analyzing different types of measurement system data and steering follow-up decisions in the right direction. With these tools, users can input operator-specific data points and set EngineRoom to calibrate results based on various factors, including desired repeatability and process tolerance. In return, EngineRoom produces a comprehensive summary in graphical and numerical form that ranges from decisive recommendations on the measurement system to operator-level pass/fail results. Using EngineRoom in this critical phase of the DMAIC process can be vital in making the right data-driven decisions later.
Summary
Measurement Systems Analysis is a key step to any process improvement effort. By understanding existing measurement systems, a team can better understand the data provided by those systems and make better business decisions.