System Diagrams
Introduction
System Dynamics is the study of the behavior of complex systems - seeking to understand the web of relationships between activities and to identify the linkage between cause and effect. System Diagrams are models used to visually express the dynamic forces acting upon the components of a process and the interactions between those forces.
System Diagrams are more than process flow charts. They include feedback loops and other factors that influence how decisions are made, including attitudes, perceptions, and behaviors. If you are familiar with the terms "vicious circle", "downward spiral", "the law of unintended consequences", or "the cure is worse than the disease" you are familiar with some of the basic concepts of System Dynamics. System Diagrams provide a common language to help organizations think about these complex issues.
Efforts to improve the performance of complex systems inevitably touch on many areas directly and indirectly, so it is critically important to understand the potential for unintended consequences. It is also important to understand the true leverage points to improve a system, which probably won't be obvious.
Background
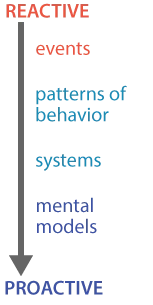
Systems Thinking initiatives strive to broaden organizational perspective by moving the organization away from a focus on Events (reaction) to recognizing Patterns of Behavior, then understanding Systems, and finally to master the Mental Models which frame the perspectives of the people who drive the system and ultimately determine its performance.
Characteristics of Dynamic Systems
As you work to understand System Dynamics you will undoubtedly encounter the following phenomena, many of which may already be familiar:
- As George E. P. Box said: "All models are wrong. Some models are useful." System Dynamics stresses that there is no single right answer. There are often trade-offs that require choices. Those choices may be influenced by a particular point of view.
- Cause and effect are separated by a lot more time and distance than you think. Time delays greatly complicate the effort to firmly connect cause with effect - particularly when there are multiple causes and multiple effects.
- The more you try to improve the system, the stronger the resistance to change. This is the result of "balancing loops" - forces that counteract changes.
- There are unintended consequences and indirect effects. Sometimes the most obvious solution makes a problem worse.
- Things can get worse before they get better. Consider a company with poor cash flow that has under-invested in its plant and equipment. In the short term, catching up on the investment will depress cash flow further, although the long term impact may be positive.
- Reinforcing Loops amplify small changes into big changes.
Creating System Diagrams is the first step to develop the System Thinking skills needed to understand and manage these complex phenomena.
Examples
The best way to gain an understanding of Systems Thinking is to review some real world examples:
Here is an example of a fix that backfired - in a big way.
An automobile manufacturer was suffering from poor financial performance, so it launched an aggressive cost reduction program aimed at purchased material. The supply base was pressured to cut prices significantly, which in turn prompted internal cost reduction activities.
However, engineering changes were processed without adequate testing. Short term financial goals were met, but component reliability suffered, and the indirect consequences of poor quality vastly outweighed the direct cost reductions that were realized.
This case is a perfect example of the need to take a Systems Thinking approach to process improvement projects - to anticipate the possible unintended consequences, and place adequate countermeasures in place on a proactive basis. The system diagram is shown below:
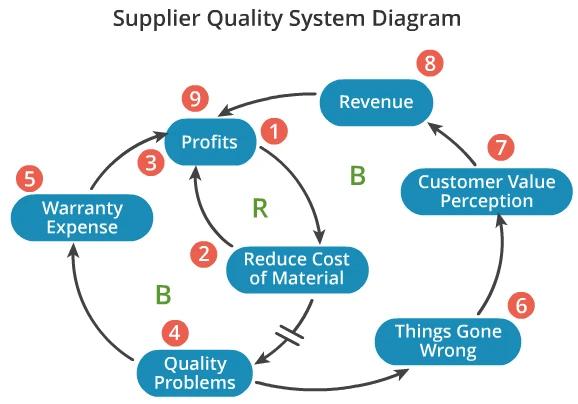
- Profitability at a major auto manufacturer is falling short of expectations.
- Pressure is applied to the supply base to reduce the cost of purchased materials. In this case, a remote entry key fob is involved (remote lock/unlock).
- The short-term impact of the material cost reduction initiative is favorable, leading to an improvement in the profit margin. This is a Reinforcing Loop.
- However, in the rush to squeeze cost out, the engineering changes that led to reduced material cost were not subjected to the proper durability tests. Internal switch contacts were changed from copper to tin. After a time lag, virtually 100% of the parts fail.
- Warranty expense increases (Balancing Loop).
- Customers experience the product failure (Things Gone Wrong).
- Reliability problems have a negative impact on customer perceptions of product value.
- Revenue is impacted adversely as less customers are satisfied with product value due to poor reliability (Balancing Loop).
- Profits suffer from a double-whammy: revenue is depressed while warranty expense increases. This is the complete opposite of the intention of the original action - an unintended consequence that puts further pressure on cost reductions to boost profits!
Application
To create a System Diagram, recall the hierarchy of system understanding - with the goal of moving away from managing events (reactive) to managing systems and mental models (proactive):
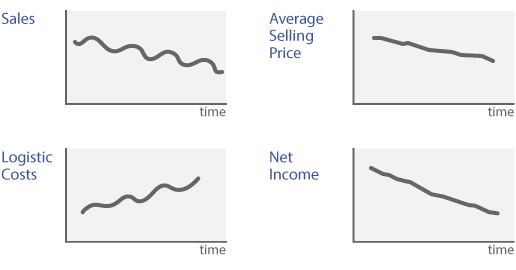
For an example, we'll use a sales and profitability example from an appliance manufacturer trapped in a downward spiral of price discounting to maintain sales volume.
A. The first step is to identify events:
- Sales are short of expectations.
- Profits are terrible.
B. Next, look at patterns of behavior. Graph the indicators that help describe the problem:
C. Third, identify the activities that are involved, and draw linkages to show forces and feedback loops, as in the diagram below. Use the 5-Why Analysis from the Toolbox to help identify the root cause of behaviors and patterns.

- At the mid-point of the month, revenue is falling short of expectations.
- In order to make up lost revenue and meet the sales plan, prices are discounted at the end of the month to spur sales.
- Customers become conditioned to expect a "deal" at the end of the month, so they wait for the discount and don't order early in the month, perpetuating the cycle by depressing sales early in the month.
- Price discounting erodes profit margins.
- Pricing discounts at the end of the month create uneven shipment volumes as orders are bunched at the end of the month.
- Premiums are paid to handle higher shipment volumes at the end of the month, leading to higher logistics costs.
- Profit margins are eroded by the increased logistics costs.
- With lower profit margins, pressure on revenue growth increases to offset the lower margins and preserve bottom-line profitability.
- Increased revenue expectations aggravate the original problem - a "Vicious Cycle."
Note: In this diagram, all of the feedback loops are Reinforcing Loops, amplifying the main effect of price discounting - a strong engine of decline.
D. Lastly, examine the mental models (perceptions, attitudes) that perpetuate the system.
- Division President -"We will meet our monthly target no matter what. If we try to break our price promotion pattern, sales will suffer, and I'll be looking for a job."
- V. P. of Marketing - "My bonus is based on sales growth. If the logistics people can't meet their budget, that's their problem."
- Salesman - "I got my orders in during the month (last couple of days). The orders are there, so the logistics people ought to get them shipped so I get my commission (which is based on sales only, without regard to costs)."
- Customer - " All I have to do is out-wait them for a better price at the end of the month. They do it every time."
Summary
Process improvement is not a linear, mechanical exercise. Processes improvement is inherently messy because the attitudes and behavior of the people who drive the capability of many processes. System Thinking can contribute to an understanding of the inter-relationships at the root of the "messiness" that causes fixes to backfire and other unintended consequences.
We strongly recommend the following books for further reading. In particular, the Fifth Discipline Fieldbook offers many helpful real world examples:
Resources
- The Fifth Discipline - The Art & Practice of The Learning Organization. Peter M. Senge, ISBN 0-385-26095-4
- The Fifth Discipline Fieldbook - Strategies and Tools for Building a Learning Organization. Senge, Ross, Smith, Roberts, Kleiner, ISBN 0-385-47256-0